 Open Access Article
MnO2 modified TiN nanotube arrays on Ti mesh for flexible supercapacitors electrode†
Chao Chena and
Xiuchun Yang *ab
*ab
aSchool of Materials Science and Engineering, Tongji University, Shanghai, 201804, People's Republic of China. E-mail: yangxc@tongji.edu.cn
bKey Laboratory of Advanced Civil Engineering Materials, Tongji University, Education of Ministry, Shanghai 201804, People's Republic of China
First published on 15th December 2017
Abstract
A facile and economical strategy to develop a novel 3D binder-free and flexible electrode of supercapacitors with high performance was successfully designed by constructing MnO2/TiN nanotube arrays (NTAs) on a Ti mesh substrate. Their phase compositions, microstructures and photo-electrochemical properties were characterized by X-ray diffraction (XRD), field emission scanning electron microscopy (FESEM), X-ray photoelectron spectroscopy (XPS) and electrochemical measurements. The results indicate that MnO2 is filled in the bottom of the interval of 3D-TiN NTAs, and its thickness rises with the increase in the deposition cycles. Sample TM(200) exhibits a specific capacitance of 550 F g−1 at a scan rate of 5 mV s−1; its specific capacitance decreases with increasing scan rate. The specific capacitances in the TM series samples are far larger than those in TiN NTAs and T(200) samples. A mechanism is given to explain the excellent capacitive performance.
1. Introduction
With the development of renewable energy and electric vehicles, the need to develop efficient energy storage devices is becoming increasingly urgent, due to the need for high power density, fast charge and discharge rates, and long-term cycling stability. Among all energy storage devices, supercapacitors have received extensive attention by domestic and foreign scholars. Based on the energy storage mechanism, supercapacitors can be classified into two categories: electrochemical double-layer capacitors (EDLCs) and pseudocapacitors.1,2 The capacitance in EDLCs stems from non-faradic electrostatic adsorption/desorption of electrolyte ions at the surfaces.3 However, the pseudocapacitors store energy through a faradaic process that involves fast and reversible redox reactions occurring at or near the electrode surface.4 The EDLCs often present low intrinsic capacitance and low-density energy.5 In contrast to EDLCs, the capacitance of pseudocapacitors is usually higher depending on the faradaic charges generated at or near the electrode surface. Therefore, it is extremely important for using materials with reversible redox reactions, high reaction rates and high electronic storage ability in a short period of time. The most widely explored pseudocapacitive electrode materials include conducting polymers,6–8 transition metal oxides (RuO2,9 MnO2,10 Co3O4,11 NiO12 and Fe2O3 (ref. 13)) and hydroxides. Among these transition metal oxides, MnO2 was first proven as an electrode material that performs well for supercapacitors by Goodenough et al.14 due to its low-cost and high performance. MnO2 charge storage behavior can be illustrated according to two mechanisms: one is a fast faradaic response on the surface adsorption/desorption of electrolyte cations; the other is intercalation and extraction of cations into the crystalline lattice layer: MnO2 + C+ + e− ↔ MnO2 − C+, (C+ = H+, Na+, K+).15 Its further potential applications are primarily hindered by low surface area and intrinsically poor electrical conductivity (10−5–10−6 S cm−1).16 Therefore, the main challenge for transition metal oxides is to enhance their conductivities. Liu et al.17 fabricated pearl-chain-like MnO2 arrays on a Ti grid by a facile hydrothermal approach, exhibiting a high specific capacitance with 313.6 F g−1 at a current density of 0.5 A g−1. Compared to a plane conductor, a Ti grid has many advantages, such as a three dimensional surface area, a higher electrolyte flow ability, a larger Ti conversion rate, easy access for electron transport in an electrolyte and more flexibility. Moreover, Liu et al.18 have developed a one-pot chemical approach to fabricate crystalline anatase TiO2 onto graphene oxides, which can improve device the performance in energy conversion and storage applications. Xiao et al.19 utilized robust hydrogenated TiO2 nanotube arrays (NTAs) to enhance MnO2 conductivities. Kang et al.20 improved the electrochemical properties of MnO2 by adding nano-porous gold. Because of the high electrical conductivity of TiN, it was also used to enhance both electron transport through the conductive matrix for the electrode and ion accessibility to the active material from the liquid electrolyte.21–23In this article, we adopted a facile and economical strategy to develop a novel 3D binder-free and flexible electrode of supercapacitors by constructing MnO2/TiN NTAs on Ti mesh substrate due to the structural and TiN electronic advantages of the design. The supercapacitor exhibits a specific capacitance of 550 F g−1 at the scan rate of 5 mV s−1 and retains 83.77% of the preliminary capacitance after 600 cycles at a current density of 9 A g−1.
2. Experimental
2.1. Preparation of flexible 3D TiO2 NTAs
All reagents were of analytical grade and used without further purification. A large piece of raw Ti mesh (50 meshes, 99.5% purity) with a thickness of 0.12 mm was cut into small square pieces of 15 × 7 mm2. They were ultrasonically degreased in acetone, isopropanol and methanol for 15 min, in sequence, and then chemically etched in a mixture of HF and HNO3 aqueous solution (HF![[thin space (1/6-em)]](https://www.rsc.org/images/entities/char_2009.gif) :
:![[thin space (1/6-em)]](https://www.rsc.org/images/entities/char_2009.gif) HNO3
HNO3![[thin space (1/6-em)]](https://www.rsc.org/images/entities/char_2009.gif) :
:![[thin space (1/6-em)]](https://www.rsc.org/images/entities/char_2009.gif) H2O = 1
H2O = 1![[thin space (1/6-em)]](https://www.rsc.org/images/entities/char_2009.gif) :
:![[thin space (1/6-em)]](https://www.rsc.org/images/entities/char_2009.gif) 4
4![[thin space (1/6-em)]](https://www.rsc.org/images/entities/char_2009.gif) :
:![[thin space (1/6-em)]](https://www.rsc.org/images/entities/char_2009.gif) 10 in volume) for 20 s. Subsequently, the square pieces were rinsed with deionized water and finally dried in air. Anodization was performed at 60 V for 24 h in diethylene glycol solution containing 2 vol% HF using Pt plate as the counter electrode and Ti mesh as the working electrode. The as-prepared samples were ultrasonically rinsed with deionized water and dried at 60 °C for 3 h. To convert samples from the amorphous phase to anatase, thermal treatment was performed in air at 450 °C for 3 h.24
10 in volume) for 20 s. Subsequently, the square pieces were rinsed with deionized water and finally dried in air. Anodization was performed at 60 V for 24 h in diethylene glycol solution containing 2 vol% HF using Pt plate as the counter electrode and Ti mesh as the working electrode. The as-prepared samples were ultrasonically rinsed with deionized water and dried at 60 °C for 3 h. To convert samples from the amorphous phase to anatase, thermal treatment was performed in air at 450 °C for 3 h.24
2.2. Preparation of flexible 3D TiN NTAs
The anodized Ti mesh in a quartz boat was placed in the heating center of a horizontal quartz tube furnace. Prior to heating, the system was evacuated and flushed with high purity N2 for 1 h to eliminate oxygen. When the furnace was heated to 600 °C, N2 was replaced with NH3 at a flow rate of 100 mL min−1. Following this, the furnace was heated to 750 °C for 5 h, and subsequently cooled to room temperature in N2 with a flow rate of 50 mL min−1.2.3. MnO2 modified flexible 3D TiN NTAs
All experiments were performed with a CHI 660E electrochemical workstation using TiN NTAs on Ti mesh as the working electrode, platinum plate as the counter electrode and Ag/AgCl electrode as the reference electrode. MnO2 was deposited on 3D TiN NTAs by a pulse electrochemical method in 20 mL fresh electrolyte containing 0.1 M potassium permanganate and 0.1 M sodium sulfate aqueous solution. Pulse electro-deposition was adopted with a pulse voltage of −1.5 V, a pulse time of 1 s and an interval time of 4 s, which permitted the depleted ions to equilibrate in the interval time. The as-prepared samples were taken out from the electrolyte and rinsed with de-ionized water. Weights were evaluated at mMnO2 = 0.012 mg, 0.02 mg and 0.025 mg for the electrochemical depositions onto TiN NTAs for 100, 200 and 300 pulses, respectively. These samples with 100, 200 and 300 pulse cycles were denoted as TM(100), TM(200) and TM(300), respectively. TiN NTAs on Ti mesh were denoted as TiN, while the bare Ti mesh samples with 200 pulse cycles were denoted as T(200). The weight of deposited MnO2 was determined by integration of the total coulombic charges used for deposition over the electrolysis duration. The total charge Q was calculated by integration of the measured current with respect to the time of deposition. This led to the weight of deposited material mMnO2 = Q × MMnO2/3F, with F as the Faraday constant. This weight is however over-estimated since at working potentials of 0.85 or 1.0 V/Ag–AgCl, a part of the charge is used for water oxidation and oxygen evolution.252.4. Characterization
The phase compositions of these samples were measured by a Rigaku D/Max 2400 X-ray diffractometer (XRD) equipped with graphite monochromatized Cu Kα radiation (λ = 0.15405 nm). The chemical nature of Ti and Cu were measured by XPS (ESCALAB 250Xi, Thermo Scientific) using Al Kα (hν = 1486.6 eV, 900 μm of beam spot) as the incident radiation source, and the detected binding energy was calibrated by carbon (C 1s = 284.8 eV). Microstructures and compositions were characterized by a field emission scanning electron microscope (FESEM, Quanta 200 FEG) with energy disperse spectroscopy (EDS). Electrochemical measurement was carried out in 0.5 M Na2SO4 solution with CHI 660E electrochemical three-electrode system with the samples as the working electrode, Pt foil as the counter electrode, and Ag/AgCl electrode as the reference electrode. Cyclic voltammetry (CV) curves were recorded in a voltage range of 0–0.9 V at a series of scan rates. Galvanostatic charge/discharge curves were recorded in a potential window of 0–0.9 V at a series of current densities. The electrochemical impedance spectroscopy (EIS) was conducted in the frequency of 100 kHz–10 mHz at an open-circuit potential vibration of 5 mV.3. Results and discussion
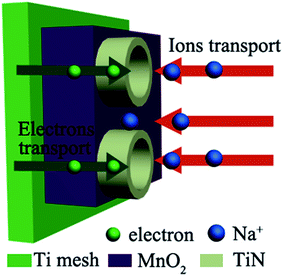
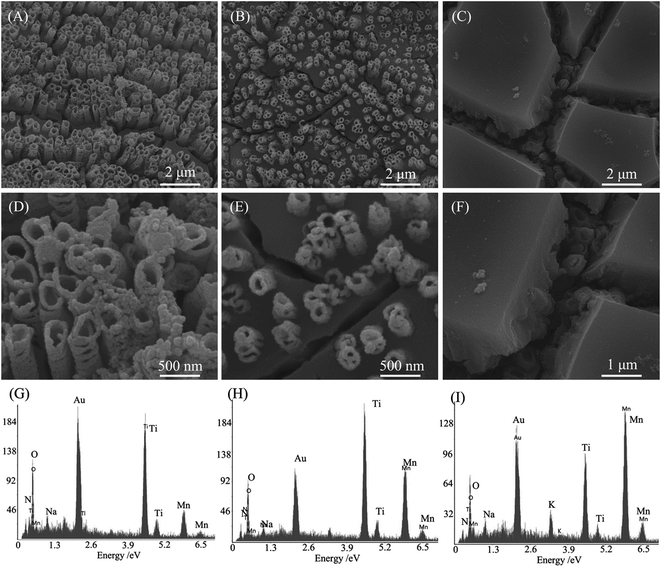
To achieve the aim of decreasing the device resistance, it is crucial to propose rational designs of nanostructured hybrid electrodes for tackling the intrinsic barriers of pseudocapacitive electrode materials. Fig. 1 illustrates the distinct advantages for the designed MnO2/TiN NTAs electrode. First, flexible 3D Ti mesh can offer not only sufficient active sites in contact with electrolyte, but also provide short ion diffusion paths, contributing to high electrochemical energy storage. Second, the vertically grown TiN NTAs maintain the structural integrity during the cycling process and dramatically enhance the faradic reaction of MnO2 by offering superhighways for electrons and ions transport, which could raise the electrical conductivity of MnO2 and relax the delivery of electrolyte ions in nanotubes.Fig. 2 gives FESEM images and the corresponding EDS spectra of samples TM(100), TM(200) and TM(300).
Fig. S1† shows typical FESEM images of TiN NTAs at different annealing temperatures. The results indicate that the morphology of TiN NTAs maintain the structural integrity under 750 °C annealing, and the XRD data indicates that the entire TiO2 is converted to TiN under 750 °C annealing (Fig. S2†).
The FESEM image (Fig. 2) indicates that MnO2 is filled into the bottom of the interval of 3D-TiN NTAs for 100 pulse cycles, and MnO2 film thickness rises with increasing the deposition cycles. 3D-TiN NTAs are fully covered by MnO2 film in 300 pulse cycles. Some MnO2 nanoparticles can be found on the mouth of TiN nanotubes in samples TM(100) and TM(200), which is beneficial for enhancing the capacitance. TiN NTAs standing tall and upright in the MnO2 thin film offers the highway for the transport of electrons and ions. The EDS spectra shows that the samples are composed of Ti, O and Mn elements, and the Mn atomic content increases in the order of 24%, 32% and 46% for electrochemical pulses of 100, 200 and 300 cycles, respectively. The fact that the Mn element originates from the MnO2 film is demonstrated by the XRD patterns of these samples (Fig. 3). Na and K elements originate from the electrolyte.
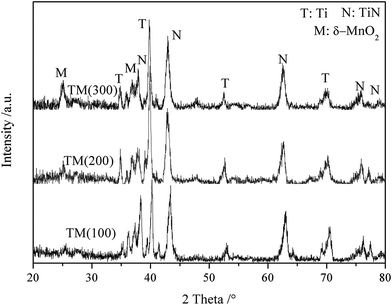
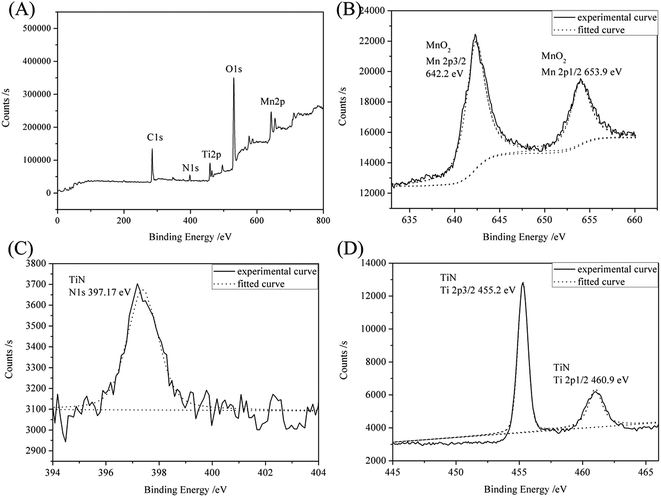
The XRD patterns (Fig. 3) indicate that all samples contain three phases: Ti metal, cubic TiN (JCPDS 38-1420) and δ-MnO2 (JCPDS: 80-1098).26 In addition, no TiO2 is found, indicating that TiO2 nanotubes are transformed into TiN nanotubes in our experimental conditions. The Ti metal originated from the Ti mesh. The peak intensity at 25.2° increases gradually from TM(100) to TM(300), indicating that MnO2 content increases with the pulse cycles, which is consistent with the EDS data (Fig. 2). XPS spectra (Fig. 4) reveal the surface composition and the chemical states of sample TM(200). The spectra in Fig. 4(A) indicate that the elements Ti, Mn, N and O exist in the sample. The spectra in Fig. 4(B) indicate that two main peaks exist at 642.2 and 653.9 eV, which is consistent with the bonding energies (BEs) of MnO2 Mn 2p3/2 and MnO2 Mn 2p1/2, respectively.27 The BE at 397.17 eV (Fig. 4(C)) can be attributed to TiN N 1s;28 similarly, the BEs at 455.2 and 460.9 eV (Fig. 4 (D)) can be attributed to TiN Ti 2p3/2 and Ti 2p1/2, respectively.29 These results further demonstrate that MnO2 is filled in the 3D-TiN NTAs by electrochemical deposition.
Fig. 5 shows the cyclic voltammetry curves and the corresponding unit area capacitance of samples TiN, TM(100), TM(200) and TM(300) at the scan rate of 10 mV s−1. Among these samples, the TM(200) electrode shows a nearly symmetrical rectangular-shaped CV curve. Capacitances were calculated based on formula (1) and indicating that the sample TM (200) has the highest specific capacitance among these samples. It is 76.8% higher than sample TiN NTAs and 58.6% higher than sample T(200) as shown in Fig. 5(B). These results indicate that the vertically grown 3D TiN NTAs can offer not only sufficient active sites in contact with the electrolyte, but also dramatically enhance faradic reaction of MnO2 by offering superhighways for electrons and ions transport.
 | (1) |
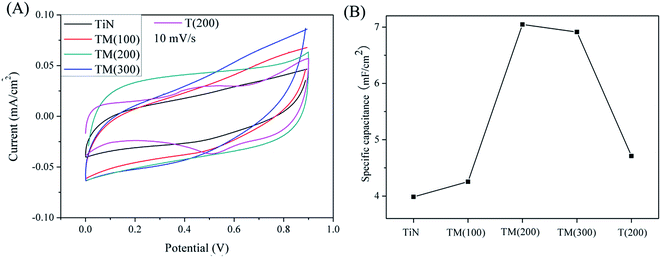 | ||
| Fig. 5 (A) Cyclic voltammetry curves of TiN, T(200), TM(100), TM(200) and TM(300) for 10 mV s−1; (B) unit area capacitance of TiN, T(200), TM(100), TM(200) and TM(300). | ||
Fig. 6 displays representative CV curves and the corresponding specific capacitance of TM(200) electrode at a series of scan rates between 5 and 100 mV s−1. The curves shown in Fig. 6(A) maintain nearly symmetrical rectangular shapes up to 100 mV s−1. Sample TM(200) exhibits a specific capacitance of ∼550 F g−1 and 267 F g−1 at the scan rates of 5 mV s−1 and 100 mV s−1, respectively, indicating that it possesses excellent capacitive performance and high-rate capability.
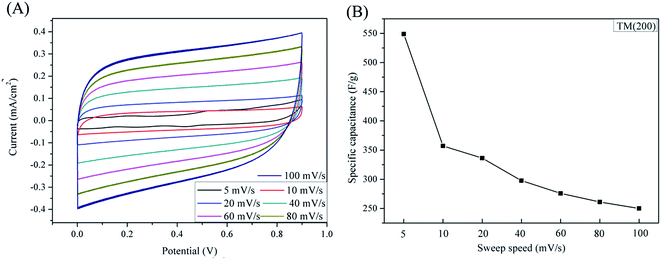 | ||
| Fig. 6 (A) Cyclic voltammetry curves of TM(200) for different scan rate; (B) specific capacitance of TM(200) for different scan rate. | ||
Fig. 7 presents typical galvanostatic charge/discharge curves of the TM(200) electrode at a series of current densities. The symmetrical triangular curves also testify to the superior power capability of the electrode. The specific capacitance reaches 182.86 F g−1 at a current density of 2.5 A g−1 calculated using formula (2). It drops with increasing current density and exhibits a specific capacitance of 110 F g−1 at a current density of 11 A g−1.
 | (2) |
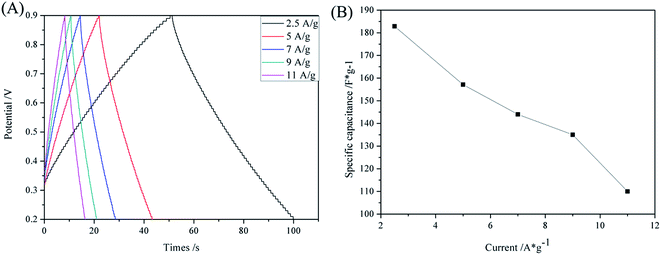 | ||
| Fig. 7 (A) Galvanostatic charging/discharge curves of TM(200) for different constant current; (B) specific capacitance curve of TM(200) for different current density. | ||
Fig. 8(A) shows the plot of cycling stability of sample TM(200) through the galvanostatic charge/discharge at 9 A g−1, the specific capacitance retains 83.77% of the initial value after 600 cycles. Fig. 8(B) shows the Nyquist curve of sample TM(200) and the fitted curve. The internal resistance (R1) of the MnO2 electrode is 1.28 Ω. Furthermore, the equivalent circuit illustrates a low charge transfer resistance (R3) of 32.56 Ω, which can be attributed to the high conductivity of the 3D TiN NTAs structure in MnO2 film.
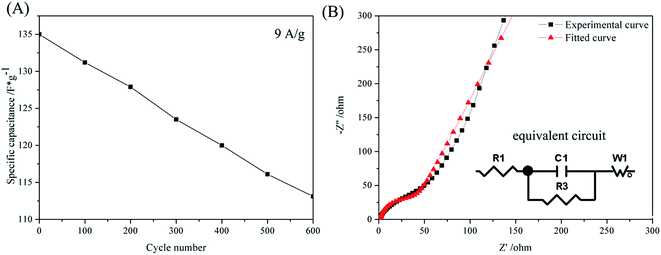 | ||
| Fig. 8 (A) Cycling performance of TM(200) at a current density of 9 A g−1. (B) Nyquist plot and fitted curve of TM(200); the inset shows the equivalent circuit. | ||
4. Conclusions
We have constructed a novel 3D MnO2/TiN NTAs flexible electrode for a supercapacitor by a simple and cost-effective strategy. The 3D structured TiN NTAs shows promising application as a skeleton to support pseudo-capacitive materials due to enhanced ion and electron conductance. In virtue of the structural and electronic merits, the novel MnO2/TiN NTAs supercapacitor exhibits large specific capacitance of ∼550 F g−1 at the scan rate of 5 mV s−1 and 182.86 F g−1 at the high galvanostatic charging/discharge current density of 2.5 A g−1. In addition, it maintains 83.77% of the initial capacitance after 600 cycles at current density of 9 A g−1. The high-performance hybrid structure promises the potential to work with other pseudo-capacitive materials.Conflicts of interest
There are no conflicts to declare.Acknowledgements
This work was financially supported by the Nanotechnology Special foundation of Shanghai (grant number 11 nm0500700).References
- H. F. Ju, W. L. Song and L. Z. Fan, J. Mater. Chem. A, 2014, 2(28), 10895–10903 CAS.
- M. J. Young, A. M. Holder and S. M. George, et al., Chem. Mater., 2015, 27(4), 1172–1180 CrossRef CAS.
- J. W. Long, D. Bélanger and T. Brousse, et al., MRS Bull., 2011, 36(7), 513–522 CrossRef CAS.
- Y. Huang, J. Liang and Y. Chen, Small, 2012, 8(12), 1805 CrossRef CAS PubMed.
- S. Xiao, F. Bi and L. Zhao, et al., J. Mater. Sci., 2017, 52(13), 1–10 CrossRef.
- T. Liu, L. Finn and M. Yu, et al., Nano Lett., 2014, 14(5), 2522 CrossRef CAS PubMed.
- C. Zhao, P. Gai and C. Liu, et al., J. Mater. Chem. A, 2013, 1(40), 12587–12594 CAS.
- G. P. Pandey, A. C. Rastogi and C. R. Westgate, J. Power Sources, 2014, 245(1), 857–865 CrossRef CAS.
- T. Y. Chen, T. J. M. Luo and Y. W. Yang, et al., J. Phys. Chem. C, 2012, 116(32), 16969–16978 CAS.
- S. Santhanagopalan, A. Balram and D. D. Meng, ACS Nano, 2013, 7(3), 2114–2125 CrossRef CAS PubMed.
- S. Nam, J. Jang and H. Cha, et al., J. Mater. Chem., 2012, 22(12), 5543–5549 RSC.
- H. Ming, L. Z. Xiao and L. Fei, et al., J. Power Sources, 2015, 277, 36–43 CrossRef.
- M. Zhang, K. Chen and X. Chen, et al., CrystEngComm, 2015, 17(9), 1917–1922 RSC.
- H. Y. Lee and J. B. Goodenough, J. Solid State Chem., 1999, 144(1), 220–223 CrossRef CAS.
- X. Tao, J. Du and Y. Sun, et al., Adv. Funct. Mater., 2013, 23(37), 4745–4751 CAS.
- Z. Li, Y. Mi and X. Liu, et al., J. Mater. Chem., 2011, 21(38), 14706–14711 RSC.
- X. Y. Liu, H. Chen and G. Li, et al., Ceram. Int., 2016, 42(7), 9227–9233 CrossRef CAS.
- X. Y. Liu, H. Chen and J. H. Peng, et al., Ceram. Int., 2016, 42(9), 11478–11481 CrossRef CAS.
- S. Xiao, F. Bi and L. Zhao, et al., J. Mater. Sci., 2017, 52(13), 1–10 CrossRef.
- J. Kang, A. Hirata and L. Kang, et al., Angew. Chem., Int. Ed., 2013, 52(6), 1664 CrossRef CAS PubMed.
- P. Patsalas and S. Logothetidis, J. Appl. Phys., 2001, 90(9), 4725–4734 CrossRef CAS.
- Y. Qiu, K. Yan and S. Yang, et al., ACS Nano, 2010, 4(11), 6515 CrossRef CAS PubMed.
- G. R. Li, F. Wang and Q. W. Jiang, et al., Angew. Chem., 2010, 49(21), 3653 CrossRef CAS PubMed.
- Q. Y. Wang, X. C. Yang and D. Liu, et al., Electrochim. Acta, 2012, 83, 140 CrossRef CAS.
- Y. Lei, B. Daffos and P. L. Taberna, et al., Electrochim. Acta, 2010, 55(25), 7454–7459 CrossRef CAS.
- J. Ge, H. B. Yao and W. Hu, et al., Nano Energy, 2013, 2(4), 505–513 CrossRef CAS.
- H. Gao, F. Xiao and C. B. Ching, et al., ACS Appl. Mater. Interfaces, 2012, 4(5), 2801–2810 CAS.
- B. Siemensmeyer, K. Bade and J. W. Schultze, Ber. Bunsen-Ges., 1991, 95(11), 1461–1469 CrossRef CAS.
- I. Milošv, H. H. Strehblow and B. Navinšek, et al., Surf. Interface Anal., 1995, 23(7–8), 529–539 CrossRef.
Footnote |
| † Electronic supplementary information (ESI) available. See DOI: 10.1039/c7ra10961j |
| This journal is © The Royal Society of Chemistry 2017 |

