 Open Access Article
Creative Commons Attribution 3.0 Unported Licence
Investigation of the interactions in CeO2–Fe2O3 binary metal oxides supported on ZSM-5 for NO removal by CO in the presence of O2, SO2 and steam
Yuting Bai,
Wenyuan Wu * and
Xue Bian
School of Metallurgy, Northeastern University, Shen Yang, 110819, China. E-mail: wuwy@smm.neu.edu.cn
First published on 15th December 2017
Abstract
ZSM-5 series catalysts with different metal contents were prepared for NO removal by CO in the presence of O2, SO2 and steam via an impregnation method. The flash catalysts and used catalysts were characterized via XRD, BET, XPS, NH3-TPD, CO-TPR and in situ DRIFTS and their activities were tested in a fixed-bed reactor. The 10Ce–10Fe catalyst exhibited stable NO conversion of over 90% within the temperature range from 320 °C to 650 °C, and it has superior resistance to O2, SO2 and steam. The ZSM-5 structure was retained after loading Fe and Ce, and diffraction peaks of Fe2O3 and CeO2 were observed in the XRD spectra with an increase in the metal content. The specific surface area and pore volume of Ce–Fe/ZSM-5 decreased, and its average pore diameter increased. The Ce–Fe/ZSM-5 catalysts possess chemisorbed oxygen and lattice oxygen, and their various cations (Fe3+/Fe2+ and Ce4+/Ce3+) promote the production of oxygen vacancies, which are beneficial for the activation of N–O. The strong acid sites and some medium-strong acid sites are involved in the catalytic reaction as the active sites for Ce–Fe/ZSM-5 in NH3-TPD. The interaction between Fe2O3 and CeO2 (Ce3+ + Fe3+ ↔ Ce4+ + Fe2+) in the Ce–Fe/ZSM-5 catalyst improves its catalytic performance, reducing property, resistance to O2, SO2 and steam, and service life.
1. Introduction
Nitrogen oxides (NOx) are one of the predominant severe pollutants in the atmosphere, which cause acid rain, ozone depletion, photochemical smog, greenhouse effects, etc.1 Currently, selective catalytic reduction (SCR) of NOx with NH3 in 2–6 vol% O2 is an efficient technology for the abatement of NOx from stationary sources, such as power plants.2,3 The narrow temperature window (300–400 °C), high toxicity of vanadium species (V2O5), SO2 oxidation to SO3, and formation of N2O at high temperatures are disadvantages for the widely used commercial catalyst, V2O5–WO3 (MoO3)/TiO2.4,5 Therefore, low-temperature SCR with non-polluting catalysts has attracted increasing attention. Its reactor is generally located downstream of the electrostatic precipitator and desulfurization device to avoid catalyst deactivation caused by the high concentration of ash.6 However, through extensive research on low-temperature SCR catalysts in recent years, it was found that the operating temperature window (150–300 °C) for low-temperature SCR catalysts7,8 is slightly higher than the flue gas temperature (50–100 °C) from the desulfurizer, and ammonium sulfate, which is formed in the presence of a small amount of SO2 (about 50 ppm), results in catalyst deactivation.4 Due to the ability of reducing SO2 and its wide existence in flue gas, CO is a promising reductant for stationary sources, particularly coal-fired power plants with a high CO content in their exhaust gas. CO was used in this study as a reducing agent to remove NO similar to automobile exhaust purification.9,10 Compared with mobile source systems, CO oxidation by O2 and the formation of hypertoxic COS by-products are the difficulties associated with this investigation and application. The main related reactions are represented by eqn (1.1)–(1.5):| 2NO + 2CO → N2 + 2CO2 | (1.1) |
| 2NO + CO → N2O + CO2 | (1.2) |
| 2CO + O2 → 2CO2 | (1.3) |
| 2CO + SO2 → S + 2CO2 | (1.4) |
| CO + SO2 → COS + O2 | (1.5) |
Various catalysts for NO reduction by CO have been investigated, such as CuO–CoO/γ-Al2O3,11 CuO/CeO2–TiO2,12 MnOx–CuO/Ce0.67Zr0.23O2 (ref. 13) and CuO–CeO2,14 but their resistance to O2 and SO2 is rarely considered. Pereira et al.15 researched the stability of CuO/TiO2 and FeO/TiO2 catalysts during NO reduction by CO in the presence of O2 and SO2. The results showed that the presence of O2 leads to the direct oxidation of CO to CO2 according to eqn (1.3), and the conversion of NO decreases drastically when SO2 is added into the feed stream due to the formation of sulfates on the titania surface, which block the active sites. Li et al.16 researched an Fe-based catalyst for the reduction of NO by CO under FCC regeneration conditions, and suggested that Fe-based catalysts enhance the reduction of NO by CO at a lower temperature and the reaction rate decreases with an increase in O2 concentration.
Zeolite ZSM-5, which has a porous structure and rich acid sites, is considered to be a perfect carrier for extensive use in many types of catalytic reactions, such as catalytic cracking and catalytic dehydration.17,18 Cu/ZSM-5 and Fe/ZSM-5 are usually used for NH3-SCR, and it has been shown that the characteristics of Fe/ZSM-5 are conducive to NO reduction. The NOx conversion over Fe–CuOx/ZSM-5 catalyst reached 98% within the temperature range of 180 to 360 °C.19 Li et al.20 indicated that Fe2O3 is a good adsorbent for both NO and NO2, while H-ZSM-5 is not a good adsorbent for either NO or NO2. Fe–ZSM-5 only adsorbs NO2, which strongly demonstrates the existence of interactions between the FexOy clusters and the zeolite support. Nevertheless, the use of zeolite ZSM-5 for NOx removal by CO is unusual. Cheng et al.21 discovered that NOx removal over Fe/ZSM-5 catalysts is very stable at 250–400 °C in a simulated rotary reactor with 5% O2, and a higher CO concentration enhances the reduction efficiencies.
Ce-doped catalysts, including CuO/CeO2–TiO2,22 CeWOx,23 Ce–Cu/ZSM-5 (ref. 24) and Ce–Mn/ZSM-5,25 have been reported recently because Ce can store and release oxygen via the Ce3+/Ce4+ redox cycle. Deng et al.22 showed that the strong synergistic effect between Ti3+, Ce3+ and Cu+ in CuO/CeO2–TiO2 is beneficial to improve activity due to more oxygen vacancies. Lai et al.24 elucidated that the addition of Ce increases the Lewis acid sites on the surface of Cu/ZSM-5 and broadens the operation temperature window. However, studies about Ce and Fe modified ZSM-5 are relatively scarce.
Herein, a series of Fe/ZSM-5 and Ce–Fe/ZSM-5 catalysts with different Fe and Ce contents were prepared via impregnation, and their catalytic activity for NO reduction by CO in the presence of O2 and SO2 was further evaluated. Then, the samples were characterized via XRD, BET, XPS, NH3-TPD, CO-TPR and in situ DRIFTS. The interactions in the CeO2–Fe2O3 binary metal oxides supported on ZSM-5 were thoroughly investigated.
2. Experimental
2.1 Catalyst preparation
ZSM-5 zeolites were synthesized via the seeding method in a hydrothermal system using silica sol, sodium aluminate and sodium hydroxide as the main raw materials. The ZSM-5 seed crystals were obtained from Nankai University, silica sol was procured by Guangzhou Suixin Chemical Industry Co., Ltd, and the other reagents were purchased from Sinopharm Chemical Reagent Co., Ltd, which were of analytical grade (AR). The HZSM-5 support was obtained after ion exchange with ammonium nitrate.The Fe/ZSM-5 samples were prepared by the conventional wet impregnation of HZSM-5 with an aqueous solution containing the required amount of Fe(NO3)3·9H2O. The samples were dried at 110 °C for 10 h and then calcined at 550 °C in air for 4 h. The products were simply denoted as xFe/ZSM-5, where x represents the mass percent of Fe in the catalyst. 0Fe/ZSM-5 was pure HZSM-5. xFe/ZSM-5-A represents the used xFe/ZSM-5 catalyst after catalytic reaction for 24 h. Similarly, the Ce–Fe/ZSM-5 catalyst was prepared by the wet impregnation of HZSM-5 with Fe(NO3)3·9H2O and Ce(NO3)3·6H2O, which was denoted as yCe–xFe/ZSM-5, where x and y represent the mass percent of Fe and Ce in the catalyst, respectively.
2.2 Characterizations
X-ray diffraction (XRD) patterns were recorded on a Dutch X'pert HighScore Plus X-ray diffractometer using Cu Kα radiation in the 2θ range of 5–90° with a step of 2° min−1. The X-ray tube was operated at 40 kV and 40 mA. The quantitative analysis of TFe and FeO was performed via a chemical titration method.Nitrogen adsorption–desorption isotherms were measured at 77 K on a Micrometrics ASAP-2020 adsorption apparatus. Samples were placed under vacuum for 4 h at 400 °C as a pretreatment. Specific surface area was determined using the Brunauer–Emmett–Teller (BET) method. The pore volume and aperture size were calculated using the Barrett–Joyner–Halenda (BJH) formula.
X-ray photoelectron spectroscopy (XPS) was performed on a Thermo Scientific Escalab 250Xi using Al Kα as the radiation source at 150 W. The binding energies (BEs) were referenced to the adventitious C 1s at 284.6 eV. This reference gave BE values with an accuracy of ±0.1 eV.
NH3 temperature-programmed desorption (NH3-TPD) was carried out on a PX200 apparatus by Tianjin Pengxiang Technology Ltd. About 100 mg sample was placed in a quartz reactor and pretreated at 500 °C under a flow of N2 (70 mL min−1) for 1 h. The amount of NH3 desorbed was detected by a thermal conductivity detector (TCD).
Carbon monoxide temperature-programmed reduction (CO-TPR) was performed on a Micromeritics Autochem 2920 equipped with TCD. Initially, 50 mg sample was pretreated under N2 flow at 300 °C for 1 h. After cooling to room temperature, the sample was heated to 800 °C (10 °C min−1) under a CO–N2 mixture (10% CO by volume).
In situ diffuse reflectance infrared Fourier transform spectra (in situ DRIFTS) were collected from 400 to 4000 cm−1 at a spectral resolution of 4 cm−1 (number of scans: 32) on a Nicolet IS50 FT-IR spectrometer equipped with a high-sensitive MCT detector. The sample was placed on a high temperature cell and pretreated with N2 at 300 °C for 1 h. The background of each target temperature was collected during the cooling process; then, the sample was exposed to a controlled stream of CO–Ar (10% vol. CO) or/and NO–Ar (5% vol. NO) at a rate of 10 mL min−1 for 30 min. Desorption/reaction studies were performed by heating the adsorbed species and the spectra were recorded at target temperatures from room temperature to 350 °C at the rate of 10 °C min−1 by subtracting the corresponding background reference.
2.3 Evaluation of catalytic performance
Catalyst activity tests were carried out in a fixed-bed reactor with 5 mL sample (40–60 mesh) between 200 °C and 650 °C. The gas mixture contained 600 ppm NO, 600 ppm CO, and N2 as diluents with a space velocity of 36![[thin space (1/6-em)]](https://www.rsc.org/images/entities/char_2009.gif) 000 h−1. The product was analyzed via gas chromatography (GC9310) with TCD and two columns (Porapak Q and Molecular 13X). The 10Fe/ZSM-5 and 10Ce–10Fe/ZSM-5 catalysts were also evaluated in the reduction of NO with CO at 400 °C in the presence of 1000 ppm O2 60 ppm or 120 ppm SO2, and 3% water steam. The conversion (η) of NO was calculated using eqn (2.1).
000 h−1. The product was analyzed via gas chromatography (GC9310) with TCD and two columns (Porapak Q and Molecular 13X). The 10Fe/ZSM-5 and 10Ce–10Fe/ZSM-5 catalysts were also evaluated in the reduction of NO with CO at 400 °C in the presence of 1000 ppm O2 60 ppm or 120 ppm SO2, and 3% water steam. The conversion (η) of NO was calculated using eqn (2.1).
 | (2.1) |
3. Results and discussion
3.1 Catalytic activity
NO conversion as a function of reaction temperature between 200 °C and 650 °C on the series of ZSM-5 catalysts with different metal contents is shown in Fig. 1(a), the reaction temperature (T10%, T90%, and T100%) and maximal conversion are listed in Table 1. The 0Fe/ZSM-5 catalyst presented almost no activity in the working temperature window. The 2Fe/ZSM-5 catalyst exhibited significant catalytic activity at the T10% of 379 °C and the highest conversion of NO reached 89.24%. The T10% of the 5Fe/ZSM-5 catalyst decreased to 318 °C, and the NO conversion reached 100% at 476 °C. However, with an increase in temperature to 580 °C, the NO conversion declined. The NO conversion curve of 10Fe/ZSM-5 clearly shifted to a low temperature, and T90% decreased to about 80 °C compared with that of 5Fe/ZSM-5. Besides, the NO conversion remained at 100% up until 650 °C, which broadened the operating temperature window. Briefly, with an increase in Fe content in the catalyst, the NO conversion significantly increased and the catalytic reaction temperature gradually decreased. After adding Ce, the NO conversion curve of the 5Ce–10Fe/ZSM-5 catalyst also shifted to low temperature, and T90% dropped by nearly 20 °C to 338 °C. The T90% of the 10Ce–10Fe/ZSM-5 catalyst further deceased to 317 °C, which showed the best performance. However, the 10Ce/ZSM-5 catalyst exhibited poor activity, and 445 °C was too high for T10%, which shows that the catalytic activity of the Fe species is better than Ce. Above all, these results illustrates that Ce has a promoting effect on the catalytic reaction. The N2 selectivity curves (Fig. 1(b)) shifted to a low temperature with an increase in the metal contents, which are similar to the NO conversion curves. The N2 selectivities increased when the reaction temperature increased as a result of the rapid decomposition of absorbed NO on the catalyst surface at high temperature.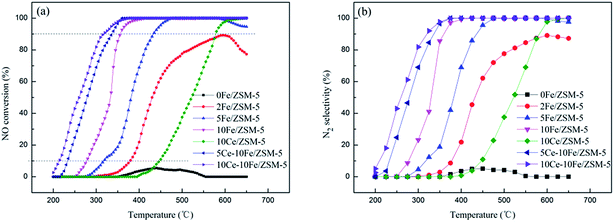 | ||
| Fig. 1 (a) NO conversion and (b) N2 selectivity over the ZSM-5 series catalysts with different metal contents. | ||
| Catalyst | T10% (°C) | T90% (°C) | T100% (°C) | ηMax (%) |
|---|---|---|---|---|
| 0Fe/ZSM-5 | — | — | — | 5.52 |
| 2Fe/ZSM-5 | 379 | — | — | 89.24 |
| 5Fe/ZSM-5 | 318 | 434 | 476 | 100.00 |
| 10Fe/ZSM-5 | 277 | 356 | 411 | 100.00 |
| 10Ce/ZSM-5 | 445 | 578 | 623 | 100.00 |
| 5Ce–10Fe/ZSM-5 | 234 | 338 | 360 | 100.00 |
| 10Ce–10Fe/ZSM-5 | 214 | 317 | 380 | 100.00 |
The performances of resistance to O2, SO2 and steam on the 10Fe/ZSM-5 and 10Ce–10Fe/ZSM-5 catalysts are shown in Fig. 2. The main components of the initial feed stream were 1200 ppm CO and 600 ppm NO. The NO conversion over the 10Fe/ZSM-5 catalyst was 100% at 400 °C. When 60 ppm SO2 was added, the conversion of NO to N2 constantly remained 100%. However, the conversion of CO to CO2 slowly increased due to the redox reaction between CO and SO2 according to eqn (1.4), and returned to the original value when the SO2 feed was interrupted. The NO conversion rapidly reduced to 53.8% and CO conversion clearly increased to 87.5% after 1000 ppm O2 and 60 ppm SO2 were introduced into the stream. There was a competitive relationship between CO + NO and CO + O2, and O2 favored CO oxidation to CO2. When the O2 and SO2 streams were off, the NO conversion recovered to 85.4% but could not reach 100%, indicating that the catalyst was deactivated as a result of some irreversible changes. The NO conversion dropped drastically to 45.8% because the high SO2 concentration of 120 ppm in the flue gas inhibited the catalyst activity. For the 10Ce–10Fe/ZSM-5 catalyst, the resistance curve to O2 and SO2 was similar to that for 10Fe/ZSM-5. However, in the presence of 60 ppm SO2, the CO conversion increased and remained steady. The NO conversion decreased to 67.7% (higher than that for 10Fe/ZSM-5) and the CO conversion increased to 72.5% when 1000 ppm O2 and 60 ppm SO2 were added, and the NO conversion recovered to 100% after the O2 and SO2 streams were turned off. The NO conversion declined to 51.8% in the presence of 120 ppm SO2, which exhibits preferable resistance to a high SO2 concentration. Fig. 2(c) shows that the NO conversions on 10Fe/ZSM-5 and 10Ce–10Fe/ZSM-5 at 400 °C remained almost unchanged (over 95%) in the presence of steam. In contrast, the 10Ce–10Fe/ZSM-5 catalyst exhibited superior resistance to O2, SO2 and steam, and could not be deactivated under the research conditions.
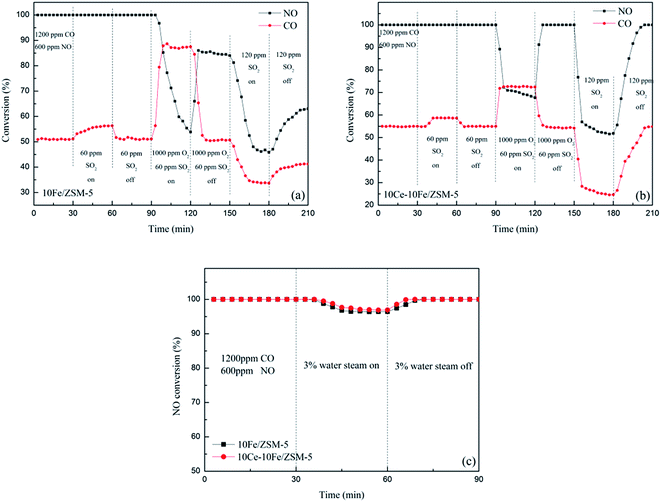 | ||
| Fig. 2 Conversion of NO to N2 and CO to CO2 in the presence of O2 and SO2 on (a) 10Fe/ZSM-5 and (b) 10Ce–10Fe/ZSM-5 and (c) NO conversion in the presence of steam at 400 °C. | ||
3.2 XRD results
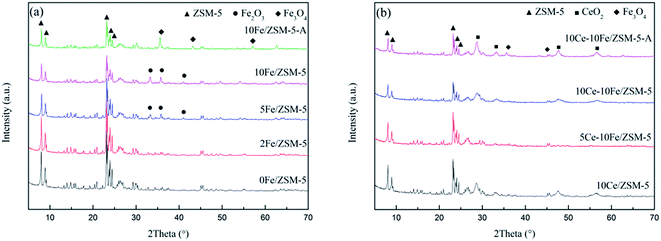
Fig. 3 shows the XRD patterns of the catalysts. All the samples with different contents of active components exhibit the complete typical diffraction peaks of ZSM-5. The used catalysts, 10Fe/ZSM-5-A and 10Ce–10Fe/ZSM-5-A, still retained the structure of ZSM-5. This demonstrates that the frame structure of ZSM-5 as a catalyst carrier did not change during the preparation and reaction process. The quantitative analysis of the different valence states of the FexOy species through the chemical titration method are shown in Table 2. The low Fe2+ content (about 0.09–0.10 wt%) implies that the FexOy species was primarily Fe2O3. As shown in Fig. 3(a), when the Fe content was lower, the diffraction peaks of Fe2O3 were hardly observed in the 2Fe/ZSM-5 catalyst, which implies that Fe2O3 was highly dispersed on the internal and external surfaces of the carrier. The evident characteristic diffraction peaks of Fe2O3 were observed when the Fe content was 5%, and peaks of Fe2O3 gradually strengthened with an increase in Fe content. The literature24 shows that metal oxide is amorphous at a low loading content, and under a high loading content, enriched metal oxide on the surface could be crystalline, which has evident characteristic peaks. In the XRD spectra of the used 10Fe/ZSM-5-A catalyst, the typical Fe2O3 peaks disappeared, but the characteristic diffraction peaks of Fe3O4 appeared, which is in agreement with the increase in Fe2+ content to 2.54 wt% in Table 2. This could be due to the reduction of Fe2O3 to Fe3O4 under the CO atmosphere. It can be seen from Fig. 3(b) that there were no typical diffraction peaks of CeO2 over 5Ce–10Fe/ZSM-5, and the CeO2 peaks appeared when the Ce content reached 10%, which is similar to Fig. 3(a). In addition, the characteristic peaks of Ce2O3 were not detected due to its instability. The Fe2+ content only increased slightly to 0.12 wt% in Table 2, and the Fe3O4 peaks in 10Ce–10Fe/ZSM-5-A catalyst were weaker than that in 10Fe/ZSM-5-A, suggesting that Ce inhibits the reduction of Fe2O3.| Catalysts | TFe (%) | FeO (%) | Fe2+ (%) | Fe3+ (%) |
|---|---|---|---|---|
| 0Fe/ZSM-5 | — | — | — | — |
| 2Fe/ZSM-5 | 1.96 | 0.12 | 0.09 | 1.87 |
| 5Fe/ZSM-5 | 4.71 | 0.13 | 0.10 | 4.61 |
| 10Fe/ZSM-5 | 9.52 | 0.11 | 0.09 | 9.43 |
| 10Fe/ZSM-5-A | 10.6 | 3.26 | 2.54 | 8.06 |
| 10Ce–10Fe/ZSM-5 | 9.45 | 0.12 | 0.09 | 9.36 |
| 10Ce–10Fe/ZSM-5-A | 9.57 | 0.16 | 0.12 | 9.45 |
3.3 Pore analysis
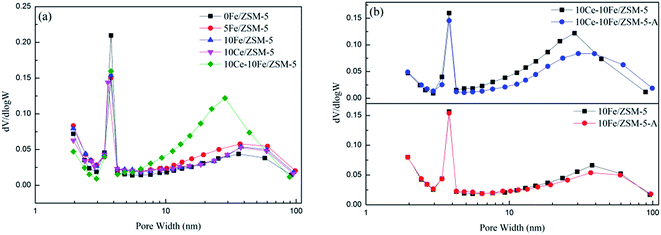
The BJH pore diameter distribution curves of the catalysts are shown in Fig. 4, and the textural properties of the catalysts are listed in Table 3. 0Fe/ZSM-5 possesses mesoporous molecular sieves with a large specific surface area of 341.49 m2 g−1. It can be observed from Fig. 5 that the pores in the ZSM-5 carriers are between 2–4 nm, and the apertures distributed in range of 10–100 nm could be secondary pore structures between carriers or active components loaded on the surface of the carriers. After Fe loading, the number of 2–4 nm mesopores slightly declined, and the secondary pores between 10–100 nm relatively increased. Therefore, the specific surface area and pore volume decreased, and the average pore diameter gradually increased. With an increase in Fe content, there was almost no change in the amount of mesopores and secondary pores in 10Fe/ZSM-5, similar with 10Ce/ZSM-5. For 10Ce–10Fe/ZSM-5, the change in number of mesopores was not evident, but the number of secondary pores remarkably increased, leading to a further reduction in specific surface area and pore volume, and the increase in average pore diameter. Combined with the flash catalyst, the mesopores in the used catalyst slightly decreased, and the change in secondary pores was relatively significant, so the average pore diameter of the used catalyst became smaller.| Catalyst | SBETa (m2 g−1) | VPb (cm3 g−1) | DAc (nm) |
|---|---|---|---|
| a BET surface area.b Total pore volume.c Average pore diameter. | |||
| 0Fe/ZSM-5 | 341.49 | 0.13 | 6.25 |
| 5Fe/ZSM-5 | 321.76 | 0.12 | 7.18 |
| 10Fe/ZSM-5 | 294.01 | 0.11 | 6.95 |
| 10Fe/ZSM-5-A | 281.48 | 0.10 | 6.68 |
| 10Ce/ZSM-5 | 289.65 | 0.11 | 6.83 |
| 10Ce–10Fe/ZSM-5 | 213.97 | 0.08 | 10.05 |
| 10Ce–10Fe/ZSM-5-A | 208.60 | 0.07 | 9.90 |
3.4 XPS results
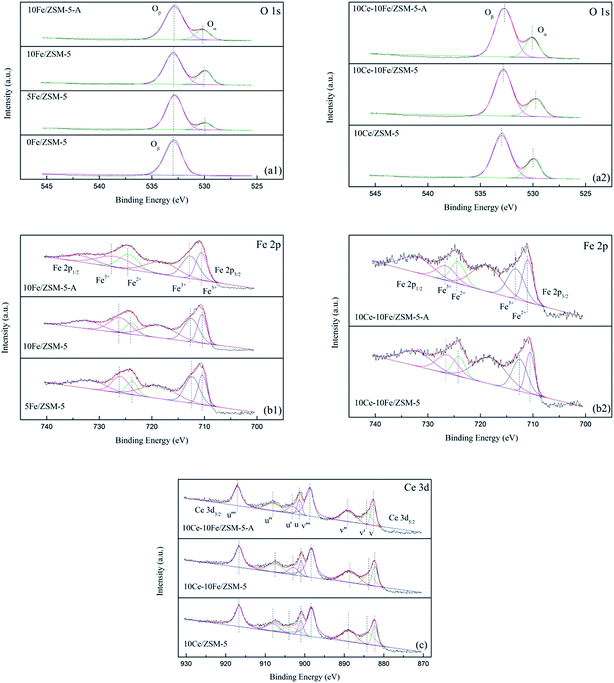
The XPS spectra are shown in Fig. 5, and Table 4 lists the binding energy and calculated relative percentage of ions by XPS. It can be clearly observed that the O 1s peak is asymmetric and could be deconvoluted into two peaks at 533.0 eV and 530.0 eV, which indicate that different types of oxygen species existed on the catalyst surface. The peak (Oβ) at 533.0 eV is attributed to chemisorbed oxygen (O2− and O−) and the peak at the binding energy of 530.0 eV (Oα) is due to lattice oxygen (O2−). Only chemisorbed oxygen existed in the 0Fe/ZSM-5 catalyst and lattice oxygen appeared after the Fe and Ce loading, which confirms that the oxygen vacancy belonged to the Fe(Ce)–O–Fe(Ce) bond in the catalysts. With an increase in Fe content, the proportion of lattice oxygen increased markedly. Together with the catalytic activity analysis, lattice oxygen in catalysts was presumably helpful in improving their catalytic activity. After loading Ce, there was no evident change in the lattice oxygen content. Various cations such as Fe3+, Fe2+, Ce4+ and Ce3+ coexisted in the catalysts; thus, the charge mismatching promoted the formation of oxygen vacancies. The Fe 2p3/2 peak at about 711 eV could be deconvoluted into two peaks at 712.3–713.1 eV and 710.4–711.0 eV, which are related to Fe3+ and Fe2+, respectively. With an increase in Fe content in the catalyst, the amount of Fe3+ slightly reduced and that of Fe2+ relatively increased, promoting a redox reaction between Fe3+ and Fe2+ (Fe2+ + [O] ↔ Fe3+). Similarly, the change in Fe3+ content was not significant after the Ce loading. Ce in the catalyst was primarily in the form of Ce4+. The Ce 3d5/2 peaks were decomposed into four peaks (v‴, v″, v′ and v), where v′ at 883.7–884.2 eV belongs to Ce3+, and the others are attributed to Ce4+. Due to the coexistence of Ce4+ and Ce3+, Ce4+/Ce3+ redox couples exist in the catalysts, which are beneficial for storage and the release oxygen through Ce3+ + [O] ↔ Ce4+. The ratio of Ce4+ in 10Ce–10Fe/ZSM-5 was lower than that in 10Ce/ZSM-5 because the interaction between Ce and Fe enhanced the redox ability of the catalysts. In addition, the Ce4+ content barley changed for 10Ce–10Fe/ZSM-5 after denitration. The Fe3+ content decreased by 6–8% from 0.56 to 0.51 because Fe3+ was reduced to Fe2+ in the reducing atmosphere (CO), which is consistent with the conclusion from XRD. In addition, the lattice oxygen content in 10Fe/ZSM-5-A was 0.18, which decreased by 30% compared to 0.26 for the flash catalyst, which shows that irreversible changes occurred in the physical and chemical properties of the catalyst during the denitration process. However, the lattice oxygen content in 10Ce–10Fe/ZSM-5-A was reduced by only 8% as a result of the interaction between Fe2O3 and CeO2 (Ce3+ + Fe3+ ↔ Ce4+ + Fe2+), which implies that the lattice oxygen was effectively restored and the resistance to O2 and SO2 improved.| Sample | O 1s | Fe 2p3/2 | Ce 3d5/2 | |||||
|---|---|---|---|---|---|---|---|---|
| Oβ (eV) | Oα (eV) | Oα/(Oα + Oβ) | Fe3+ (eV) | Fe2+ (eV) | Fe3+/(Fe2+ + Fe3+) | Ce3+ (eV) | Ce4+/(Ce3+ + Ce4+) | |
| 0Fe/ZSM-5 | 533.0 | — | 0 | — | — | — | — | — |
| 5Fe/ZSM-5 | 532.9 | 530.0 | 0.14 | 712.3 | 710.4 | 0.61 | — | — |
| 10Fe/ZSM-5 | 533.0 | 530.0 | 0.26 | 712.5 | 710.5 | 0.58 | — | — |
| 10Fe/ZSM-5-A | 532.9 | 530.2 | 0.18 | 712.8 | 710.6 | 0.54 | — | — |
| 10Ce/ZSM-5 | 532.9 | 530.0 | 0.25 | — | — | — | 883.9 | 0.88 |
| 10Ce–10Fe/ZSM-5 | 532.8 | 529.8 | 0.25 | 712.5 | 710.6 | 0.56 | 883.7 | 0.85 |
| 10Ce–10Fe/ZSM-5-A | 532.7 | 530.1 | 0.23 | 713.1 | 711.0 | 0.51 | 884.2 | 0.84 |
3.5 Results of NH3-TPD
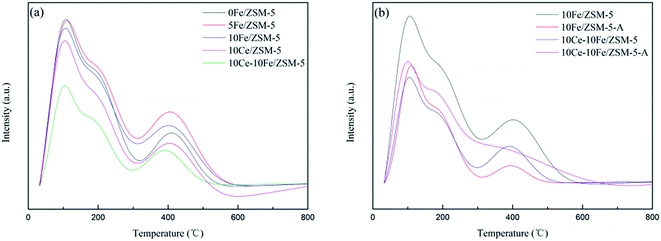
Fig. 6 shows the NH3-TPD profiles of the catalysts, in which all the catalysts display three peaks. The peak centered at about 100 °C belongs to NH3 adsorbed on Lewis acid sites and physically adsorbed on the weak surface acid sites. The peak between 150–300 °C is ascribed to NH3 adsorbed on the Lewis acid sites, which are medium-strong acid sites. The peak between 300–500 °C is attributed to NH3 adsorbed on Bronsted acid sites, which are strong surface acid sites. The peak intensity in the profiles represents the total quantity of acid, which slightly changed after Fe loading. After Ce loading, the acid quantity significantly decreased. The temperature and area percent of desorption peaks are shown in Table 5. The percentage of weak acid on the catalyst reduced after the Fe and Ce loading, and the strong acid sites increased. In addition, the total quantity of acid for the used 10Fe/ZSM-5-A and 10Ce–10Fe/ZSM-5-A catalyst evidently decreased, but the acid quantity of 10Fe/ZSM-5-A was relatively lower than that in the 10Ce–10Fe/ZSM-5-A catalyst, which illustrates that the interaction between Ce and Fe was helpful to remain active. The percentage of strong acid on the 10Fe/ZSM-5-A catalyst sharply decreased compared with that in the flash catalyst. The percentage of strong acid on the 10Ce–10Fe/ZSM-5-A catalyst also declined, but the percentage of medium-strong acid also slightly decreased. It was conjectured that the strong acid sites and some of the medium-strong acid sites were both involved in the catalytic reaction as the active sites for the 10Ce–10Fe/ZSM-5 catalyst. It was also inferred that there was an interaction between Ce and Fe, which is consistent with the XPS analysis.| Catalysts | Peak of weak acid | Peak of medium-strong acid | Peak of strong acid | |||
|---|---|---|---|---|---|---|
| T/°C | Area percent/% | T/°C | Area percent/% | T/°C | Area percent/% | |
| 0Fe/ZSM-5 | 99 | 27.61 | 186 | 52.34 | 410 | 20.05 |
| 5Fe/ZSM-5 | 101 | 23.02 | 189 | 47.29 | 406 | 29.69 |
| 10Fe/ZSM-5 | 97 | 23.35 | 183 | 48.95 | 402 | 27.70 |
| 10Fe/ZSM-5-A | 103 | 35.0 | 179 | 54.62 | 394 | 9.48 |
| 10Ce/ZSM-5 | 98 | 26.14 | 180 | 49.32 | 405 | 24.54 |
| 10Ce–10Fe/ZSM-5 | 98 | 27.07 | 176 | 49.67 | 390 | 23.26 |
| 10Ce–10Fe/ZSM-5-A | 97 | 39.43 | 187 | 44.28 | 384 | 16.29 |
3.6 Reduction behavior of the catalysts (CO-TPR)
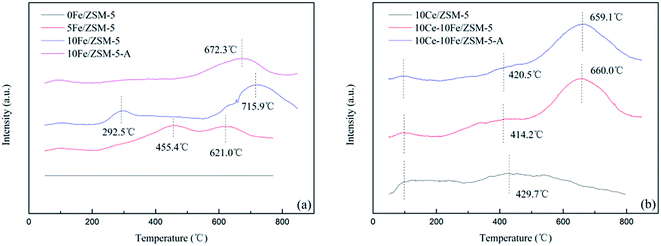
The CO-TPR profiles of the catalysts showed CO consumption in the entire range of temperature used in the analysis. There are three reduction peaks shown in Fig. 7(a). The peak at about 100 °C is related to the reduction of reactive oxygen species (O− or O2−). The second peak between 100–500 °C is ascribed to the reduction of Fe3+ to Fe2+, and the peak above 500 °C is attributed to the reduction from Fe2+ to Fe0. The CO-TPR profile of the 0Fe/ZSM-5 catalyst without any reduction peaks shows that the 0Fe/ZSM-5 catalyst had no reduction activity. When the Fe content increased from 5% to 10%, the reduction temperature range from 455.4–621.0 °C broadened to 292.5–715.9 °C, indicating that the increase in the active components enhanced the reducing ability, and promoted the reduction from Fe3+ to Fe2+ and the formation of oxygen vacancies. This is the reason of decrease in T10% (Fig. 1). For the 10Fe/ZSM-5-A catalyst used in the catalytic reaction at 650 °C, the reduction peak of Fe3+ to Fe2+ almost completely disappeared. The broad peak for 10Ce/ZSM-5 in Fig. 7(b) at 429.7 °C is related to Ce4+ to Ce3+. After the Ce loading, the reduction peaks of Fe3+ to Fe2+ disappeared, indicating that the interaction of Ce and Fe was helpful to restrain the Fe3+ reduction, which is consistent with the results of XPS analysis. The peak for Ce4+ to Ce3+ conversion in 10Ce–10Fe/ZSM-5 shifted to a low temperature as a result of this interaction (Ce3+ + Fe3+ ↔ Ce4+ + Fe2+). 10Ce–10Fe/ZSM-5-A retained the peaks of the flash catalyst, which suggests that the service life of the catalyst could be improved.3.7 CO or/and NO interaction with the 10Ce–10Fe/ZSM-5 catalyst
The in situ DRIFTS results of CO adsorption on the 10Ce–10Fe/ZSM-5 catalyst are shown in Fig. 8(a). The peak at 1636 cm−1 is attributed to bidentate bicarbonate, two peaks at 1551 cm−1 and 1473 cm−1 belong to the surface carbonate species, and the peak at 1366 cm−1 is assigned to bidentate formate.22 Their intensities all decreased with an increase in temperature and disappeared completely at 250 °C due to decomposition. Similarly, the peaks 2175 cm−1 and 2117 cm−1 attributed to M–CO became weaker with the increase in temperature, which disappeared at 300 °C due to desorption. The intensity of the peaks attributed to gaseous CO2 centered at 2360 cm−1 and 2341 cm−1 increased as the temperature increased. This indicates that Ce4+ or/and Fe3+ in a high state were reduced to Ce3+ or/and Fe2+ under the CO atmosphere, and the released oxygen vacancies oxidized CO to CO2.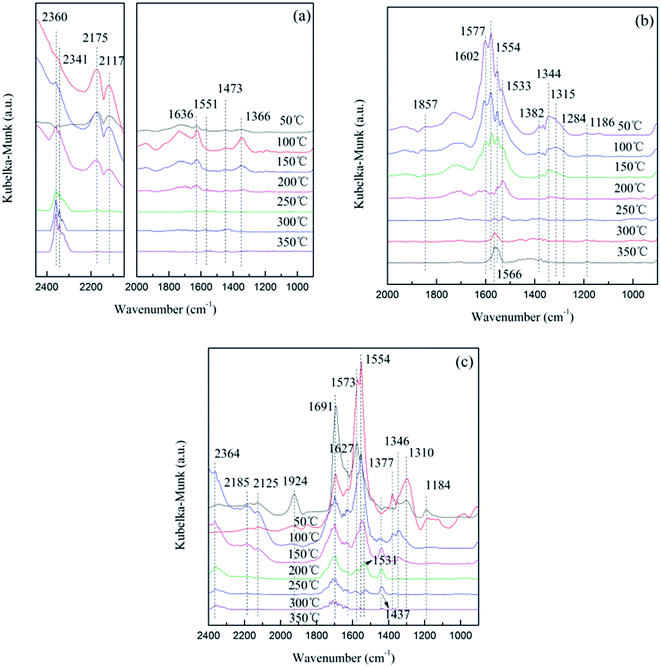 | ||
| Fig. 8 In situ DRIFTS results of (a) CO adsorption, (b) NO adsorption, and (c) CO + NO adsorption on the 10Ce–10Fe/ZSM-5 catalyst from 50–350 °C. | ||
There were a variety of different NO adsorption species at low temperature (Fig. 8(b)). The peak at 1857 cm−1 is attributed to M–NO, which disappeared when the temperature reached 150 °C. The peaks for the bridging bidentate nitrates (1602 cm−1), chelated nitrates (1577 cm−1), hyponitrites (1344 cm−1), linear nitrites (1315 cm−1) and chelated nitrites (1284 cm−1) all reduced greatly with the increase in temperature and disappeared completely at 200 °C. The similar peaks of the bridging monodentate nitrates (1533 cm−1 and 1186 cm−1) disappeared completely at 300 °C.10 The peaks for the bridged nitro at 1544 cm−1 and nitrate at 1382 cm−1 could be produced in the decomposition process,19 and their disappearance at high temperature also confirms this assumption. Furthermore, at 250 °C, a new peak appeared at 1566 cm−1, which is assigned to chelated nitrates, and its intensity strengthened with the increase in temperature. From the shift in this peak, it was surmised that the NO species adsorbed on the catalyst surface were not only attributed to simple adsorption and decomposition, but the species could have been further restructured.
In situ DRIFTS was performed under simulative reaction conditions, which provides information about the changes in the surface absorbed species in order to investigate the interaction of the reactant gas with the catalyst as shown in Fig. 8(c). At low temperature, the peaks attributed to CO adsorption species were not significant, and the major adsorption states were NO adsorption species. The differences between the spectra in Fig. 8(b) were that: (1) the peak for chelated nitrites was not observed; (2) the peak for the bridging bidentate nitrates (1691 cm−1) increased at 100 °C, and did not disappear; (3) the peak intensities of the chelated nitrates (1573 cm−1) and linear nitrites (1310 cm−1) increased at 100 °C then greatly decreased. When the temperature reached 150 °C, peaks for CO absorption species appeared gradually, such as gaseous CO2 (2360 cm−1), M-CO (2185 cm−1 and 2125 cm−1), bidentate bicarbonate (1627 cm−1) and carbonate species (1437 cm−1 and 1531 cm−1). These peaks first strengthened and then weakened as the temperature increased.
The following conclusions can be deduced through comprehensive analysis: (1) NO was preferentially adsorbed on the catalyst surface due to unpaired electrons, NO(g) → NO(ads); (2) the NO absorption species gradually decomposed with an increase in temperature, and CO adsorbed on the released active sites, CO(g) → CO(ads); and (3) Ce4+ or/and Fe3+ in a high state were reduced to Ce3+ or/and Fe2+ by CO, and the released oxygen vacancies were advantageous for the activation of N–O and promoted the decomposition of NO, NO(ads) → N(ads) + O(ads). Then, the adsorption species on the catalyst surface were restructured, CO(ads) + O(ads) → CO2(ads), NO(ads) + N(ads) → N2O(ads), N(ads) + N(ads) → N2(ads) and O(ads) + O(ads) → O2(ads). Finally, the products (CO2, N2O, N2 and O2) were obtained after desorption, CO2(ads) → CO2(g), N2O(ads) → N2O(g), N2(ads) → N2(g), O2(ads) → O2(g).
4. Conclusions
The Ce–Fe/ZSM-5 catalysts prepared via an impregnation method showed better catalytic performances than Fe/ZSM-5 for NO removal by CO in the presence of O2, SO2 and steam. The 10Ce–10Fe/ZSM-5 catalyst exhibited stable NO conversion of over 90% within the temperature range from 320 °C to 650 °C, and it had superior resistance to O2, SO2 and steam. As the contents of Fe and Ce increased, the ZSM-5 structure was still retained, diffraction peaks of Fe2O3 and CeO2 were observed via XRD, the specific surface area and pore volume decreased, and the average pore diameter increased. From the XPS results, the Ce–Fe/ZSM-5 catalysts possessed chemisorbed oxygen and lattice oxygen, and various cations (Fe3+/Fe2+ and Ce4+/Ce3+) promoted the production of oxygen vacancies, which were advantageous for the activation of N–O and in agreement with the CO-TPR results. Not only strong acid sites, but also some medium-strong acid sites were involved in the catalytic reaction as the active sites for the 10Ce–10Fe/ZSM-5 catalyst in NH3-TPD. The interaction between Fe2O3 and CeO2 (Ce3+ + Fe3+ ↔ Ce4+ + Fe2+) in the 10Ce–10Fe/ZSM-5 catalyst, which was confirmed by XPS, NH3-TPD and CO-TPR, improved the catalytic performance, reducing property, resistance to O2, SO2 and steam, and the service life of the catalyst.Conflicts of interest
There are no conflicts to declare.Acknowledgements
Financial support of this work was provided by the National Natural Science Foundation of China (No. 51274060).References
- C. Xu, J. Liu, Z. Zhao, F. Yu, K. Cheng, Y. Wei, A. Duan and G. Jiang, J. Environ. Sci., 2015, 31, 74 CrossRef PubMed.
- K. Zhao, W. Han, G. Lu, J. Lu, Z. Tang and X. Zhen, Appl. Surf. Sci., 2016, 379, 316 CrossRef CAS.
- M. Shen, C. Li, J. Wang, L. Xu, W. Wang and J. Wang, RSC Adv., 2015, 5, 35155 RSC.
- B. Dou, G. Lv, C. Wang, Q. Hao and K. Hui, Chem. Eng. J., 2015, 270, 549 CrossRef CAS.
- W. Shan, F. Liu, H. He, X. Shi and C. Zhang, Appl. Catal., B, 2012, 115–116, 100 CrossRef CAS.
- R. Zhang, Q. Zhong, W. Zhao, L. Yu and H. Qu, Appl. Surf. Sci., 2014, 289, 237 CrossRef CAS.
- J. Wang, Z. Yan, L. Liu, Y. Zhang, Z. Zhang and X. Wang, Appl. Surf. Sci., 2014, 309, 1 CrossRef CAS.
- X. Lou, P. Liu, J. Li, Z. Li and K. He, Appl. Surf. Sci., 2014, 307, 382 CrossRef CAS.
- X. Yao, F. Gao, Y. Cao, C. Tang, Y. Deng, L. Dong and Y. Chen, Phys. Chem. Chem. Phys., 2013, 15, 14945 RSC.
- X. Yao, Y. Xiong, J. Sun, F. Gao, Y. Deng, C. Tang and L. Dong, J. Rare Earths, 2014, 32, 131 CrossRef CAS.
- Y. Lv, L. Liu, H. Zhang, X. Yao, F. Gao, K. Yao and L. Dong, J. Colloid Interface Sci., 2013, 390, 158 CrossRef CAS PubMed.
- N. Liu, X. Chen, J. Zhang and J. Schwank, Catal. Today, 2015, 258, 139 CrossRef CAS.
- L. Liu, Q. Yu, J. Zhu, H. Wan, K. Sun, B. Liu, H. Zhu, F. Gao, L. Dong and Y. Chen, J. Colloid Interface Sci., 2010, 349, 246 CrossRef CAS PubMed.
- X. Yao, F. Gao, Q. Yu, L. Qi, C. Tang, L. Dong and Y. Chen, Catal. Sci. Technol., 2013, 3, 1355 CAS.
- C. A. Sierra-Pereira and E. A. Urquieta-González, Fuel, 2014, 118, 137 CrossRef CAS.
- J. Li, S. Wang, L. Zhou, G. Luo and F. We, Chem. Eng. J., 2014, 255, 126 CrossRef CAS.
- S. M. Alipour, Chin. J. Catal., 2016, 37, 671 CrossRef.
- M. Moreno-Recio, J. Santamaría-González and P. Maireles-Torres, Chem. Eng. J., 2016, 303, 22 CrossRef CAS.
- L. Zhu, L. Zhang, H. Qu and Q. Zhong, J. Mol. Catal. A: Chem., 2015, 409, 207 CrossRef CAS.
- B. Li, Z. Huang, X. Huang, S. Kou, F. Liu, X. Zhang and H. Yang, RSC Adv., 2016, 6, 6300 RSC.
- X. Cheng, X. Zhang, M. Zhang, P. Sun, Z. Wang and C. Ma, Chem. Eng. J., 2017, 307, 24 CrossRef CAS.
- C. Deng, B. Li, L. Dong, F. Zhang, M. Fn, G. Jin, J. Gao, L. Gao, F. Zhang and X. Zhou, Phys. Chem. Chem. Phys., 2015, 17, 16092 RSC.
- K. Liu, F. Liu, L. Xie, W. Shan and H. He, Catal. Sci. Technol., 2015, 5, 2290 CAS.
- S. Lai, D. Meng, W. Zhan, Y. Guo, Y. Guo, Z. Zhang and G. Lu, RSC Adv., 2015, 5, 90235 RSC.
- G. Carja, Y. Kameshima, K. Okada and C. D. Madhusoodana, Appl. Catal., B, 2007, 73, 60 CrossRef CAS.
| This journal is © The Royal Society of Chemistry 2017 |

