 Open Access Article
Creative Commons Attribution 3.0 Unported Licence
Activated biochar derived from pomelo peel as a high-capacity sorbent for removal of carbamazepine from aqueous solution†
Dezhi Chen *a,
Shasha Xiea,
Caiqin Chena,
Hongying Quanb,
Li Huaa,
Xubiao Luo
 *a and
Lin Guoac
aKey Laboratory of Jiangxi Province for Persistent Pollutants Control and Resources Recycle, School of Environmental and Chemical Engineering, Nanchang Hangkong University, No. 696, Fenghe South Avenue, Nanchang, 330063, China. E-mail: chendz@nchu.edu.cn; luoxubiao@nchu.edu.cn
bSchool of Materials Science and Engineering, Nanchang Hangkong University, No. 696, Fenghe South Avenue, Nanchang 330063, China
cKey Laboratory of Bio-Inspired Smart Interfacial Science and Technology of Ministry of Education, School of Chemistry and Environment, Beihang University, No. 37 Xueyuan Road, Haidian District, Beijing 100191, China
First published on 1st December 2017
Abstract
In recent years, the application of biochar to remove contaminants from aqueous solutions has become interesting due to favorable physical/chemical properties and abundant feedstocks. Herein, activated biochar was prepared by carbonization and further KOH activation using pomelo peel as a precursor. A series of characterization methods indicated that activation temperature can significantly influence the pore structure and surface chemistry of the obtained activated biochar. When used as a sorbent, the results showed that the adsorption isotherms of carbamazepine (CBZ) onto these activated biochars could be described well by Langmuir models. In addition, the kinetics of CBZ adsorption onto activated biochars were fitted well by pseudo-second-order kinetics and controlled by the intra-particle diffusion. The pore structure and surface functional groups could affect the adsorption of CBZ, resulting in the activated biochar of AB-700 delivering a higher adsorption capacity of CBZ up to 286.5 mg g−1. Furthermore, different factors in the sorption process of CBZ on AB-700, such as temperature, pH, ionic strength and reusability, were studied in detail. The effects of solution temperature revealed that the adsorption processes were spontaneous and exothermic, and mainly physisorption. The presence of Na+ ions in solution showed almost no effect on the adsorption of CBZ. The reuse studies demonstrated that AB-700 showed 58.5% capacity retention at the 4th cycle for the adsorption of CBZ. The effect of solution pH and surface analysis of biochar indicated that the adsorption of CBZ onto the activated biochar was mainly controlled by π–π electron donor–acceptor interaction.
1. Introduction
Pharmaceuticals are widely used in the treatment and prevention of human and animal diseases.1 The annual consumption of pharmaceuticals per capita is estimated to be about 15 g in the world, and is 50–150 g in industrialized countries.2 The occurrence of these compounds in the aquatic environment has received growing attention in recent years due to their possible threats to human and animal health.3 Carbamazepine (CBZ) is a typical antiepileptic drug, and is widely used to treat epileptic seizures and nerve pain around the world with more than 1000 tons of annual consumption.2 It is estimated that the release rate of CBZ into water bodies is around 30 tons per year. Previous research4 has revealed that CBZ may result in a decrease in the number of platelets, granulocytes, and leukocytes. Moreover, long term intake of CBZ could cause liver and kidney failure. CBZ is electrically neutral at typical pH values of drinking water and its log![[thin space (1/6-em)]](https://www.rsc.org/images/entities/char_2009.gif) Kow = 2.45 shows that CBZ is relatively hydrophilic5 and does not easily attach to sludge and can stably remain in the aqueous phase.2 Furthermore, CBZ is resistant to biodegradation at low concentrations,2 and is very slowly degraded by sunlight.6 As a result, CBZ is one of the most commonly detected pharmaceuticals in the aquatic environment throughout the world, even in the raw water sources of drinking water treatment plants.7,8 However, the removal efficiency of CBZ from water in wastewaters treatment plants is lower than 10%.2 Therefore, it is necessary to develop new physical/chemical techniques for effective removal of CBZ from the water. Recently, adsorption process9–11 and advanced oxidation technology12,13 have been evaluated for the treatment of CBZ-containing water because of its hydrophilicity and susceptibility to oxidative processes, respectively. Compared with the advanced oxidation methods with incomplete mineralization and sometimes the harmful transformation products,14 the adsorption process is more attractive due to its easy handling process, high efficiency, and environmental friendliness.11,15,16 In addition, adsorption can be used to study the accumulation of organic micropollutants in the solid liquid interface.
Kow = 2.45 shows that CBZ is relatively hydrophilic5 and does not easily attach to sludge and can stably remain in the aqueous phase.2 Furthermore, CBZ is resistant to biodegradation at low concentrations,2 and is very slowly degraded by sunlight.6 As a result, CBZ is one of the most commonly detected pharmaceuticals in the aquatic environment throughout the world, even in the raw water sources of drinking water treatment plants.7,8 However, the removal efficiency of CBZ from water in wastewaters treatment plants is lower than 10%.2 Therefore, it is necessary to develop new physical/chemical techniques for effective removal of CBZ from the water. Recently, adsorption process9–11 and advanced oxidation technology12,13 have been evaluated for the treatment of CBZ-containing water because of its hydrophilicity and susceptibility to oxidative processes, respectively. Compared with the advanced oxidation methods with incomplete mineralization and sometimes the harmful transformation products,14 the adsorption process is more attractive due to its easy handling process, high efficiency, and environmental friendliness.11,15,16 In addition, adsorption can be used to study the accumulation of organic micropollutants in the solid liquid interface.
Various adsorbents, such as carbonaceous nanomaterials,11,15,17 smectite clays,18 and imprinted polymers19 have been studied for the adsorption removal of CBZ from water. Due to their high specific surface area and high chemical/thermal stability, carbon nanomaterials as sorbents have shown high capacity and affinity for CBZ in aqueous solution.10,11,15,17,20 For example, carbon nanotubes have high adsorption capacity of CBZ up to 7910 mg g−1 (calculated from Polanyi–Mane model) due to their graphene surface and high specific surface area and micro/mesopore volume.16 Graphene oxide exhibited high adsorption capacity of 215 mg g−1 for removal of CBZ from aqueous solution.15 However, it is difficult to use these emerging carbon nanomaterials for removal of pharmaceuticals from water on a large scale because of their high price.
Recently, biochar, derived from waste biomass, has attracted great attention for purification of water sources due to their high porosity and capability of adsorbing different inorganic and organic pollutants.11,21,22 Jin et al. reported23 that biochar derived from municipal solid wastes showed the adsorption capacity of 24.49 mg g−1 for As(V) from aqueous solution. Pine cone derived biochar by slow pyrolysis was used to removal of organic and inorganic pollutants from aqueous solution, and the Langmuir maximum adsorption capability was found to be 106.4 and 117.7 mg g−1 for methylene blue and nickel ions, respectively.24 The adsorption of pharmaceuticals in reclaimed water desalination concentrate using biochar was studied by Xu's group,25 and the results showed that the adsorption capacity of pharmaceuticals was affected by their physicochemical properties of biochar, as well as hydrophobicity, π-energy, and speciation of pharmaceuticals. To further enhance the adsorption performance of biochar for removal of contaminants in water, some effective approaches, including nanonization, surface modification, and activation of biochar, are attracting great interest.11,21,22 To prepare biochar nanoparticles can effectively increase available sites for adsorption, which significantly increase the adsorption capacity and accelerate adsorption kinetics.11 However, the nanoparticles are much difficult to recover from the water. The purpose of surface modification is, on the one hand, to enhance the adsorption capacity of sorbents,22 on the other hand, to provide the selectivity to the sorbents.26 Amino modification of biochar showed high adsorption capacity of copper ions from synthetic wastewater, which was five-folds of the pristine biochar.22 Chitosan-pyromellitic dianhydride modified biochar had strong selective adsorption of Cu(II).26 However, the surface modification of biochar generally needs cumbersome steps, which inhibits its practical application in treatment of wastewater. Therefore, the activation is a more suitable and efficient method to improve the adsorption performance of biochar in comparison of the nanonization and surface modification. The activation could significantly increase the specific surface area and pore volume of biochar, which would obviously increase the available adsorption sites and promote the diffusion rate of contaminants.21 Therefore, in this study, activated biochar was prepared using waste pomelo peel as precursor by a simple pyrolysis method and further KOH activation. The morphology, structure, and surface chemistry of the pomelo peel-derived activated biochar were characterized, respectively. The adsorption behavior of pharmaceutical CBZ on the produced biochar from aqueous phase was investigated by the analysis of adsorption isotherms, kinetics and thermodynamics. In addition, the effect of solution pH, ion strength on the adsorption capacity was studied. Finally, the adsorption mechanism of CBZ on the obtained biochar was discussed.
2. Materials and methods
2.1 Materials
Waste pomelo peel was obtained from the local fruit shop. Anhydrous ethanol, potassium hydroxide and concentrated hydrochloric acid (37%) were purchased from Xilong Scientific Co., Ltd (China). CBZ was purchased from Aladdin (Shanghai, China), and its physicochemical properties are listed in Table 1. All chemicals were A.R. grade and used without further purification.2.2 Synthesis of biochar and activated biochar
In a typical process, biochar was prepared by carbonization of pomelo peel at 400 °C for 1 h with a heating rate of 5 °C min−1 under N2 flow of 100 cm3 min−1. After then, the pomelo peel-derived biochar was mixed with the same amount of KOH in aqueous solution. After drying at 80 °C for 24 h, the obtained solid samples were placed in a nickel crucible and further activated at pre-set temperature (600, 700, 800, 900 °C) for 2 h with a heating rate of 5 °C min−1 under the protection of N2 atmosphere. Finally, the as-obtained biochar (B-400) and activated biochar samples (AB-600, AB-700, AB-800 and AB-900) were washed with 1 M HCl to remove any inorganic impurities, and then washed thoroughly with distilled water until pH ≈ 7 and dried at 80 °C for 24 h.2.3 Characterization
Phase and morphology of the as-prepared biochar were analyzed by Bruker X-ray diffraction (XRD, D8 Advanced) at a scan rate of 4° min−1, FEI scanning electron microscope (SEM, Quanta 450) at 10 kV, and FEI transmission electron microscope (Talos F200X) at 100 kV. The specific surface areas and pore size distributions were studied by nitrogen adsorption–desorption isotherms, which were obtained on a TriStar II 3020 surface area & pore size analyzer (Micromeritics). The surface zeta potential of biochar was measured by Malvern Nano-ZS90 Zetaszier. The surface chemistry of biochar was studied by X-ray photoelectron spectra (XPS) on an Axis Ultra (Kratos) XPS spectrometer. Thermogravimetric (TG) curve was obtained on a TG analyzer (Q600, TA Instruments) under nitrogen (100 cm3 min−1) with the temperature rate of 5 °C min−1.2.4 Adsorption isotherm
Sorption isotherms were obtained as followed. 10 mg of sorbent was added into the conical flasks with 50 mL CBZ aqueous solution with the concentration (C0) from (10 to 100 mg L−1), then these flasks were put into an orbital shaker at 180 rpm under pre-set temperature for 24 h. The effect of pH on CBZ adsorption was studied by varying the pH of CBZ solution (100 mg L−1) in the range of 2.0 to 12.0 using HCl (0.1 mol L−1) and NaOH (0.1 mol L−1) solutions. After reached adsorption equilibration, the sorbent was removed using 0.22 μm membrane filters, and then the residual CBZ in solution was examined by UV spectrophotometer (Hitachi U-3010/3310) at 285 nm.The quantity of organic contaminants absorbed on per unit mass of sorbent was calculated by the following equation:
 | (1) |
The maximum adsorbed amount, Qm (mg g−1), the amount adsorbed at the equilibrium, Qe (mg g−1), and the adsorbed amount of CBZ at time t onto APPC, Qt (mg g−1), were calculated by the equation, where C0, Ce and Ct (mg L−1) are the initial concentrations of CBZ at the equilibrium and at the time t respectively. V is the volume of the solution, and m is the weight of sorbent.
2.5 Adsorption kinetic
The adsorption kinetics of CBZ on biochar were revealed as followed. 200 mg of biochar was added into a 1000 mL CBZ solution (100 mg L−1) with constant magnetic stirring at 25 °C. Then, 1.5 mL of the solution sample was collected at a predetermined time interval and immediately filtered to remove the sorbent with a 0.22 μm membrane filters. The concentrations of CBZ in aqueous solution were analyzed by UV spectrophotometer at 285 nm, respectively.2.6 Effect of ion strength
10 mg of sorbent of AB-700 was added into the conical flasks with 50 mL 100 mg L CBZ solution containing Na+ ions with the concentration from 0.005 to 0.02 M, which placed into the temperature-controlled shaker at 25 °C shaken at 180 rpm for 48 h. After reached adsorption equilibration, the sorbent was removed using 0.22 μm membrane filters, and then the residual CBZ in solution was examined by UV spectrophotometer (Hitachi U-3010/3310) at 285 nm.2.7 Reuse of sorbent
200 mg adsorbent of AB-700 was added into the beaker containing 1 L CBZ solution (100 mg L−1) under constant magnetic stirring at 25 °C for 24 h. After the adsorption equilibrium, the adsorbent was removed by a 0.22 μm filters, and the concentrations of residual CBZ in the solution were analyzed by UV spectrophotometer at 285 nm, then, the recycled black powder was calcined at 350 °C under nitrogen, the TG curve (Fig. S1†) shows that CBZ is almost completely decomposed when the temperature reaches about 330 °C. This whole process was repeated for three times.3. Results and discussion
3.1 Characterization
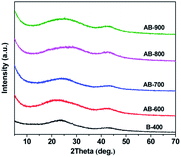
Fig. S2† shows typical SEM images of B-400 and AB-800 biochar from pomelo peel. As we can see, it is almost no difference in the morphology for the pristine biochar and activated biochar. Both are micro-sized particles. Fig. 1 shows the XRD patterns of pristine and activated biochar from pomelo peel. Pristine biochar and activated biochar have two bread-like peaks at about 2θ = 24 and 42°, which indicates the characteristic of amorphous.27 The diffraction intensity of activated biochar in the low angle region is relatively large, indicating that they possess abundant micropores.28The nitrogen adsorption–desorption isotherms and the pore-size distribution of as-prepared biochar samples are presented in Fig. 2a and b, respectively. The isotherm of B-400 is typical type IV with H4 hysteresis loops, which indicates mesoporous structure. It mainly comes from the removal of inorganic impurities, such as SiO2. For the AB-600, AB-700, AB-800 and AB-900, the nitrogen gas adsorption increased quickly at low pressure area (P/P0 < 0.05) and then reached to adsorption plateaus, indicating the existence of main microporous. The increasing hysteresis loops in AB-700, AB-800 and AB-900 at the medium pressure phase indicate that the mesopores were produced and grown in number with the increasing activation temperature. The specific surface areas and pore volumes of pristine biochar and activated biochar, calculated from the corresponding nitrogen adsorption–desorption isotherms using the Brunauer–Emmet–Teller (BET) model and density functional theory (DFT), respectively, are shown in Table 2.
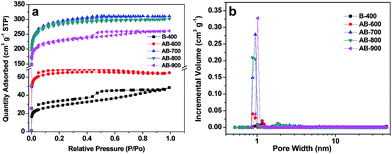 | ||
| Fig. 2 (a) N2 adsorption–desorption isotherms and (b) pore-size distribution of as-prepared biochar samples. | ||
| Sample | SBET (m2 g−1) | Pore diameter (nm) | Pore volume (cm3 g−1) | ||
|---|---|---|---|---|---|
| Micro | Meso | Total | Micro | ||
| B-400 | 94.1 | 1.17 | 3.42 | 0.071 | 0.035 |
| AB-600 | 198.0 | 0.87 | 0.104 | 0.103 | |
| AB-700 | 904.1 | 0.95 | 2.34 | 0.506 | 0.464 |
| AB-800 | 874.4 | 0.95 | 6.10 | 0.487 | 0.460 |
| AB-900 | 702.2 | 1.02 | 3.42 | 0.397 | 0.370 |
Under the protection of inert gas, there will be chemical reaction between KOH and biochar at low temperature of 400–600 °C,
| 4KOH + (–CH2) → K2CO3 + K2O + 3H2 |
In the above process, the micropores will appear. With the increasing of temperature, KOH is completely consumed and the resulting K2CO3 and K2O can further activate the carbon material by the following reaction:
| K2CO3 + 2C → 2K + 3CO |
| K2O + C → 2K + CO |
At high temperature, the K2CO3 and K2O were reduced to elemental potassium by carbon. Meanwhile, the consumption of carbon can improve pore structure of our biochar. If the activation temperature is higher than the boiling point of potassium, there will create new pores. In the activation of our biochar, the specific surface area (SBET = 904.1 m2 g−1) and pore volume (0.506 cm3 g−1) of AB-700 is highest in all activated biochar samples, which indicates that the 700 °C is suitable for the activation of pomelo peel-derived biochar. When the activation temperature increased to 800 °C, the specific surface area and pore volume slightly decreased to 874.4 m2 g−1 and 0.487 cm3 g−1, respectively. When the temperature was increased to 900 °C, the activation of biochar would carry out more thoroughly. The pore-size of AB-900 was increased and more mesopore was produced, which caused the decrease of specific surface area and pore volume to 702.2 m2 g−1 and 0.397 cm3 g−1, respectively.
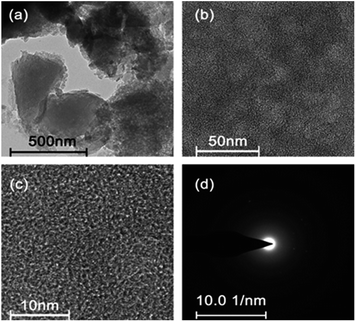
To further observe the microstructure, the typical TEM and high-resolution (HR) TEM images of as-prepared AB-700 are presented in Fig. 3. From the TEM image shown in Fig. 3a, carbon submicron particles can be clearly observed. As shown in Fig. 3b, we can see the disordered texture of the obtained carbon material. No evident lattice fringe can be found in the HRTEM (Fig. 3c). The selected-area electron diffraction (SAED) pattern in Fig. 3d suggests the amorphous feature of our as prepared carbon material. Meanwhile, the typical TEM images of AB-600 are shown in Fig. S3† for comparison. It can be seen from the Fig. 3 and S3† that the difference of microstructure between AB-700 and AB-600 is not obvious, even though the significant difference of specific area and pore volume from N2 adsorption–desorption isotherms presented in Fig. 2.
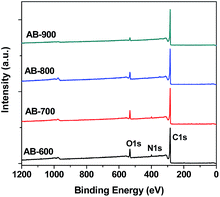
The surface chemistry of activated biochar was important for their adsorption performance. The XPS spectra of AB-600, AB-700, AB-800 and AB-900 are shown in Fig. 4. We can see that there have carbon, oxygen, and nitrogen on the surface of activated biochar, and the atomic concentrates are listed in Table S1.† It indicates that the concentrates of oxygen and nitrogen in the surface of activated biochar decrease with the increase of activation temperature.
3.2 Adsorption isotherms
The adsorption isotherm describes the relationship between the residual concentration of the adsorbate in the liquid phase and the adsorption concentration on the surface of the adsorbent at a certain temperature. The adsorption isotherm is important for determining the adsorption behavior of an adsorbent. Fig. 5a shows the adsorption isotherms of CBZ onto produced biochar at 298 K and pH = 4.4. For the sorbents of B-400 and AB-600, with the increase of CBZ initial concentration, the adsorption capacities increased gradually, and then the increasing trend was gradually slow, and the adsorption was stable, indicating adsorption saturation finally. In comparison of B-400 and AB-600, the adsorption capacities of CBZ onto AB-700, AB-800 and AB-900 increased rapidly with the increase of the CBZ initial concentration. Then, the adsorption of CBZ on AB-700, AB-800 and AB-900 reached adsorption equilibrium. At low concentrations, the slope of the curve is large, indicating that there are many active sites on the surface of the activated biochar. When the concentration is increased, the curve tends to level.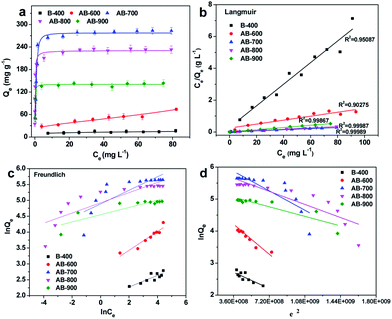 | ||
| Fig. 5 (a) Adsorption isotherms of CBZ on as-prepared biochar samples, and the corresponding (b) Langmuir, (c) Freundlich and (d) D–R linear fitting results. | ||
To further explore the interaction of adsorbate with adsorbents and the structural characteristics of adsorption layer, three isothermal models including Langmuir, Freundlich, and Dubinin–Radusckevich (D–R) were used to fit the adsorption data, and the corresponding equations are given:
Langmuir model:
 | (2) |
 | (3) |
Freundlich model:
 | (4) |
D–R model:
ln![[thin space (1/6-em)]](https://www.rsc.org/images/entities/char_2009.gif) Qe = ln Qe = ln![[thin space (1/6-em)]](https://www.rsc.org/images/entities/char_2009.gif) Qm − KDRε2 Qm − KDRε2
| (5) |
 | (6) |
| E = (2KDR)−1/2 | (7) |
The linear fitting results of Langmuir, Freundlich and D–R models are shown in Fig. 5b, c and d, respectively. The parameters of the Langmuir, Freundlich and D–R models were calculated and were given in Table 3. The results show that the adsorption isotherms of CBZ onto produced biochar fitted well with Langmuir model, suggesting that the adsorption of CBZ can be recognized to be a monolayer adsorption process. The maximum adsorption capacity (Qm) of CBZ on the nonactivated biochar and activated biochar active at 298 K is 14.75, 80.64, 286.5, 234.2, and 142.5 mg g−1 for B-400, AB-600, AB-700, AB-800, and AB-900, respectively.
| Sample | Langmuir | Freundlich | Duninin–Radushkevich | ||||||
|---|---|---|---|---|---|---|---|---|---|
| Qm | b | R2 | Kf | n | R2 | KDR × 10−3 | E | R2 | |
| B-400 | 14.75 | 0.232 | 0.951 | 105.4 | 4.932 | 0.677 | 1.40 | 18.893 | 0.586 |
| AB-600 | 80.64 | 0.0497 | 0.903 | 110.4 | 4.564 | 0.682 | 2.60 | 13.864 | 0.868 |
| AB-700 | 286.5 | 1.212 | 0.999 | 132.8 | 4.669 | 0.822 | 1.69 | 17.219 | 0.645 |
| AB-800 | 234.2 | 5.393 | 0.999 | 139.2 | 6.186 | 0.859 | 1.14 | 20.972 | 0.776 |
| AB-900 | 142.5 | 2.650 | 0.999 | 94.44 | 8.749 | 0.739 | 0.831 | 24.529 | 0.792 |
The hypothesis of Langmuir model is that adsorption is the single layer adsorption, all adsorption sites are the same, and the adsorption particles are completely independent.29 The essential feature of Langmuir isotherm is RL, which is a dimensionless equilibrium parameter and can effectively reflect the characteristics of the isotherm and the nature of adsorption.30 RL = 0 indicate that adsorption is irreversible. RL is between 0 and 1, suggesting favorable adsorption for all the initial concentrations and the temperatures. RL = 1 shows that the adsorption is reversible, and the adsorption isotherm is linear. Otherwise, a value of RL > 1 indicates unfavorable adsorption. Herein, all RL in our experiment is between 0 and 1, indicating that the CBZ adsorption on our as-prepared biochar is favorable.
The superb adsorption capacity of the activated biochar could be due to the relatively large specific surface area, large pore volume and mesoporous structure, providing many exposed active sites and accessible diffusion pathways for the transportation of molecules. The adsorption capacity of AB-700 is up to 286.5 mg g−1, which is much higher than other biochar and carbonaceous nanomaterials (see Table 4). Fig. S4† shows the relationship of pore structure and the adsorption capacity. It can be observed that the Qm of CBZ increases with the increasing specific surface area and pore volume (Fig. S4a†), which indicates that the higher specific surface area and pore volume can provide more effective adsorption sites for CBZ. In addition, the utilization efficiency of pore, presented in Fig. S4b,† shows a triangular shape, indicating that the pore structure of biochar could affect the adsorption of CBZ. The highest utilization efficiency of AB-600 could be mainly attributed to its smallest pore-size (0.87 nm) in all sorbents, which is consistent with the previous studies that the smaller pore has more active in physical adsorption and they create high-energy physical adsorption centres.9,31 Although the pore-size and Vmicro of AB-700 and AB-800 are almost the same, the adsorption capacity (286.5 mg g−1) of AB-700 is obviously higher than that of AB-800 (234.2 mg g−1). It implies that the mesopore and the surface functional groups presented in the biochar are important in the adsorption of CBZ.
| Adsorbents | Qm (mg g−1) | References |
|---|---|---|
| Magnetic nanocomposite of activated carbon (Fe3O4/C) | 182.9 | 32 |
| Activated palm kernel shell | 170.1 | 33 |
| Activated carbon (AC)/Fe3O4 | 45.3 | 34 |
| Magnetic biochar/Fe3O4 | 62.7 | 34 |
| MWCNT | 108 | 35 |
| Expanded graphite | 43.54 | 36 |
| MOF-derived magnetic porous carbon | 37.918 | 37 |
| Peanut shell-biochars | 3.39 | 38 |
| SWCNT | 185 | 39 |
| Pine-wood nanobiochar | 116 | 11 |
| Biomass activated carbon | 286.5 | Our work |
3.3 Adsorption kinetics
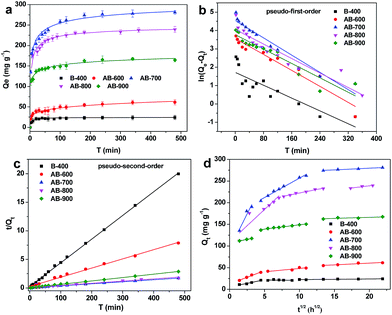
Adsorption kinetic is generally used to estimate the rate of adsorption and provides valuable insights for the adsorption mechanism.26 Fig. 6a shows the influence of the contact time on the adsorption of CBZ onto pristine and activated biochars derived from pomelo peel, respectively. It can be observed that the adsorption amount of CBZ on the as-prepared biochars increased rapidly in the initial dozens of minutes, and then slowed down until the adsorption reached equilibrium with 6 h. It indicated that the adsorption of CBZ occurred in two steps, including rapid adsorption of CBZ to the surface of biochars and slow diffusion in the biochars interior. The fast adsorption rates in the initial step could be attributed to the surface physical sorption (π–π interactions), which is facilitated by lots of active sites at the surface of the biochars and the accessible diffusion pathway in the mesoporous domains. When these surface-active sites were occupied, the adsorption process slowed down and the adsorption rates were limited by the diffusion of CBZ molecules from liquid to the inner-pores of the biochar due to the longer diffusion distance and the larger diffusion resistance. In addition, the first step occurred within 30, 50, 80, 120 and 150 min for B-400, AB-600, AB-900, AB-800 and AB-700, respectively, which could be attributed to the surface properties of biochar. It indicates that the effective surface adsorption sites for CBZ follow the order of AB-700 > AB-800 > AB-900 > AB-600 > B-400. The more sites could uptake more CBZ onto the surface of sorbent in the first step, which required more time.The pseudo-first-order and pseudo-second-order kinetic models were applied to fit the experimental data, and the corresponding equations were listed as follows:
Pseudo-first-order model:
ln(Qe − Qt) = ln![[thin space (1/6-em)]](https://www.rsc.org/images/entities/char_2009.gif) Qe − k1t Qe − k1t
| (8) |
Pseudo-second-order model:
 | (9) |
| Sorbent | Pseudo-first-order | Pseudo-second-order | |||||
|---|---|---|---|---|---|---|---|
| k1 × 103 (min−1) | Qe,cal (mg g−1) | Qe,exp (mg g−1) | R2 | k2 × 103 (g mg−1 min−1) | Qe,cal (mg g−1) | R2 | |
| 400 °C | 8.73 | 5.582 | 24.048 | 0.709 | 6.359 | 24.148 | 0.999 |
| 600 °C | 10.88 | 35.511 | 61.122 | 0.932 | 0.958 | 62.227 | 0.995 |
| 700 °C | 11.74 | 96.529 | 281.062 | 0.945 | 0.440 | 284.900 | 0.999 |
| 800 °C | 9.86 | 57.529 | 339.370 | 0.879 | 0.281 | 261.096 | 0.990 |
| 900 °C | 9.79 | 43.472 | 167.335 | 0.884 | 0.820 | 168.634 | 0.999 |
To further understand the adsorption kinetic of CBZ onto as-prepared biochars, the intra-particle diffusion model was used to fit the adsorption data, and the model equation is shown as follows:40
| Qt = kdt1/2 + C | (10) |
| Sample | Intra-particle diffusion model | ||||||||
|---|---|---|---|---|---|---|---|---|---|
| kd1 | C1 | R12 | kd2 | C2 | R22 | kd3 | C3 | R32 | |
| B-400 | 3.36 | 5.35 | 0.934 | −0.18 | 22.5 | −0.219 | 0.15 | 20.9 | 0.806 |
| AB-600 | 6.11 | 12.5 | 0.980 | 1.51 | 32.9 | 0.748 | 0.81 | 44.3 | 0.843 |
| AB-700 | 32.4 | 92.8 | 0.881 | 8.94 | 167.1 | 0.985 | 0.79 | 263.8 | 0.972 |
| AB-800 | 15.1 | 108.8 | 0.812 | 3.27 | 189.6 | 0.973 | 1.99 | 198.9 | 0.871 |
| AB-900 | 3.17 | 107.3 | 0.995 | 1.99 | 128.9 | 0.975 | 0.48 | 156.5 | 0.605 |
3.4 Thermodynamic analysis
Temperature is an important factor for adsorption process. The effect of temperature on CBZ adsorption was studied, and the adsorption isotherms of CBZ onto AB-700 at 298, 308 and 318 K are shown in Fig. 7a. As we can see, the adsorption capacity (Qe) of CBZ onto AB-700 increased with increasing temperature, demonstrating that the adsorption of CBZ is favorable at a higher temperature, and Fig. 7b shows the corresponding linear fitting results by Langmuir model.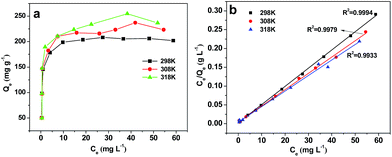 | ||
| Fig. 7 Adsorption isotherms of CBZ at different temperature and the corresponding Langmuir isotherms. | ||
The thermodynamic parameters including standard free energy change (ΔG0, kJ mol−1), standard enthalpy change (ΔH0, kJ mol−1) and standard entropy (ΔS0, J mol−1 K−1) were calculated using eqn (11) and (12).
 | (11) |
ΔG0 = −RT![[thin space (1/6-em)]](https://www.rsc.org/images/entities/char_2009.gif) ln ln![[thin space (1/6-em)]](https://www.rsc.org/images/entities/char_2009.gif) Kd Kd
| (12) |
![[thin space (1/6-em)]](https://www.rsc.org/images/entities/char_2009.gif) Kd as a function of 103/T of linear (Fig. S5†).
Kd as a function of 103/T of linear (Fig. S5†).
Thermodynamic parameters of CBZ adsorption on AB-700 is shown in Table 7. The Gibbs free energy (ΔG0) is negative, indicating that the adsorption process is spontaneous,43 which is consistent with the adsorption isotherms shown in the Fig. 7a. The absolute value of ΔG0 increases at higher temperature, which suggested that the driving force of adsorption and the affinity between CBZ and sorbent increased with increasing temperature. The enthalpy change ΔH0 (11.59 kJ mol−1) >0 indicates that the adsorption process is endothermic, and when |ΔH0| < 20 kJ mol−1, the adsorption process belongs to physical adsorption.44 ΔS (95.64 J mol−1 K−1) >0 indicates that the adsorption process is the process of free increase of entropy. The increased system chaos suggests that the structure of the sorbent significantly changed, which indicates that CBZ is easily adsorbed onto AB-700 but difficult to desorb from the sorbent.
| Temperature (K) | ΔG0 (kJ mol−1) | ΔH0 (kJ mol−1) | ΔS0 (J mol−1 K−1) |
|---|---|---|---|
| 298 | −17.65 | 11.59 | 95.64 |
| 308 | −17.85 | ||
| 318 | −18.05 |
3.5 Effect of pH on adsorption
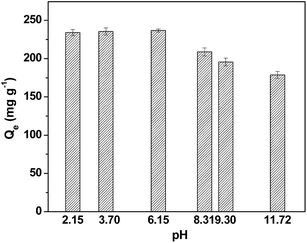
The solution pH is a key factor in any adsorption process. The adsorption capacities of CBZ with different pH values are shown in Fig. 8. It was observed that the adsorption capacity of CBZ slightly increases (from 234.2 to 236.7 mg g−1) with the increase of pH value (from 2.15 to 6.15) at acid, and then gradually reduces (from 236.7 to 178.7 mg g−1) when the pH increases from 6.15 to 11.72. This trend is consistent with the adsorption of CBZ onto graphene and carbon nanotubes.45 In addition, Ncibi et al.17 reported that the sorption of the CBZ on mesoporous activated carbons and multi-walled carbon nanotubes increased as the pH increased from 2 to 6 but decreased as the pH increased from 6 to 10. Brar et al.11 also reported that the sorption of CBZ on pine-wood derived nanobiochar gradually increased as the pH increased from 2 to 6. When the solution pH is less than pHzpc, the adsorbent surface has a positive charge with the proton H+. When the pH of the solution is greater than the pHzpc value, the adsorbent surface is negatively charged with the OH−. The larger the pHzpc, the more positive on the surface of the adsorbent, the stronger the attraction to the anion, and the stronger the repulsion. The pHzpc of AB-700 is 4.46 (Fig. S6†), which indicates that the surface of the AB-700 is positive at the solution pH < 4.46, otherwise the surface of the AB-700 is negative at the solution pH > 4.46. Under the investigated pH range (2.15 to 11.72), CBZ molecules remained unchanged, leading to a low electrostatic attraction with the charged AB-700. Therefore, the adsorption of CBZ onto AB-700 may be mainly controlled by hydrophobic, π–π interactions and hydrogen bonding.3.6 Effect of ionic strength and reuse of sorbent
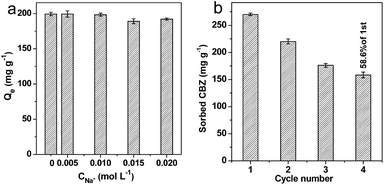
The effects of ionic strength on CBZ adsorption onto AB-700 are presented in Fig. 9a. We can see that the adsorption capacity of CBZ onto AB-700 is stable in the presence of 0.005 and 0.01 M of Na+ ions. When the concentration of Na+ ions was increased to 0.015 and 0.02 M, the adsorption capacity of CBZ onto AB-700 showed a slight decrease. It indicates that the effect of ionic strength is weak on the adsorption of CBZ.To evaluate the possibility of regeneration and reusability of the AB-700 for practical application, the reuse of sorbent was performed and shown in Fig. 9b. According to the TG curve of CBZ (Fig. S1†), the sorbent after adsorption of CBZ was cycled using the heat-treatment method. Fig. 9b shows that the AB-700 still delivered an adsorption capacity of 158.4 mg g−1 for CBZ at the 4th cycle, which is 58.6% of the initial adsorption. Considering the residual of thermal decomposition of CBZ on the surface of AB-700, we believe that as-prepared AB-700 is a great and reversible efficient adsorbent in potential practical application for wastewater treatment.
3.7 Adsorption mechanisms
Hydrophobic interaction may play an important role in the adsorption of CBZ on as-prepared biochar. Generally, the octanol–water distribution coefficient (Kow) of organic pollutants can be used to predict the hydrophobic interaction between adsorbates and adsorbents, and high Kow indicates high hydrophobic interaction. However, the Kow of CBZ is only 2.45, suggesting that CBZ is relatively hydrophilic. Obviously, the weak hydrophobic interaction cannot explain the high adsorption capacity of CBZ onto AB-700. Therefore, the dominant role of hydrophobic effects can be excluded.Hydrogen bond may form between functional groups (such as COOH, OH and NH2) of aromatic compounds and activated biochar. With the increase of solution pH value, the concentration of H+ reduced, and the hydrogen bonding donor groups on CBZ can interact with hydrogen bonding acceptors or π donors in AB-700 and therefore the adsorption efficiency was enhanced. However, when the solution was changed to alkaline, the adsorption of CBZ onto AB-700 decreased. Therefore, hydrogen bond was not the predominant factor to control the adsorption of CBZ in this study.
π–π electron donor–acceptor (EDA) interaction is specific and noncovalent, that exists between electron-rich and electron-poor compounds widely.46 The possibility of π–π EDA interaction has been considered in the adsorption of aromatic compounds to carbon materials. Generally, donor strength increases with the π-system polarizability or electron-donating ability of substitutes, and acceptor strength depends on the electron-withdrawing ability and the number of substitutes.47 The activated biochar is a strongly π-donor because of these π-electron donor groups include the aromatic benzene rings and electron-rich OH. CBZ can be act as a π-electron acceptor due to the electron withdrawing capability of the amide group, whose N atom, along with the heterocyclic ring N, is in sp2 configurations with their lone pairs of electrons delocalized in bonds with the electron-withdrawing carbonyl group.15 Therefore, π–π electron donor–acceptor (EDA) interaction has been proposed to be the primary mechanism for the adsorption of CBZ onto activated biochar. Finally, the change trend of CBZ adsorption onto AB-700 may be attributed to that the π–π EDA interactions between sorbate–sorbent are sensitive to pH of solution.
To further support the adsorption mechanism discussed above, the XPS analysis of the initial AB-700 and the those with adsorbed CBZ were carried out, and shown in Fig. 10. The elemental compositions (atomic%) on our AB-700 and pristine CBZ are presented in Table 8. C is the main element (93.04%) on the surface of AB-700, and 5.79% of O presents in the form of C![[double bond, length as m-dash]](https://www.rsc.org/images/entities/char_e001.gif) O and C–O. In addition, 1.17% of N comes from the nature of pomelo peel. After adsorption of CBZ, the atomic% of O and N on AB-700 increases to 7.63 and 1.79%, respectively. According to the atomic ratio of O in CBZ molecule, the increased ratio of O might come from the adsorbed carbon dioxide on the AB-700. Fig. 10b shows the high-resolution N 1s spectra. The N 1s spectrum of AB-700 can be deconvoluted into two peaks at 399.0 and 400.9 eV, which are assigned to pyridinic-like, and pyrrolic-like N, respectively. The N 1s spectrum of pure CBZ shows two peak components at 399.8 and 400.2 eV, corresponding to the C–N and N–H in CBZ molecule, respectively. The N 1s of AB-700/CBZ indicates the overlay of AB-700 and pure CBZ, but all four peaks of N have a slight shift, which reveals the influence on outer electron cloud density of N atoms due to interaction between adsorbent and adsorbate. Notably, the peaks of C–N and N–H in CBZ shifts to 399.9 and 400.3 eV, respectively, which can be attributed to the π–π EDA interaction between AB-700 and CBZ. The π-electron donor groups on the surface of AB-700 can increase the electron cloud density of N atoms in CBZ molecule, resulting in the weak increase of binding energy of C–N and N–H in CBZ.
O and C–O. In addition, 1.17% of N comes from the nature of pomelo peel. After adsorption of CBZ, the atomic% of O and N on AB-700 increases to 7.63 and 1.79%, respectively. According to the atomic ratio of O in CBZ molecule, the increased ratio of O might come from the adsorbed carbon dioxide on the AB-700. Fig. 10b shows the high-resolution N 1s spectra. The N 1s spectrum of AB-700 can be deconvoluted into two peaks at 399.0 and 400.9 eV, which are assigned to pyridinic-like, and pyrrolic-like N, respectively. The N 1s spectrum of pure CBZ shows two peak components at 399.8 and 400.2 eV, corresponding to the C–N and N–H in CBZ molecule, respectively. The N 1s of AB-700/CBZ indicates the overlay of AB-700 and pure CBZ, but all four peaks of N have a slight shift, which reveals the influence on outer electron cloud density of N atoms due to interaction between adsorbent and adsorbate. Notably, the peaks of C–N and N–H in CBZ shifts to 399.9 and 400.3 eV, respectively, which can be attributed to the π–π EDA interaction between AB-700 and CBZ. The π-electron donor groups on the surface of AB-700 can increase the electron cloud density of N atoms in CBZ molecule, resulting in the weak increase of binding energy of C–N and N–H in CBZ.
| Sample | Carbon% | Oxygen% | Nitrogen% |
|---|---|---|---|
| AB-700 | 93.04 | 5.79 | 1.17 |
| AB-700/CBZ | 90.57 | 7.63 | 1.79 |
| CBZ | 84.69 | 5.44 | 9.87 |
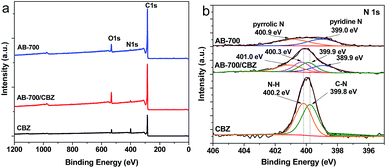 | ||
| Fig. 10 XPS spectra of pristine AB-700, those adsorbed CBZ and pristine CBZ. (a) Full-view, (b) N 1s. | ||
4. Conclusions
In summary, activated biochars were successfully synthesized through the carbonization of pomelo peel and further KOH activation. The characterizations showed that the activation temperature can significantly influence the microstructure and surface chemistry of these activated biochars. The adsorption properties of these activated biochars were investigated by the removal of CBZ from aqueous solution, and the results showed that the behaviors of CBZ onto these activated biochars were fitted well by Langmuir and pseudo-second-order kinetic models, and the adsorption was mainly physisorption and controlled by the intra-particle diffusion. In addition, the adsorption of CBZ onto the as-prepared activated biochars were influenced by the pore structure and surface functional groups, and the activated biochar showed a higher adsorption capacity of CBZ up to 286.5 mg g−1. The thermodynamic analysis revealed that the adsorption of CBZ onto activated biochar (AB-700) were spontaneous and exothermic. The analysis of adsorption mechanism suggested that the adsorption of CBZ onto activated biochar was mainly dominated by π–π electron donor–acceptor interaction.Conflicts of interest
There are no conflicts to declare.Acknowledgements
We gratefully acknowledge the generous support by the National Nature Science Fund of China (Grant No. 51402146), the National Science Fund for Excellent Young Scholars of China (Grant No. 51422807), the Natural Science Foundation (Grant No. 20171BAB206046) of Jiangxi Province, the Science and Technology Planning Project (Grant No. 20151BBG70019) of Jiangxi Province, and the Foundation (Grant No. DA201602064) from the Educational Commission of Jiangxi Province. Additionally, a GanPo 555 Talent Project funded by Jiangxi Province is also appreciated.Notes and references
- J.-L. Liu and M.-H. Wong, Environ. Int., 2013, 59, 208–224 CrossRef CAS PubMed.
- Y. Zhang, S. U. Geissen and C. Gal, Chemosphere, 2008, 73, 1151–1161 CrossRef CAS PubMed.
- X. Yuan, Z. Qiang, W. Ben, B. Zhu and J. Qu, Environ. Sci.: Processes Impacts, 2015, 17, 596–605 CAS.
- B. t. Ferrari, N. Paxéus, R. L. Giudice, A. Pollio and J. Garric, Ecotoxicol. Environ. Saf., 2003, 55, 359–370 CrossRef CAS PubMed.
- A. Dal Pozzo, G. Donzelli, L. Rodriquez and A. Tajana, Int. J. Pharm., 1989, 50, 97–101 CrossRef CAS.
- V. Calisto, M. R. M. Domingues, G. L. Erny and V. I. Esteves, Water Res., 2011, 45, 1095–1104 CrossRef CAS PubMed.
- A. Almeida, V. Calisto, V. I. Esteves, R. J. Schneider, A. M. Soares, E. Figueira and R. Freitas, Aquat. Toxicol., 2014, 156, 74–87 CrossRef CAS PubMed.
- A. Jelic, M. Gros, A. Ginebreda, R. Cespedes-Sánchez, F. Ventura, M. Petrovic and D. Barcelo, Water Res., 2011, 45, 1165–1176 CrossRef CAS PubMed.
- L. Nielsen, M. J. Biggs, W. Skinner and T. J. Bandosz, Carbon, 2014, 80, 419–432 CrossRef CAS.
- J. Chen, D. Zhang, H. Zhang, S. Ghosh and B. Pan, Sci. Total Environ., 2017, 579, 598–605 CrossRef CAS PubMed.
- M. Naghdi, M. Taheran, R. Pulicharla, T. Rouissi, S. K. Brar, M. Verma and R. Y. Surampalli, Arabian J. Chem., 2017 DOI:10.1016/j.arabjc.2016.12.025.
- S. Komtchou, A. Dirany, P. Drogui and A. Bermond, Environ. Sci. Pollut. Res., 2015, 22, 11513–11525 CrossRef CAS PubMed.
- L. Tang, J.-j. Wang, C.-t. Jia, G.-x. Lv, G. Xu, W.-t. Li, L. Wang, J.-y. Zhang and M.-h. Wu, Appl. Catal., B, 2017, 205, 587–596 CrossRef CAS.
- D. Fatta-Kassinos, M. I. Vasquez and K. Kummerer, Chemosphere, 2011, 85, 693–709 CrossRef CAS PubMed.
- N. Cai and P. Larese-Casanova, J. Colloid Interface Sci., 2014, 426, 152–161 CrossRef CAS PubMed.
- P. Oleszczuk, B. Pan and B. Xing, Environ. Sci. Technol., 2009, 43, 9167–9173 CrossRef CAS PubMed.
- M. C. Ncibi and M. Sillanpää, J. Mol. Liq., 2017, 238, 379–388 CrossRef CAS.
- W. Zhang, Y. Ding, S. A. Boyd, B. J. Teppen and H. Li, Chemosphere, 2010, 81, 954–960 CrossRef CAS PubMed.
- Y. L. Zhang, J. Zhang, C. M. Dai, X. F. Zhou and S. G. Liu, Carbohydr. Polym., 2013, 97, 809–816 CrossRef CAS PubMed.
- C. Wang, H. Li, S. Liao, H. Zheng, Z. Wang, B. Pan and B. Xing, Carbon, 2013, 65, 243–251 CrossRef CAS.
- L. Hadjittofi, M. Prodromou and I. Pashalidis, Bioresour. Technol., 2014, 159, 460–464 CrossRef CAS PubMed.
- G. X. Yang and H. Jiang, Water Res., 2014, 48, 396–405 CrossRef CAS PubMed.
- H. Jin, S. Capareda, Z. Chang, J. Gao, Y. Xu and J. Zhang, Bioresour. Technol., 2014, 169, 622–629 CrossRef CAS PubMed.
- S. Dawood, T. K. Sen and C. Phan, Bioresour. Technol., 2017, 246, 76–81 CrossRef CAS PubMed.
- L. Lin, W. Jiang and P. Xu, Sci. Total Environ., 2017, 601–602, 857–864 CrossRef CAS PubMed.
- J. Deng, Y. Liu, S. Liu, G. Zeng, X. Tan, B. Huang, X. Tang, S. Wang, Q. Hua and Z. Yan, J. Colloid Interface Sci., 2017, 506, 355–364 CrossRef CAS PubMed.
- Y. Dong, W. Wang, H. Quan, Z. Huang, D. Chen and L. Guo, ChemElectroChem, 2016, 3, 814–821 CrossRef CAS.
- W. Wang, H. Quan, W. Gao, R. Zou, D. Chen, Y. Dong and L. Guo, RSC Adv., 2017, 7, 16678–16687 RSC.
- M. Kumar, B. P. Tripathi and V. K. Shahi, J. Hazard. Mater., 2009, 172, 1041–1048 CrossRef CAS PubMed.
- Z. Zawani, A. Chuah and T. Choong, Eur. J. Sci. Res., 2009, 37, 67–76 Search PubMed.
- C. O. Ania and T. J. Bandosz, Langmuir, 2005, 21, 7752–7759 CrossRef CAS PubMed.
- M. Baghdadi, E. Ghaffari and B. Aminzadeh, J. Environ. Chem. Eng., 2016, 4, 3309–3321 CrossRef CAS.
- M.-H. To, P. Hadi, C.-W. Hui, C. S. K. Lin and G. McKay, J. Mol. Liq., 2017, 241, 386–398 CrossRef CAS.
- D. Shan, S. Deng, T. Zhao, B. Wang, Y. Wang, J. Huang, G. Yu, J. Winglee and M. R. Wiesner, J. Hazard. Mater., 2016, 305, 156–163 CrossRef CAS PubMed.
- N. Cai and P. Larese-Casanova, J. Colloid Interface Sci., 2014, 426, 152–161 CrossRef CAS PubMed.
- D. A. Borisova, M. D. Vedenyapina, E. D. Strel’tsova, V. L. Maslov, K. H. Rosenwinkel, D. Weichgrebe, P. Stopp and A. A. Vedenyapin, Solid Fuel Chem., 2013, 47, 298–302 CrossRef CAS.
- D. Chen, C. Chen, W. Shen, H. Quan, S. Chen, S. Xie, X. Luo and L. Guo, Adv. Powder Technol., 2017, 28, 1769–1779 CrossRef CAS.
- G. Chu, J. Zhao, F. Chen, X. Dong, D. Zhou, N. Liang, M. Wu, B. Pan and C. E. W. Steinberg, Environ. Pollut., 2017, 227, 372–379 CrossRef CAS PubMed.
- F. F. Liu, J. Zhao, S. Wang, P. Du and B. Xing, Environ. Sci. Technol., 2014, 48, 13197–13206 CrossRef CAS PubMed.
- S. K. Singh, T. G. Townsend, D. Mazyck and T. H. Boyer, Water Res., 2012, 46, 491–499 CrossRef CAS PubMed.
- J. Wu and H. Q. Yu, J. Hazard. Mater., 2006, 137, 498–508 CrossRef CAS PubMed.
- Y. Xi, Y. Luo, J. Luo and X. Luo, J. Chem. Eng. Data, 2015, 60, 3253–3261 CrossRef CAS.
- H. Gu, H. Lou, J. Tian, S. Liu and Y. Tang, J. Mater. Chem. A, 2016, 4, 10174–10185 CAS.
- M. Alkan, O. Demirbas, S. Celikcapa and M. Dogan, J. Hazard. Mater., 2004, 116, 135–145 CrossRef CAS PubMed.
- F.-f. Liu, J. Zhao, S. Wang, P. Du and B. Xing, Environ. Sci. Technol., 2014, 48, 13197–13206 CrossRef CAS PubMed.
- C. A. Hunter and J. K. M. Sanders, J. Am. Chem. Soc., 1990, 112, 5525–5534 CrossRef CAS.
- W. Chen, L. Duan and D. Zhu, Environ. Sci. Technol., 2007, 41, 8295–8300 CrossRef CAS PubMed.
Footnote |
| † Electronic supplementary information (ESI) available. See DOI: 10.1039/c7ra10805b |
| This journal is © The Royal Society of Chemistry 2017 |


