
 Open Access Article
 This Open Access Article is licensed under a
 Creative Commons Attribution 3.0 Unported Licence
Rapid identification of quarantine invasive Solanum elaeagnifolium by real-time, isothermal recombinase polymerase amplification assay†
Rong Lei *a,
Zhengyue Yanb,
Fan Hua,
Shuifang Zhua,
Yufen Xionga and
Xiaohong Fan*a
*a,
Zhengyue Yanb,
Fan Hua,
Shuifang Zhua,
Yufen Xionga and
Xiaohong Fan*a
aChinese Academy of Inspection and Quarantine, Beijing, China 100176. E-mail: leir@caiq.gov.cn; fan98494@sina.com
bFang Cheng Gang Entry-Exit Inspection and Quarantine Bureau, Guangxi 538001, China
First published on 14th November 2017
Abstract
The rapid identification and assay of quarantine Solanum weeds is currently an enormous challenge due to the similar morphology of the seed and seedling of Solanaceae. Herein, we report the development of an easy-to-implement strategy to identify Solanum elaeagnifolium by utilizing recombinase polymerase amplification (RPA) technology. The strategy can be performed in less than one hour without harsh reaction conditions or expensive detection equipment, demonstrating a huge potential for fast on site identification. To monitor the amplification process, an oligonucleotide probe flanked by a dT-fluorophore and a corresponding dT-quencher group with homology to the target was designed to indicate the real-time fluorescence intensity during amplification. The increase of the fluorescence signal can be observed within 10 min at 39 °C. The limit of detection (LOD) of the real-time RPA assay of S. elaeagnifolium was estimated to be 2.55 pg genomic DNA, and the limit of quantification (LOQ) was estimated to be 25.5 pg genomic DNA. The rapid nature of the RPA assay and its low energy requirements compared to other amplification technologies suggested that RPA-based assays could be used for field screening of quarantine weeds and species.
1. Introduction
Solanum elaeagnifolium (silverleaf nightshade), belonging also to the genus Solanum,1–3 having originated in the Americas, is now a serious summer-growing, perennial weed in many countries, including Australia, India, Greece, Spain, and South Africa.4–10 It is difficult to control and impossible to eradicate S. elaeagnifolium using foliar-applied herbicides due to the dense covering of trichomes on the leaves that give the plant a silvery appearance.11–13 The invasion of S. elaeagnifolium reduces crop yields and contaminates harvested products by affecting their quality and marketability. It is toxic to livestock and very hard to control, as root stocks that are less than 1 cm long can develop aboveground parts.5,14 Metabolites from the regenerated plant are speculated to disrupt the blood-brain barrier, allowing ivermectin to enter and disrupt neurotransmitter function in the brain and spinal cord.11,15 Therefore, to rapidly identify the seed and seedling in the field is important in early prevention of the spreading of S. elaeagnifolium.Normally, identification of Solanum species is based on the morphology of leaf, flower, fruit, trichome and seed, which requires expertise and long time.16,17 With the spread of S. elaeagnifolium around the world as a contaminant in animal feed and crop seed, as well as in contaminated soil, ornamental plants, livestock and manure, vehicles and farm machinery, rapid identification and detection is currently a big challenge because identification of seed morphology and seedling of Solanaceae are time-consuming. Zhang et al. adopted DNA barcoding method to identify S. elaeagnifolium18 and other Solanaceae plants by employing two chloroplast gene regions (ndhF, and trnS-trnG) and one nuclear gene region (waxy).19 However, the DNA barcoding techniques need the subsequent procedures, i.e. PCR amplification, sequencing, and alignment, which demands professional skills and time, thus limiting its application for fast on site identification.
Recently, recombinase polymerase amplification (RPA) have been emerging as a state-of-the-art, isothermal technology for use in molecular diagnosis of infectious diseases, pathogens and genetically modified organisms.20–27 Unlike isothermal DNA amplification methods, e.g. Loop-mediated Isothermal AMPlification (LAMP)28–30 performed at 60–70 °C, PRA reaction proceeds at a temperatures between 37 °C and 42 °C.31 RPA process, employing a recombinase enzyme, a single-stranded DNA-binding protein (SSB), a strand-displacing polymerase called Bsu polymerase and two opposing primers, allows exponential amplification of a defined region of DNA molecule. The Bsu polymerase maintains similar activity in inhibiting environments, operates at lower temperatures, and do not need post-amplification treatment.32 Due to its shorter incubation time and isothermal feature,33 RPA can be adopted in a smaller scale of amplification system for nucleic acids with lateral flow strip34 or real-time fluorescence signal22,35 for rapid detection of samples in field.36,37
In order to accelerate the fast on site identification of invasive S. elaeagnifolium weed at port and early identification in field, we developed a strategy including plant genomic DNA extraction employing magnetic beads and fast DNA assay using real-time RPA technology. Results can be obtained in about one hour starting from plant DNA extraction, hence to allow rapid identification of S. elaeagnifolium.
2. Experimental
2.1. Materials
The TwistAmp™ Basic, TwistAmp™ exo kits and TwistDX T8 instrument were purchased from TwistDx Ltd. (Cambridge, UK). The plant DNA extraction kit with magnetic beads was purchased from Tiangen Biotech (Beijing, China). Qubit™ 3 Fluorometer and quantification starker kit were purchased from ThermoFisher Scientific (USA). SyberGreen, 100 bp DL Marker and 2000 bp DL marker were purchased from Takara (Dalian, China). The Agencourt AMPure XP were purchased from Beckman Coulter (California, USA). Power SYBR™ Green PCR Master Mix was purchased from ThermoFisher Scientific (USA). The DiH2O obtained from a Milli-Q water purification system (Millipore Corp., Bedford, MA) was sterilized at 120 °C for 20 min.2.2. Plant samples
The materials used were specimen prepared from weeds intercepted by China Inspection and Quarantine authorities, escaping species around import enterprises, and herbaria species exchanged from overseas. Fresh plant leaves and seeds were collected from Fang Cheng Gang area in Guangxi province.2.3. Plant DNA extraction
Total genomic DNA from plants was extracted using plant DNA extraction kit with magnetic beads. A total of 40 mg dry specimen, or 100 mg seeds, or 100 mg fresh plant leaves were finely ground to powder in liquid nitrogen, and DNA was extracted with magnetic beads according to the manufacture's protocol. About 20–100 μL autoclaved distilled water was added to elute each DNA sample. The concentration of DNA template was quantified with Qubit Fluorometer according to the manufacturer's instructions.2.4. Primer and probe sequences for real-time RPA
We initially screened a characteristic amplicon of S. elaeagnifolium voucher Bohs 3204 UT granule-bound starch synthase (GBSSI) gene (AY996412.1) using basic RPA kit with which fluorescence probes were not required. Four forward and three reverse primers (Table S1†) were designed to amplify the target regions of S. elaeagnifolium genomic DNA. Then three forward primers (exo-F), four reverse primers (exo-R), and a probe (Elae-P) (Fig. S3†) were designed based on the sequence of the specific amplicons of S. elaeagnifolium, in order to select the combination producing the highest analytical sensitivity for the S. elaeagnifolium. Primers and probes were synthesized by Sangon Biotech (Shanghai, China).2.5. RPA reaction condition
For the real-time RPA reaction, 420 nM primers, 120 nM exo probe and 14 mM magnesium acetate were contained in 50 μL reaction volume. To select optimal primers, all reagents except for the primers and magnesium acetate were prepared in a master mix; for the assay of sample, all reagents except for the template and magnesium acetate were prepared in a master mix. Aliquots of the master mix was added into 0.2 mL reaction tubes containing a dried enzyme pellet. After addition of the primers or template, the reaction was vortex mixed briefly and spun down, subsequently magnesium acetate was pipetted onto the tube lids, the lids were closed carefully, and magnesium acetate was centrifuged into the rehydration buffer using a minispin centrifuge. The solution was vortex mixed briefly and spun down. Tubes were immediately placed in an incubator or the T8 instrument and incubated at 39 °C for 20–60 min. The fluorescence signal was monitored in real-time.2.6. Real-time PCR assay
Four primers were designed for the real-time PCR assay according to the GBSSI gene of S. elaeagnifolium (AY996412) (Table S2†). Primers were synthesized in Sangon Biotech (Shanghai, China). Real-time PCR was performed using the Power SYBR™ Green PCR Master Mix in 20 μL volume. One microliter each of forward and reverse primer (10 μM each), 7 μL of DiH2O and 10 μL of Power SYBR™ Green PCR Master Mix were mixed, and 1 μL of DNA template was added. The reaction was completed on Roche LightCycler 480 in the following steps, 95 °C for 10 min, 45 cycles of 95 °C for 15 s and 55 °C for 60 s. The fluorescent dye SYBRGreen was used as a reporter dye in real-time PCR. The melting curve was monitored after the amplification.2.7. Analytical performances
Specificity of the RPA assay was evaluated using about 20 ng of genomic DNA as template. S. elaeagnifolium, S. carolinense, S. rostratum, and S. torvum were assayed with the same primers and probe used in the RPA assay. To evaluate the sensitivity of the RPA assay, plant genomic DNA was serially diluted to achieve a range of DNA concentrations and 1 μL of each dilution was amplified with RPA reactions. Fluorescent signals were analyzed by obtaining 1st derivative analysis to verify the increase of fluorescence occur at a sufficiently high rate.The standard variation was calculated by measuring four times repeatedly the same sample with the developed assay procedure.
3. Results and discussion
3.1. Strategy of fast genomic DNA identification
The commercially available plant genomic DNA extraction kits employ centrifugation tubes, magnetic beads, and/or hazardous chemicals such as chloroform and phenol. Amongst these, DNA absorption and separation by using magnetic beads do not require high-speed centrifugation, thus is a better choice for on site DNA extraction. The total time for isolation took about 30 min (Scheme 1). Eluted DNA was mixed with primers, probes and rehydration buffer, and the mixture was added to the freeze-dried powder containing all the enzyme and reagents necessary for DNA amplification. In the temperature window of 37–42 °C, amplification started, and the oligonucleotide probe flanked by a dT-fluorophore and a corresponding dT-quencher group targeted to the amplicon. In a double stranded context, the THF residue representing the ‘gap’ in the probe would be cut by the DNA repair enzyme Exonuclease III to separate the fluorophore and the quencher, generating fluorescence (Scheme 1). The cutting of the probe is therefore indicative of the specific target amplification event and can be used to monitor specific amplicon accumulation. The fluorescence intensity can be observed with a portable fluorescence detection device after about 10 min's amplification.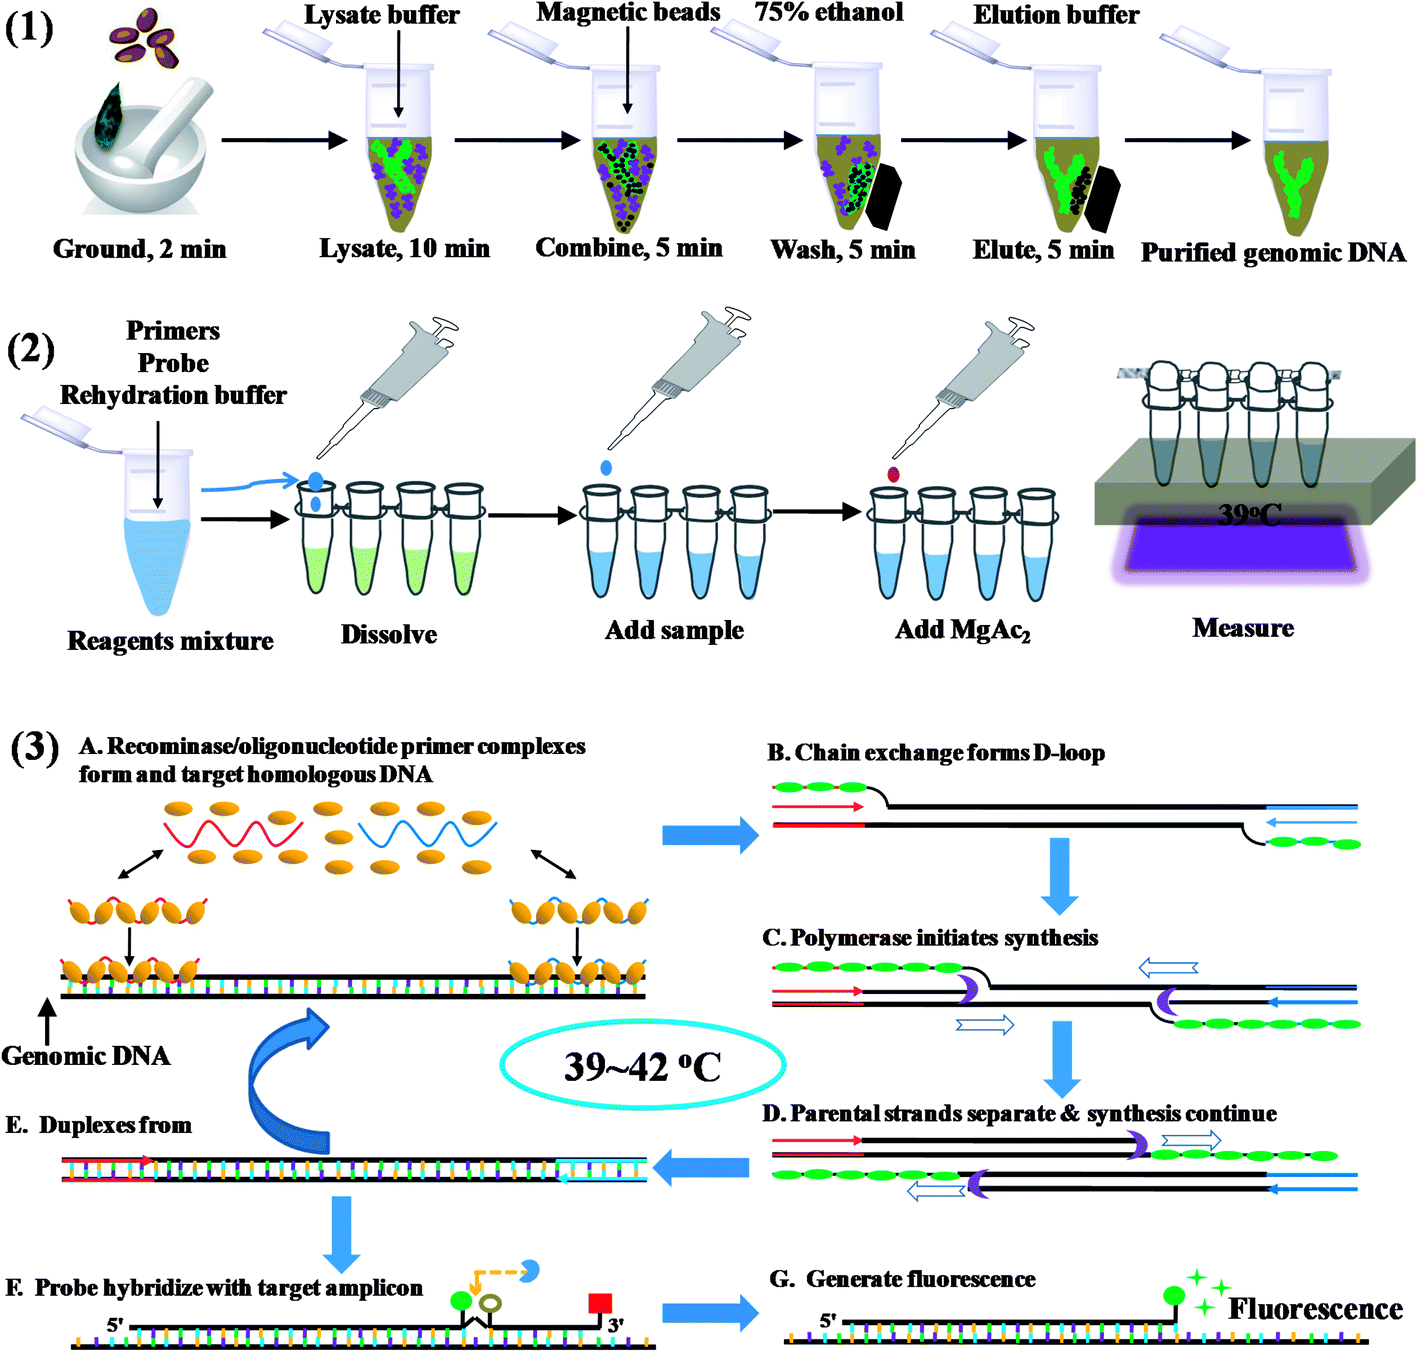 | ||
| Scheme 1 Scheme of fast on site weed plant DNA assay strategy. (1) plant DNA extraction procedure with magnetic beads; (2) RPA assay procedure; (3) the amplification principle of recombinase polymerase amplification. | ||
3.2. Primer selection of S. elaeagnifolium RPA assays
Chloroplast gene regions, ndhF and trnS-trnG, and nuclear gene region (waxy) have been adopted in DNA barcoding to identify Solanum weeds.19 For S. elaeagnifolium, S. carolinense, S. rostratum and S. torvum, the similarity of ndhF, trnS, and GBSSI gene is 99.59%, 93.08%, and 93.89%, respectively. Because of the shortest trnS gene sequence and fewest variation among these four genes, we chose the voucher Bohs 3204 UT granule-bound starch synthase (GBSSI) gene as the target. A series of forward and reverse primers of S. elaeagnifolium were designed to search for a specific region. The purified amplicons were detected by gel electrophoresis. Four primer pairs, e.g. the combination of four forward primers and the BR1 primer could amplify the DNA template (Fig. S1†). Through the alignment of the sequences of primers and S. carolinense, S. rostratum and S. torvum GBSSI gene, BF2/BR1 and BF3/BR1 were chosen to amplify the genomic DNA template of S. elaeagnifolium, S. carolinense, S. rostratum and S. torvum, and the results showed that the primer pair BF2/BR1 amplified only S. elaeagnifolium genome, while BF3/BR1 could amplify S. elaeagnifolium, S. carolinense, and S. torvum genome (Fig. S1 & S2†). However, when the primers BF2/BR1 and probe Elae-P were used to amplify the S. elaeagnifolium genome, real-time fluorescence intensity was low (Fig. 1A, red solid line). To optimize the better primers, more forward and reverse primers around BF2 and BR1 were designed (Table 1 & Fig. S3†). All the primers can amplify S. elaeagnifolium genome template (Fig. 1A). To screen the primers which can specifically amplify the S. elaeagnifolium, these primers were used to amplify the genomic DNA of S. rostratum and S. torvum, and S. carolinense (Fig. 1B–D). The primers exoF3/exoR1 and exoF3/exoR2 produced a high efficiency of amplification, but they can also amplify significantly S. rostratum and S. torvum. The primers exoF1/exoR2 and exoF2/exoR2 were unable to amplify S. torvum, S. carolinense. Although exoF1/exoR4, exoF2/exoR3 and exoF2/exoR4, could not amplify S. torvum, S. carolinense, and S. rostratum, it had low efficiency to amplify S. elaeagnifolium. Since exoF1/exoR2 and exoF2/exoR2 produced the same amplicon, we chose exoF1/exoR2 to perform the subsequent experiment.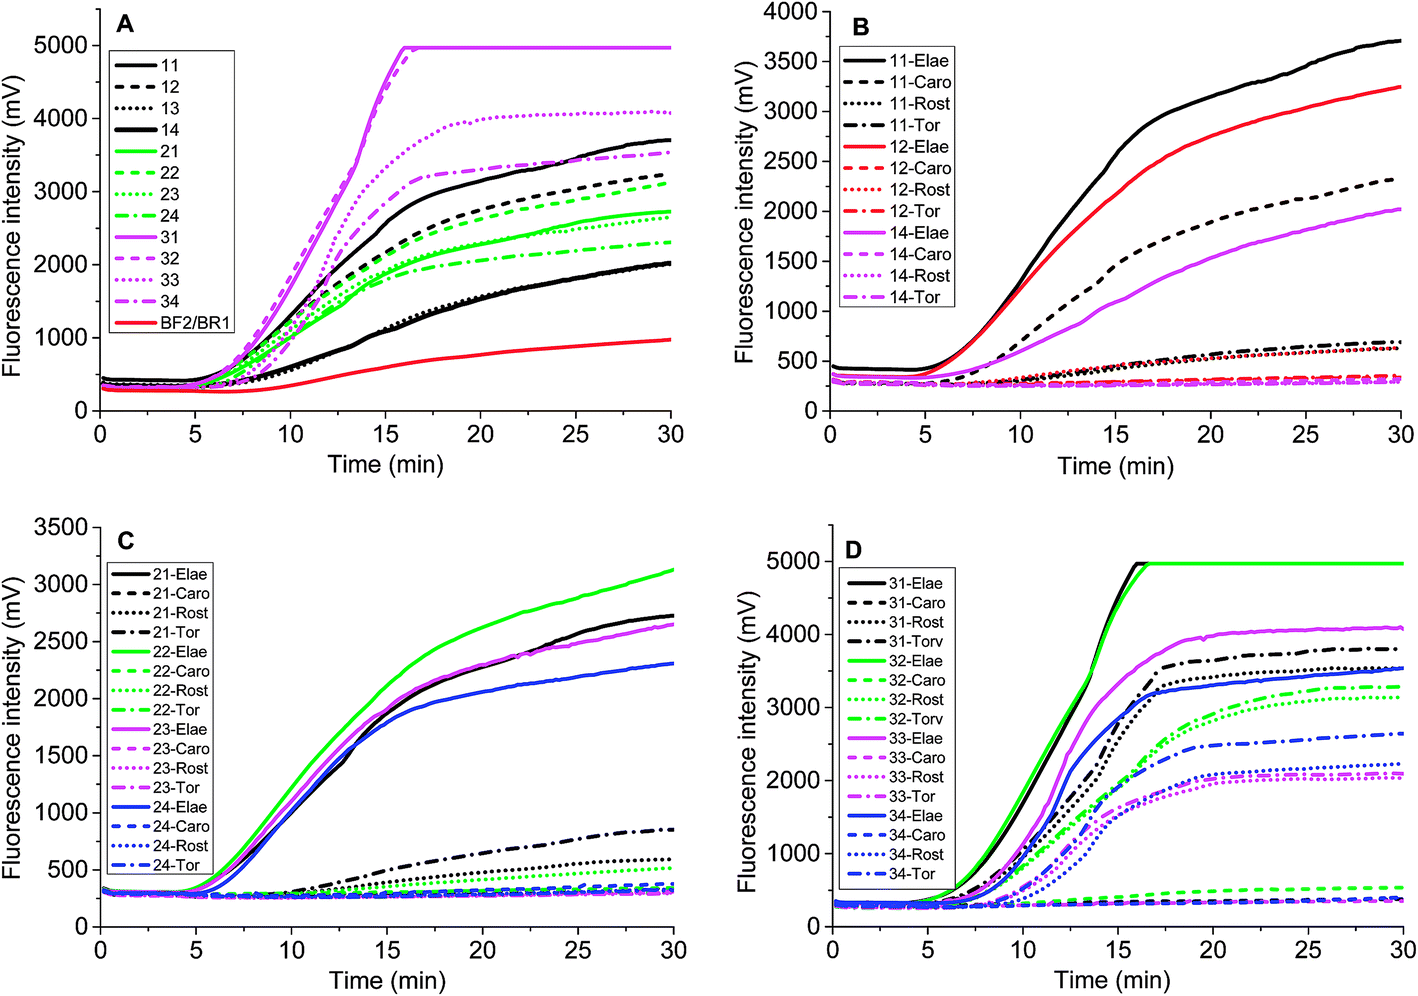 | ||
| Fig. 1 The screen of primers to specifically amplify DNA template of S. elaeagnifolium. A, The real-time fluorescence curves of different primers and Elae-P to amplify S. elaeagnifolium. 11, Elae-exoF1/exoR1; 12, Elae-exoF1/exoR2; 13, Elae-exoF1/exoR3; 14, Elae-exoF1/exoR4; 21, Elae-exoF1/exoR1; 22, Elae-exoF2/exoR2; 23, Elae-exoF2/exoR3; 24, Elae-exoF2/exoR4; 31, Elae-exoF3/exoR1; 32, Elae-exoF3/exoR2; 33, Elae-exoF3/exoR3; 34, Elae-exoF3/exoR4; BF2/BR1, Elae-BF2/BR1. (B–D), the real-time fluorescence curves of selected primers to amplify different DNA templates, i.e. S. elaeagnifolium (Elae), S. torvum (Tor), S. carolinense (Caro) and S. rostratum (Rost). | ||
| Name | Sequences 5′-3′ | Position in GBSSI gene sequence (AY996412.1) |
|---|---|---|
| Elae-exoF1 | TTCTGTCAAGTAAGTTACTAGCTGTATGGTTGTC | 393 |
| Elae-exoF2 | TTCTGTCAAGTAAGTTACTAGCTGTATGGTTG | 393 |
| Elae-exoF3 | ACTAGCTGTATGGTTGTCTTGACTTAATGTG | 410 |
| Elae-exoR1 | CCTCTAGGGCTGCCTGAGAGTGACAAAGAAAACA | 510 |
| Elae-exoR2 | CAAATTCAGAACTCTGGGTGCCTCTAGGGCTGCC | 531 |
| Elae-exoR3 | CCATATGGTCCTGAGAAGTATTTGCTGCAG | 562 |
| Elae-exoR4 | CCAAGGAGATTTCTGAAACTGGGATGTGTTACC | 593 |
| Elae-P | ACTAGCTGTATGGTTGTCTTGACTTAATGTG(FAM-dT)(THF)(BHQ1-dT) | 411–456 |
| CATTTTACTTTTGTC-C3 spacer |
3.3. Optimization of RPA reaction components
Fluorescent probe is directly related to the fluorescence intensity of amplification. The stock solution of Elae-P (10 mM) was stepwisely diluted to 5 mM and 2.5 mM Elae-P solution, and 0.6 μL was added to the 50 μL reaction tube to obtain final concentration of 120 nM, 60 nM and 30 nM Elae-P in the reaction tube, respectively. The results showed that higher fluorescent probe produced high fluorescent background and signal for high amount of genomic DNA (25.5 ng) (Fig. 2A). There is no obvious amplification signal when the final concentration of 30 nM Elae-P was used. Therefore, 120 nM Elae-P was used for the subsequent RPA reaction. | ||
| Fig. 2 The influence of concentration of fluorescence probe Elae-P (A) and magnesium acetate (B) on the RPA amplification reaction using primer Elae-exoF1/exoF2 and probe Elae-P. (A) a, 14 mM Mg2+; b, 10.5 mM Mg2+; c, 7 mM Mg2+ in the reaction tube. (B) Three level of S. elaeagnifolium genomic DNA (a – 2.55 ng; b – 0.255 ng; c – 0.0255 ng) using three level of Elae-P concentration (1–120 nM; 2–60 nM; 3–30 nM) as the fluorescence probe. | ||
Magnesium acetate is the key component to start the RPA reaction. To investigate the influence of magnesium acetate, 2.5 μL of 280 mM, 210 mM and 140 mM magnesium acetate was added simultaneously into the RPA reaction tube, to obtain the final concentration of 14 mM, 10.5 mM and 7 mM Mg2+ in the RPA reaction system, respectively. The results showed that faster RPA reaction was generated by higher magnesium acetate concentration (Fig. 2B). So the final concentration of 120 nM Elae-P was selected for the subsequent RPA reaction.
3.4. Analytical sensitivity of RPA assays
Two parameters are correlated to the amount of template: the onset time of detectable amplification and fluorescence intensity. The onset time of detectable amplification for a given assay is dependent on the amount of starting template material: the more template copies there are to start with, the shorter the time to detection. However, the time-based quantification demands a careful experimental setup, since it is critical to ensure the simultaneous initiation of compared reactions. For the fluorescence intensity of exponential RPA amplification, it is difficult to discriminate the peak value. Still, we tried to figure out the limit of detection (LOD) of this exponential amplification reaction.To validate if the developed RPA assays can be used for the real sample identification, the genomic DNA template was diluted from 25.5 ng to 2.55 pg, and the RPA reaction was started at the same time. The fluorescence intensity curves showed that the developed real-time RPA method can detect 2.55 pg genomic DNA, whose signal was obviously higher than the negative control. According to the amplification curves (Fig. 3), there is no obvious signal onset before 4.5 min. So the standard deviation (SD) was calculated by choosing the signals from 6 reactions (Fig. 3, curve 1–6, and W) which have the same components of primers and probe, and the LOD was estimated by comparing the fluorescence intensity resulted from genomic DNA with the sum value of average and 3 times of SD (Fig. 3, navy line). The LOQ was estimated by comparing the fluorescence intensity resulted from genomic DNA with the sum of average and 10 times of SD (Fig. 3, black line). Therefore, the LOD was estimated to be 2.55 pg, and the LOQ was estimated to be 25.5 pg.
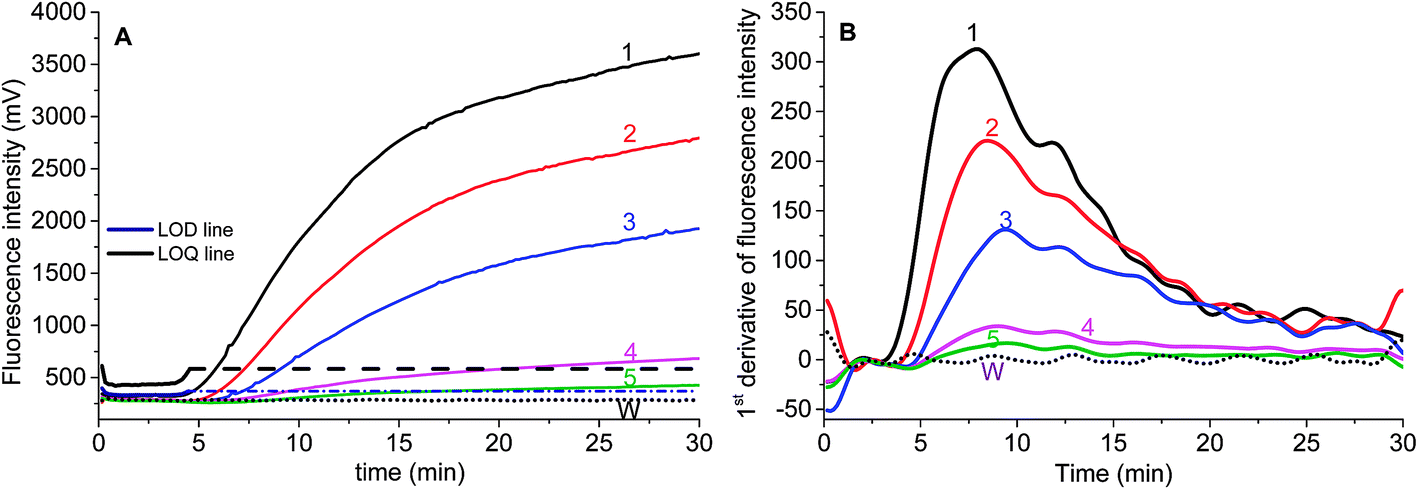 | ||
| Fig. 3 The analytical sensitivity of RPA assay by using Elae-exoF1/exoR2 and Elae-P. (A) The real-time fluorescence intensity of genomic DNA template with amount of 25.5 ng (1), 2.55 ng (2), 0.255 ng (3), 25.5 pg (4), 2.55 pg (5) S. elaeagnifolium, and water (W). (B) The 1st derivative curves of the corresponding real-time fluorescence intensity in (A). The numbers indicate the same meaning as those in (A). | ||
The standard deviation was evaluated by repeatedly measuring four times 2.55 ng and 0.255 ng of S. elaeagnifolium genomic DNA, respectively. It was found that the maximum standard deviation is 3.3% for the larger amount of genomic DNA, and 12.6% for the smaller amount of genomic DNA (Fig. 5A).
Real-time PCR is the gold standard of genomic DNA identification and quantification due to its high specificity and high sensitivity. However, there is few publication about the real-time PCR assay of S. elaeagnifolium. In order to compare the performance of real-time RPA and real-time PCR method, the primers for real-time PCR were designed to assay the S. elaeagnifolium genomic DNA (Table S2†). The fluorescence intensity and melting curve results showed that the primer 3 has the best specificity, and can differentiate the genomic DNA of S. elaeagnifolium from the other four Solanum weeds (Fig. S4 & S5†). Furthermore, the fluorescence intensity curves showed that the primer E-rtPCR-F3/R3 can detect 25.5 fg genomic DNA of S. elaeagnifolium (Fig. 4A). The real-time PCR fluorescence intensity produced from 25.2 ng of S. rostratum, 32.2 ng of S. carolinense and 47.6 ng of Solanum nigrum is equivalent to that of 2.55 pg genomic DNA of S. elaeagnifolium (Fig. 4B). However, the disadvantage of real-time PCR of longer analysis time and demanding expensive instrument discounts its application in rapid detection.
 | ||
| Fig. 4 Sensitivity analysis of the real-time PCR assay of different S. elaeagnifolium genomic DNA template (A) and other weeds genomic DNA template (B) in 20 μL reaction. (A): a, 2.55 ng; b, 0.255 ng; c, 25.5 pg; d, 2.55 pg; e, 0.255 pg; f, 25.5 fg of S. elaeagnifolium; w, water. (B): E, 25.5 ng of S. elaeagnifolium; R, 25.2 ng of S. rostratum; (C), 32.2 ng of S. carolinense; T, 24.6 ng of S. torvum; N, 47.6 ng of Solanum nigrum seed genomic DNA; TL, 19.5 ng of S. torvum leaf genomic DNA. w, water. | ||
3.5. Field sample RPA assays
We adopted the optimized primers and probe to measure extracted DNA from the Solanum seeds and leaves from the field. The real-time RPA fluorescence intensity curves indicated that within 8 min, fluorescence intensity above LOQ intensity produced from S. elaeagnifolium seed could be obtained, but the signals from S. rostratum seed, S. torvum leaf, and S. nigrum seed were lower than LOQ intensity after 15 min (Fig. 5B). The amplification efficiency of 25.5 pg of S. elaeagnifolium is equivalent to 25.2 ng of S. rostratum and 47.6 ng of S. nigrum, whose concentration is about 1000 times higher than that of S. elaeagnifolium. This result indicates that the sensitivity of S. elaeagnifolium RPA assay can be used for the real sample identification in field. This result indicates that the sensitivity of S. elaeagnifolium RPA assay can be used for the real sample identification in field (Fig. 5B). Therefore, this RPA assay is promising to provide a fast screening of S. elaeagnifolium out of seeds, seedlings and dry specimens.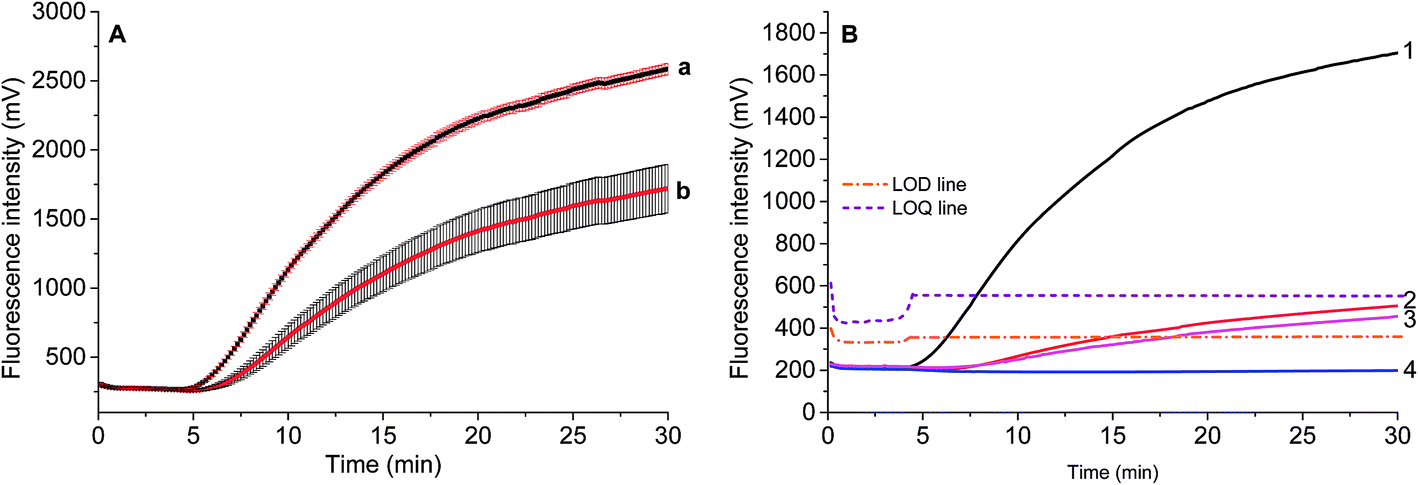 | ||
| Fig. 5 The repeatability of PRA assay for 2.55 ng (a) and 0.255 ng (b) of S. elaeagnifolium genomic DNA (A), and the field sample of seeds or leaves (B). (B) Curve 1, 2.92 ng of S. elaeagnifolium seed genomic DNA; 2, 25.2 ng of S. rostratum seed; 3, 47.6 ng of S. nigrum seed; 4, 21.2 ng of S. torvum leaf. | ||
3.6. Comparison of real-time RPA and real-time PCR assay for S. elaeagnifolium
The present method to identify S. elaeagnifolium were listed in Table 2. The conventional taxonomy method to identify the weeds needs professional and experienced personnel and long time. Although DNA barcoding can differentiate closely related species, it needs PCR amplification, sequencing and barcoding gap analysis, requiring professional and experienced persons, as well as relative long time.19 Real-time PCR is the gold standard of molecular detection which can give identification and quantification information about the genomic DNA, but it demands expensive instrument which could not be portable. Real-time RPA can also provide identification and semi-quantification information about the genomic DNA, but the required time is shorter than that of real-time PCR assay. The remarkable advantage of real-time RPA is that the amplification and assay can be performed on an portable instrument, such as TwistDX T8, which costs less than $13,000. In this developed RPA method, the fluorescence intensity produced by other quarantine Solanum weeds genomic DNA was lower than the LOQ of S. elaeagnifolium. Therefore, the real-time RPA technology can be used for fast field sample identification with portable instrument.| Item | Real-time RPA (50 μL) | Real-time PCR (20 μL) | DNA Barcoding19 | Taxonomy |
|---|---|---|---|---|
| Sensitivity | 2.55 pg | 0.255 pg | No mention | No mention |
| Condition | 37–42 °C, isothermal | 50–98 °C, programmable temperature | 50–98 °C, programmable temperature | Room temperature |
| Assay time | 15 min | 60–90 min | 1–3 days | Unestimated |
| Personnel's skill | Normal | Professional | Professional | Professional & experienced |
| Specificity | S. carolinense (−) | S. carolinense (−) | S. carolinense (−) | S. carolinense (−) |
| S. rostratum (1000 times higher concentration, lower the LOQ, +) | S. rostratum (104 times higher concentration, +) | S. rostratum (−) | S. rostratum (−) | |
| S. torvum (−) | S. torvum (104 times higher concentration, +) | S. torvum (−) | S. torvum (−) | |
| S. nigrum (1000 times higher concentration, lower the LOQ, +) | S. nigrum (104 times higher concentration, +) | S. nigrum (−) | S. nigrum (−) | |
| Instrument | Cost-effective portable instrument | Expensive instrument containing programmable temperature control | Expensive instrument and long time | Microscope |
4. Conclusion
A fast identification of S. elaeagnifolium genomic DNA was achieved at a constant temperature at 39 °C within 1 h, which doesn't need complex instrument. Furthermore, commercial RPA reagents in vacuum-sealed pouches can tolerate temperatures up to room temperature for days without loss of activity, which is convenient and fitting for field performance of rapid point-of-care diagnostic tests. With the development of portable devices with a rechargeable battery and magnetic beads, e.g. T8, the RPA assay developed in this study could provide a useful and fast filed screening for S. elaeagnifolium seedlings or seeds. In conclusion, the RPA assay is a simple, fast and cost-effective method for field monitoring and detection of S. elaeagnifolium.Conflicts of interest
The authors declare no competing financial interest.Abbreviations
| GBSSI | Granule-bound starch synthase |
| RPA | Recombinase polymerase amplification |
| LAMP | Loop-mediated isothermal AMPlification |
| SSB | Single-stranded DNA-binding protein |
Acknowledgements
This work was supported by AQSIQ Science and Technology Project (2015IK322) and the Basic Scientific Research Foundation of the Chinese Academy of Inspection and Quarantine (2017JK036).References
- L. Bohs, in A festschrift for William G. D'Arcy: the legacy of a taxonomist, ed. R. C. Keating, V. C. Hollowell and T. B. Croat, Missouri Botanical Garden Press, St. Louis, 2005, pp. 27–49 Search PubMed.
- T. L. Weese and L. Bohs, Syst. Bot., 2007, 32, 445–463 CrossRef.
- Y. H. Wang, L. M. Xiang, X. M. Yi and X. J. He, J. Agric. Food Chem., 2017, 65, 4262–4272 CrossRef CAS PubMed.
- R. Stanton, H. W. Wu and D. Lemerle, Weed Sci., 2012, 60, 42–47 CrossRef CAS.
- R. Stanton, H. Wu and D. Lemerle, Plant Prot. Q., 2011, 26, 54–56 Search PubMed.
- J. Ripoll, M. C. Bon and W. Jones, Biotechnol., Agron., Soc. Environ., 2011, 15, 95–100 CAS.
- R. A. Levin, N. R. Myers and L. Bohs, Am. J. Bot., 2006, 93, 157–169 CrossRef CAS.
- C. Roche, Silverleaf Nightshade (Solanum Elaeagnifolium Cav.), PNW - Pacific Northwest Extension Publication, Cooperative Extension Service, Washington, Oregon, and Idaho State Universities, 1991 Search PubMed.
- A. S. Zernov and S. N. Mirzayeva, Wulfenia, 2016, 23, 253–256 Search PubMed.
- V. Vladimirov, S. Bancheva and M. Delcheva, Flora Mediterranea, 2016, 25, 121–125 Search PubMed.
- J. W. Boyd, D. S. Murray and R. J. Tyrl, Econ. Bot., 1984, 38, 210–217 CrossRef.
- J. D. Green, D. S. Murray and L. M. Verhalen, Weed Sci., 1987, 35, 813–818 Search PubMed.
- R. A. Stanton, J. W. Heap, R. J. Carter and H. Wu, in The biology of Australian weeds, ed. F. D. Panetta, RG&FJ Richardson, Meblbourne, 2009, vol. 3, pp. 274–293 Search PubMed.
- E. G. Cuthbertson, Agric. Gaz. N. S. W., 1976, 87, 11–13 Search PubMed.
- J. Thinakaran, E. Pierson, M. Kunta, J. E. Munyaneza, C. M. Rush and D. C. Henne, Plant Dis., 2015, 99, 910–915 CrossRef.
- S. Knapp, E. Sagona, A. K. Z. Carbonell and F. Chiarini, PhytoKeys, 2017, 1–104, DOI:10.3897/phytokeys.84.12695.
- S. Brunel, G. Schrader, G. Brundu and G. Fried, Bull. OEPP, 2010, 40, 219–238 CrossRef.
- W. Zhang, X. H. Fan, X. L. Shao, Y. F. Xiong and C. X. Li, Plant Quarantine, 2013, 27, 60–65 CAS.
- W. Zhang, X. H. Fan, S. F. Zhu, H. Zhao and L. Z. Fu, PLoS One, 2013, 8, e55927 CAS.
- F. Yin, J. Liu, A. Liu, Y. Li, J. Luo, G. Guan and H. Yin, Vet. Parasitol., 2017, 237, 125–129 CrossRef CAS PubMed.
- K. F. Wang, Y. Wu, D. Yin, S. X. Tang, G. F. Hu and Y. Q. He, Arch. Virol., 2017, 162, 287–290 CrossRef CAS PubMed.
- J. C. Wang, L. B. Liu, J. F. Wang, X. X. Sun and W. Z. Yuan, PLoS One, 2017, 12, e0166903 Search PubMed.
- Y. Yang, X. D. Qin, G. X. Wang, J. X. Jin, Y. J. Shang and Z. D. Zhang, Virol. J., 2016, 13, 46 CrossRef PubMed.
- S. Bhadra, Y. S. Jiang, M. R. Kumar, R. F. Johnson, L. E. Hensley and A. D. Ellington, PLoS One, 2015, 10, e0123126 Search PubMed.
- A. Abd El Wahed, P. Patel, O. Faye, S. Thaloengsok, D. Heidenreich, P. Matangkasombut, K. Manopwisedjaroen, A. Sakuntabhai, A. A. Sall, F. T. Hufert and M. Weidmann, PLoS One, 2015, 10, e0129682 Search PubMed.
- A. Abd El Wahed, A. El-Deeb, M. El-Tholoth, H. Abd El Kader, A. Ahmed, S. Hassan, B. Hoffmann, B. Haas, M. A. Shalaby, F. T. Hufert and M. Weidmann, PLoS One, 2013, 8, e71642 CAS.
- S. Santiago-Felipe, L. A. Tortajada-Genaro, R. Puchades and A. Maquieira, Anal. Chim. Acta, 2014, 811, 81–87 CrossRef CAS PubMed.
- L. Asensio, I. Gonzalez, M. A. Rodriguez, P. E. Hernandez, T. Garcia and R. Martin, J. Agric. Food Chem., 2004, 52, 4419–4422 CrossRef CAS PubMed.
- H. Aonuma, M. Suzuki, H. Iseki, N. Perera, B. Nelson, I. Igarashi, T. Yagi, H. Kanuka and S. Fukurnoto, Biochem. Biophys. Res. Commun., 2008, 376, 671–676 CrossRef CAS PubMed.
- Y. Mori, K. Nagamine, N. Tomita and T. Notomi, Biochem. Biophys. Res. Commun., 2001, 289, 150–154 CrossRef CAS PubMed.
- O. Piepenburg, C. H. Williams, D. L. Stemple and N. A. Armes, PLoS Biol., 2006, 4, 1115–1121 CAS.
- N. A. Armes and D. L. Stemple, US 08460875, 2013.
- H. M. Deng and Z. Q. Gao, Anal. Chim. Acta, 2015, 853, 30–45 CrossRef CAS PubMed.
- F. Y. Yin, J. L. Liu, A. H. Liu, Y. Q. Li, J. X. Luo, G. Q. Guan and H. Yin, Vet. Parasitol., 2017, 237, 125–129 CrossRef CAS PubMed.
- Y. Yang, X. D. Qin, Y. M. Song, W. Zhang, G. W. Hu, Y. X. Dou, Y. M. Li and Z. D. Zhang, Virol. J., 2017, 14, 24 CrossRef PubMed.
- A. Kunze, M. Dilcher, A. Abd El Wahed, F. Hufert, R. Niessner and M. Seidel, Anal. Chem., 2016, 88, 898–905 CrossRef CAS PubMed.
- H. Y. Lau, Y. L. Wang, E. J. H. Wee, J. R. Botella and M. Trau, Anal. Chem., 2016, 88, 8074–8081 CrossRef CAS PubMed.
Footnote |
| † Electronic supplementary information (ESI) available. See DOI: 10.1039/c7ra10781a |
| This journal is © The Royal Society of Chemistry 2017 |