 Open Access Article
Double-stranded DNA-scaffolded fluorescent probes for fluorescence imaging of cell-surface molecules†
Zhanghua Liu‡
ab,
Yang Liu‡ab,
Yanan Suna,
Guo Chenab and
Yong Chen *ab
*ab
aNanoscale Science and Technology Laboratory, Institute for Advanced Study, Nanchang University, Nanchang, Jiangxi 330031, P. R. China. E-mail: dr_yongchen@hotmail.com
bCollege of Life Sciences, Nanchang University, Nanchang, Jiangxi 330031, P. R. China
First published on 15th November 2017
Abstract
Double-stranded DNA-scaffolded fluorescent probes were developed for fluorescence imaging of molecules on cell surfaces. The probes contain double-stranded DNA of any desired length as a backbone which non-covalently or covalently conjugates with fluorescent dyes. The probes can be lab-made easily at low cost and stored for a very long time.
Introduction
Fluorescence or immunofluorescence imaging is a widely used method to detect the expression of specific molecules on/in cells. However, the main reagents/probes used during specimen preparation for fluorescence imaging are generally commercial and relatively expensive and have a relatively short-term storage period (approximately one year in liquid at −20 °C or even less particularly for proteins). Moreover, after conjugating with fluorescent dyes the reagents become much more expensive commercially.Double-stranded DNA (dsDNA) fragments have many advantages as the backbone loading fluorescent dyes: (a) biotinylated DNA or antibody-conjugated DNA can be synthesized easily in a laboratory; (b) DNA fragments of any desired length can be produced readily in a large number via the polymerase chain reaction (PCR); (c) DNA fragments of various lengths can load different amounts of fluorescent dyes non-covalently or covalently; (d) all raw materials for DNA synthesis/amplification are very cheap; (e) DNA fragments in liquids are very stable and can be stored for a very long time at −20 °C.
Presently, by using single-stranded DNA (ssDNA), many DNA-assisted protein detection techniques1 have been developed to detect the presence, identity, location and interaction of proteins via PCR, rolling-circle amplification (RCA), microarray hybridization, and high-throughput parallel sequencing methods. However, dsDNA-scaffolded fluorescent probes for fluorescently detection/imaging of cell-surface molecules were not reported previously. In this study, we intend to test the possibility of recruiting dsDNA as the backbone of dsDNA-scaffolded fluorescent probes for fluorescence imaging of specific molecules in the plasma membrane of cells. Generally, biotin–streptavidin (SA), antigen–antibody, ligand–receptor, and other interactions are utilized to specifically detect cell-surface molecules during fluorescence or immunofluorescence imaging. Here, the biotin–SA interaction was tested via conjugating biotin to dsDNA-scaffolded fluorescent probes.
Experimental section
Materials
Streptavidin-coated silica beads were purchased from Bangs Laboratories, Inc. (Indiana, USA). SYBR Green I, streptavidin, paraformaldehyde, and glutaraldehyde were from Solarbio Science & Technology Co. (Shanghai, China). Streptavidin-conjugated Alexa Fluor 555 and streptavidin-conjugated Qdot 525 were from Life Technology. N-((6-(biotinoyl)amino)hexanoyl)-1,2-dihexadecanoyl-sn-glycero-3-phosphoethanolamine (DHPE-biotin), biotin-conjugated fluorescein isothiocyanate (FITC-biotin), and biotin-conjugated cholera toxin subunit B (CTB-biotin) were from Invitrogen (Thermo Fisher, Massachusetts, USA).Cells, cell isolation, and cell culture
Human red blood cells (RBCs) were prepared from blood drawn from a healthy volunteer donor (a graduate student in our lab). Rabbit red blood cells were from a commercial rabbit (Oryctolagus cuniculus). The blood was collected in a tube containing potassium EDTA as an anticoagulant. The blood was mixed with an equal volume of normal saline and centrifuged at 2000 rpm for 5 min. The cell pellets were washed with Hank's solution containing no Ca2+ and Mg2+ (Thermo Fisher, Massachusetts, USA) and centrifuged at 2000 rpm for 5 min. The cell pellets were suspended in Alsever's solution (100 mM glucose, 30 mM sodium citrate, 3 mM citric acid, 70 mM NaCl in double distilled water; pH 6.1) and stored at 4 °C and used within several days. Ethics approval for the study was obtained from the Nanchang University Health Research Ethics Board and the blood sample collection from live subjects was performed in full compliance with the National Institute of Health (NIH) Guide for human/animal Care and Use of Laboratory Animals.Human umbilical vein endothelial cells (HUVECs), purchased from Xiangya Central Experiment Laboratory (Hunan, China), were routinely cultured in RPMI 1640 medium (Gibco) supplemented with 10% (w/v) fetal bovine serum (FBS), 100 U ml−1 penicillin, and 100 μg ml−1 streptomycin. All cells were cultivated at 37 °C in a 5% CO2 incubator and used for experiments at passage ∼5.
DH5α E. coli bacteria, purchased from TIANGEN Biotech Co., Ltd. (Beijing, China), were grown in standard Luria–Bertani (LB) broth supplemented with 50 μg ml−1 chloramphenicol at 37 °C.
Preparation and validation of biotinylated dsDNA fragments of different lengths
Five types of biotinylated dsDNA fragments with different lengths (Table 1) were prepared including 148-basepair, 1024-basepair, 1597-basepair, and 3419-basepair 5′-biotinylated dsDNA fragments (for simplicity in the text, they were called 150 bp, 1 kb, 1.6 kb, and 3.4 kb biotin-DNA, respectively) as well as 1597-basepair 5′-biotinylated, 3′-ROX-conjugated dsDNA fragment (abbreviated as 1.6 kb biotin-DNA-ROX in the text).| Name | Primer sequences |
|---|---|
| 150 bp biotin-DNA (148 bp) | Upper primer: biotin-5′-TAAGCGTTGGCGGAGCGTCGGT-3′ |
| Lower primer: 5′-CGCCGATTTGGTTGCCGCACT-3′ | |
| 1 kb biotin-DNA (1024 bp) | Upper primer: biotin-5′-TAAGCGTTGGCGGAGCGTCGGT-3′ |
| Lower primer: 5′-CGCAGGCAGCCATCATGTTCTT-3′ | |
| 1.6 kb biotin-DNA (1597 bp) | Upper primer: biotin-5′-AGAGTTTGATCCTGGCTCAG-3′ |
| Lower primer: 5′-GGTTACCTTGTTACGACTT-3′ | |
| 3.4 kb biotin-DNA (3419 bp) | Upper primer: biotin-5′-GCTAAAAGGACAGGCAATGGAC-3′ |
| Lower primer: 5′-GTCCTGTTCTCTCGGGGGTCC-3′ | |
| 1.6 kb biotin-DNA-ROX (1597 bp) | Upper primer: biotin-5′-AGAGTTTGATCCTGGCTCAG-3′ |
| Lower primer: 5′-GGTTACCTTGTTACGACTT-3′-ROX |
The template for 150 bp or 1 kb biotin-DNA synthesis was the cDNA derived from the mRNA of human tubulin beta 4B class IVb (TUBB4B) in HUVECs. The total RNA was extracted from HUVECs using E.Z.N.A. Total RNA Kit II (Omega, USA) according to the manufacturer's instruction. The corresponding cDNA of TUBB4B was synthesized using TransScript First-Strand cDNA synthesis SuperMix Kit (TransGen Biotech Co., Ltd., Beijing, China) via RT-PCR according to the manufacturer's instruction. The template for 1.6 kb biotin-DNA or biotin-DNA-ROX synthesis was bacterial 16S rDNA from DH5α E. coli. The template for 3.4 kb biotin-DNA synthesis was the genomic DNA encoding human crystalline alpha A (CRYAA) in HUVECs. The genome of HUVECs was extracted via a universal Genomic DNA kit (Beijing ComWin Biotech Co., Beijing, China).
The biotin-DNA fragments were produced by polymerase chain reaction (PCR) amplification. The 5′-biotinylated primers (Table 1) were designed via OLIGO 6.70 software and synthesized by Invitrogen. The PCR reaction system was shown in Table 2. The reaction consisted of 35 cycles at 94 °C for 30 s, 50 °C for 30 s, and 72 °C for 5 min. The biotinylated dsDNA fragments were purified using a TIANquick Midi Purification Kit (TIANGEN Biotech Co., Ltd., Beijing, China). The dsDNA quantity was estimated by Nanodrop 2000 (Thermo Fisher, Massachusetts, USA). The dsDNA fragments of different lengths were identified via electrophoresis on a 1% agarose gel and visualized by using ethidium bromide (EB).
| Reagents | Volume |
|---|---|
| a The template DNA for the synthesis of 150 bp or 1 kb biotin-DNA fragments was the cDNA derived from the mRNA of TUBB4B in HUVECs; the template DNA for the synthesis of 3.4 kb biotin-DNA fragments was the genomic DNA encoding CRYAA in HUVECs; the template DNA for the synthesis of 1.6 kb biotin-DNA or biotin-DNA-ROX fragments was the 16S rDNA of DH5α E. coli.b Takara MgCl2 or Takara PCR buffer was used for the synthesis of 150 bp, 1 kb, and 3.4 kb biotin-DNA fragments.c rTaq was used for the synthesis of 1.6 kb biotin-DNA fragments. | |
| Upper primer (10 μM) | 1 μl |
| Lower primer (10 μM) | 1 μl |
| dNTP (2.5 mM each) | 1 μl |
| Template DNAa (100 mg l−1) | 1 μl |
| MgCl2b (25 mM) | 4 μl |
| 10 × PCR bufferb | 5 μl |
| Taq or rTaqc (5 U μl−1) | 1 μl |
| ddH2O | 36 μl |
| Total | 50 μl |
Gel-shift assay of DNA-streptavidin complexes via agarose gel electrophoresis
DNA–streptavidin complexes were prepared by adding 5 μl of 440 nM biotinylated dsDNA fragments in MilliQ pure water to 2.2 μl of 1 mM streptavidin in PBS (pH 7.4), and the total volume was adjusted to 25 μl with PBS. The final dsDNA concentration was kept constant at 88 nM and the molar ratio of dsDNA to streptavidin (abbreviated as D![[thin space (1/6-em)]](https://www.rsc.org/images/entities/char_2009.gif) :
:![[thin space (1/6-em)]](https://www.rsc.org/images/entities/char_2009.gif) S) was in the range from 8
S) was in the range from 8![[thin space (1/6-em)]](https://www.rsc.org/images/entities/char_2009.gif) :
:![[thin space (1/6-em)]](https://www.rsc.org/images/entities/char_2009.gif) 1 to 1
1 to 1![[thin space (1/6-em)]](https://www.rsc.org/images/entities/char_2009.gif) :
:![[thin space (1/6-em)]](https://www.rsc.org/images/entities/char_2009.gif) 16. After incubation at 37 °C for 30 min, the reaction solution was analyzed by electrophoresis on a 1.5% agarose gel and subsequent EB staining.
16. After incubation at 37 °C for 30 min, the reaction solution was analyzed by electrophoresis on a 1.5% agarose gel and subsequent EB staining.
Fluorescence imaging and fluorescence intensity quantification of the dsDNA-scaffolded fluorescent probe on streptavidin-coated silica beads
Prior to incubation with the dsDNA-scaffolded fluorescent probe, the size and uniformity of streptavidin-coated silica beads were determined by LSM710 confocal microscopy (Carl Zeiss, Oberkochen, Germany) and environmental scanning electron microscopy (Quanta 200F, FEI Co., United Kingdom).For fluorescence imaging and intensity quantification of the biotinylated dsDNA-scaffolded fluorescent probe on streptavidin-coated silica beads, streptavidin-coated silica beads (∼1 × 10⁶ beads per ml) were added in 500 μl biotin–streptavidin binding buffer (10 mM Tris–HCl, 1 mM EDTA, and 2 M NaCl in double distilled water), centrifuged twice at 1000 rpm for 2 min, re-added in 500 μl biotin–streptavidin binding buffer, and incubated with biotinylated dsDNA fragments (biotin-DNA or biotin-DNA-ROX) and SYBR Green I at 37 °C for 1 h. After washing with double distilled water twice, the beads labeled with the biotinylated dsDNA-scaffolded, SYBR Green I-loaded fluorescent probe were suspended in 1 ml PBS. For fluorescence imaging, the samples were transferred into Petri dishes and observed under confocal microscopy. For fluorescence intensity quantification, the samples were detected with BD FACSCalibur flow cytometry (BD Biosciences, San Jose, Canada).
Fluorescence imaging of dsDNA-scaffolded fluorescent probe on cells
Red blood cells were fixed with 2.5% glutaraldehyde at room temperature for 30 min and centrifuged at 1000 rpm for 5 min. After washing with PBS twice, the cells were suspended in staining blocking buffer (2% BSA in PBS) and incubated at 37 °C for 1 h. After removing the blocking buffer by centrifugation at 1000 rpm for 5 min, the cells were incubated with DHPE-biotin for rabbit red blood cells or CTB-biotin for human red blood cells or PBS as blank control 1 at 37 °C for 1 h. After washing twice with biotin–streptavidin binding buffer, the cells were incubated with streptavidin at 37 °C for 2 h, washed with biotin–streptavidin binding buffer, incubated with SYBR Green I as blank control 2 or with biotinylated dsDNA fragments plus SYBR Green I at 37 °C for 1 h (for positive controls, after washing twice with biotin–streptavidin binding buffer, the cells were incubated with streptavidin-conjugated Alexa Fluor 555 for rabbit red blood cells or streptavidin-conjugated Qdot 525 for human red blood cells at 37 °C for 2 h). After washing twice with PBS, the cells were observed under confocal microscopy.HUVECs grown in a Petri dish were gently rinsed with PBS and fixed with 4% formaldehyde at room temperature for 30 min. After rinsing twice with PBS, the cells were incubated with staining blocking buffer at 37 °C for 1 h and rinsed twice with PBS. The cells were incubated with biotin-DNA-ROX fragments as a blank control or with CTB-biotin at 37 °C for 1 h. After rinsing twice with biotin–streptavidin binding buffer, the cells labeled with CTB-biotin were incubated with streptavidin-conjugated Alexa Fluor 555 as a positive control or with streptavidin at 37 °C for 2 h. After rinsing twice with PBS, the cells labeled with streptavidin were stained with the biotin-DNA-ROX fluorescent probe at 37 °C for 1 h. Finally, all cell samples were rinsed twice with PBS and observed under confocal microscopy.
Results and discussion
The dsDNA fragments of any desired lengths can be synthesized. The template for dsDNA synthesis can be genomic DNA or mRNA-derived cDNA from eukaryotic cells or prokaryotic cells depending on the desired length of dsDNA. Here, we synthesized biotinylated dsDNA fragments (biotin-DNA) of different lengths including ∼150 bp, ∼1 kb, ∼1.6 kb, and ∼3.4 kb. The 5′-biotinylated primers for biotin-DNA synthesis (see ESI† and Table 1) were commercially synthesized at low cost. The template DNA for 150 bp or 1 kb biotin-DNA synthesis was the cDNA derived from the mRNA of tubulin beta 4B class IVb (TUBB4B) in human umbilical vein endothelial cells (HUVECs); the template DNA for 1.6 kb biotin-DNA synthesis was the 16S rDNA of DH5α E. coli; the template DNA for 3.4 kb biotin-DNA synthesis was the genomic DNA encoding crystalline alpha A (CRYAA) in HUVECs (see ESI† and Table 2). The synthesized biotin-DNA fragments of various lengths were validated via agarose gel electrophoresis (Fig. 1).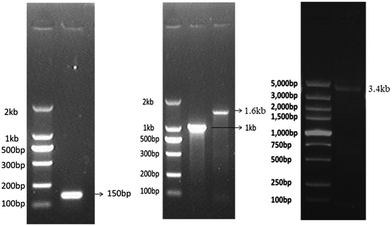 | ||
| Fig. 1 Identification of biotinylated dsDNA fragments of different lengths detected by agarose gel electrophoresis. | ||
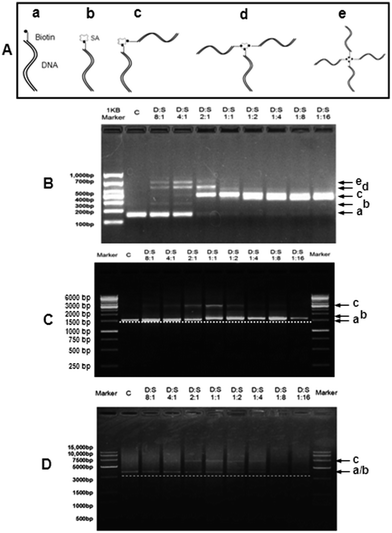
Since one SA molecule has four potential binding sites of biotin,2 it is necessary to determine the binding pattern of biotin-DNA fragments of various lengths with SA. In Fig. 2A, status a is a biotin-DNA strand whereas statuses (b–e) represent one SA molecule conjugated with one, two, three, and four biotin-DNA strands, respectively. Fig. 2B–D shows the SA-binding patterns of 150 bp, 1.6 kb, and 3.4 kb biotin-DNA fragments, respectively. For 150 bp biotin-DNA (Fig. 2B), when the molar ratio of biotin-DNA to SA (D![[thin space (1/6-em)]](https://www.rsc.org/images/entities/char_2009.gif) :
:![[thin space (1/6-em)]](https://www.rsc.org/images/entities/char_2009.gif) S) was 8
S) was 8![[thin space (1/6-em)]](https://www.rsc.org/images/entities/char_2009.gif) :
:![[thin space (1/6-em)]](https://www.rsc.org/images/entities/char_2009.gif) 1 or 4
1 or 4![[thin space (1/6-em)]](https://www.rsc.org/images/entities/char_2009.gif) :
:![[thin space (1/6-em)]](https://www.rsc.org/images/entities/char_2009.gif) 1, statuses a–e were concurrent; when D
1, statuses a–e were concurrent; when D![[thin space (1/6-em)]](https://www.rsc.org/images/entities/char_2009.gif) :
:![[thin space (1/6-em)]](https://www.rsc.org/images/entities/char_2009.gif) S was 2
S was 2![[thin space (1/6-em)]](https://www.rsc.org/images/entities/char_2009.gif) :
:![[thin space (1/6-em)]](https://www.rsc.org/images/entities/char_2009.gif) 1, statuses (c & d) predominated (i.e. one SA conjugates with two or three biotin-DNA strands); when D
1, statuses (c & d) predominated (i.e. one SA conjugates with two or three biotin-DNA strands); when D![[thin space (1/6-em)]](https://www.rsc.org/images/entities/char_2009.gif) :
:![[thin space (1/6-em)]](https://www.rsc.org/images/entities/char_2009.gif) S was 1
S was 1![[thin space (1/6-em)]](https://www.rsc.org/images/entities/char_2009.gif) :
:![[thin space (1/6-em)]](https://www.rsc.org/images/entities/char_2009.gif) 1 to 1
1 to 1![[thin space (1/6-em)]](https://www.rsc.org/images/entities/char_2009.gif) :
:![[thin space (1/6-em)]](https://www.rsc.org/images/entities/char_2009.gif) 16, only status (c) existed (i.e. one SA conjugates with two biotin-DNA strands). For 1.6 kb biotin-DNA (Fig. 2C), when D
16, only status (c) existed (i.e. one SA conjugates with two biotin-DNA strands). For 1.6 kb biotin-DNA (Fig. 2C), when D![[thin space (1/6-em)]](https://www.rsc.org/images/entities/char_2009.gif) :
:![[thin space (1/6-em)]](https://www.rsc.org/images/entities/char_2009.gif) S was 8
S was 8![[thin space (1/6-em)]](https://www.rsc.org/images/entities/char_2009.gif) :
:![[thin space (1/6-em)]](https://www.rsc.org/images/entities/char_2009.gif) 1 to 2
1 to 2![[thin space (1/6-em)]](https://www.rsc.org/images/entities/char_2009.gif) :
:![[thin space (1/6-em)]](https://www.rsc.org/images/entities/char_2009.gif) 1, statuses (a & c) occurred (i.e. one SA conjugates with two biotin-DNA strands); when D
1, statuses (a & c) occurred (i.e. one SA conjugates with two biotin-DNA strands); when D![[thin space (1/6-em)]](https://www.rsc.org/images/entities/char_2009.gif) :
:![[thin space (1/6-em)]](https://www.rsc.org/images/entities/char_2009.gif) S was 1
S was 1![[thin space (1/6-em)]](https://www.rsc.org/images/entities/char_2009.gif) :
:![[thin space (1/6-em)]](https://www.rsc.org/images/entities/char_2009.gif) 1 or 1
1 or 1![[thin space (1/6-em)]](https://www.rsc.org/images/entities/char_2009.gif) :
:![[thin space (1/6-em)]](https://www.rsc.org/images/entities/char_2009.gif) 2, statuses (b & c) occurred simultaneously (i.e. one SA conjugates with ≤2 biotin-DNA strands); when D
2, statuses (b & c) occurred simultaneously (i.e. one SA conjugates with ≤2 biotin-DNA strands); when D![[thin space (1/6-em)]](https://www.rsc.org/images/entities/char_2009.gif) :
:![[thin space (1/6-em)]](https://www.rsc.org/images/entities/char_2009.gif) S was 1
S was 1![[thin space (1/6-em)]](https://www.rsc.org/images/entities/char_2009.gif) :
:![[thin space (1/6-em)]](https://www.rsc.org/images/entities/char_2009.gif) 4 to 1
4 to 1![[thin space (1/6-em)]](https://www.rsc.org/images/entities/char_2009.gif) :
:![[thin space (1/6-em)]](https://www.rsc.org/images/entities/char_2009.gif) 16, only status (b) appeared (i.e. one SA conjugates with only one biotin-DNA strand). The SA-binding pattern of 3.4 kb biotin-DNA was similar to that of 1.6 kb biotin-DNA (Fig. 2D). For 3.4 kb biotin-DNA, however, SA conjugated with one biotin-DNA could not be separated on gel from biotin-DNA itself because the molecular weight of 3.4 kb biotin-DNA is far greater than that of SA (an equivalent of ∼100 bp).
16, only status (b) appeared (i.e. one SA conjugates with only one biotin-DNA strand). The SA-binding pattern of 3.4 kb biotin-DNA was similar to that of 1.6 kb biotin-DNA (Fig. 2D). For 3.4 kb biotin-DNA, however, SA conjugated with one biotin-DNA could not be separated on gel from biotin-DNA itself because the molecular weight of 3.4 kb biotin-DNA is far greater than that of SA (an equivalent of ∼100 bp).
The data from gel-shift assay of DNA–SA complexes show that one SA can bind ≥1 biotin-DNA at almost all D![[thin space (1/6-em)]](https://www.rsc.org/images/entities/char_2009.gif) :
:![[thin space (1/6-em)]](https://www.rsc.org/images/entities/char_2009.gif) S molar ratios although the length of biotin-DNA may influence the SA-binding patterns which is coincident with previous studies.3 Currently, it is unclear why the length of biotin-DNA influences its number binding to SA. It is possible that relatively long DNA strand might have a steric hindrance effect2,4 on the biotin-binding sites of SA. In the following studies, 150 bp or 1.6 kb DNA fragments were recruited.
S molar ratios although the length of biotin-DNA may influence the SA-binding patterns which is coincident with previous studies.3 Currently, it is unclear why the length of biotin-DNA influences its number binding to SA. It is possible that relatively long DNA strand might have a steric hindrance effect2,4 on the biotin-binding sites of SA. In the following studies, 150 bp or 1.6 kb DNA fragments were recruited.
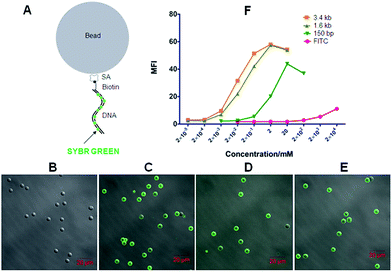
Double-stranded DNA-scaffolded fluorescent probes were composed of double-stranded DNA fragments as a backbone and non-covalently or covalently loaded fluorescent dyes. The dsDNA-scaffolded, SYBR Green-labelled fluorescent probe was first tested here (Fig. 3A). SYBR Green, a family of cyanine dye including SYBR Green I widely used for DNA quantification in some methods of quantitative PCR and for the visualization of DNA in gel electrophoresis, can preferentially non-covalently bind to double-stranded DNA.5
Next, we utilized the biotinylated dsDNA-scaffolded, SYBR Green I-loaded fluorescent probe to detect streptavidin molecules coated on silica beads with a diameter of ∼5 μm as a simple model mimicking individual cells. When DNA fragments were conjugated without biotin but labelled with SYBR Green I, no fluorescence was detected on SA-coated silica beads (Fig. 3B) whereas biotinylated DNA fragments of various lengths labelled with SYBR Green I were fluorescently imaged on SA-coated beads by confocal microscopy (Fig. 3C–E), implying that the biotinylated dsDNA-scaffolded, SYBR Green-loaded fluorescent probe can specifically bind to SA molecules coated on beads. Flow cytometric data (Fig. 3F) further indicates that the mean fluorescence intensity (MFI) of the dsDNA-scaffolded, SYBR Green-labelled fluorescent probe is stronger than that of biotin-FITC (a widely used fluorescein in confocal microscopy and flow cytometry) and that the MFI of the long biotin-DNA is stronger than that of the short biotin-DNA because one longer biotin-DNA can probably label much more SYBR Green molecules.
Here, confocal microscopy did not observe a significant increase in size of fluorescent beads with the length of labelled DNA fragment increasing (e.g. from 150 bp to 3.4 kb). There were probably two reasons: (a) when labelling on the beads the linear DNA molecules could not straightly protrude out of the bead surface like a stick (but convolute on the surface); (b) the confocal microscopy used here was unable to detect the difference (the layer of the longest DNA coated on beads is probably less than 300 nm thicker than that of the shortest DNA) due to relatively low resolution (∼200–300 nm).
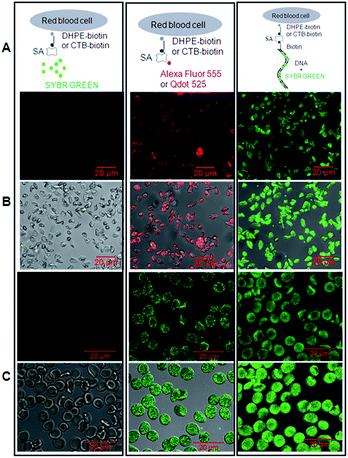
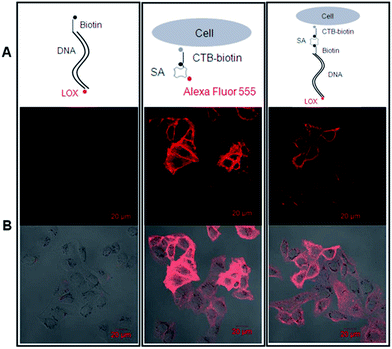
Subsequently, we sought to test whether the dsDNA-scaffolded fluorescent probe can be used to fluorescently detect molecules in the plasma membrane of unnucleated cells such as red blood cells (RBCs) via confocal microscopy (Fig. 4A). Here, two molecules were tested including phosphatidylethanolamine (PE) and ganglioside GM1. Biotinylated PE was exogenously inserted in the plasma membrane of RBCs whereas GM1 generally pre-exists in the plasma membrane of both unnucleated (e.g. RBCs6) and nucleated cells (e.g. endothelial cells7). GM1 has many important physiological (e.g., as the major component/marker of the well-known lipid rafts which are specialized membrane microdomains serving as a dynamic platform for cell signalling and have generated a tremendous amount of interest and attention in the past 20 years8) and pathological properties (e.g., as the cell-surface receptor for cholera toxin produced by the bacteria Vibrio cholerae9).
The data showed that the biotinylated dsDNA-scaffolded, SYBR Green-labelled fluorescent probe could specifically recognize PE molecules in the plasma membrane of rabbit RBCs (Fig. 4B) and GM1 molecules in the plasma membrane of human RBCs (Fig. 4C) with similar fluorescence strength to Alexa Fluor 555 and Qdot 525 (two widely used fluorescent dyes with relatively high fluorescence strength).
Unfortunately, further study on the dsDNA-scaffolded, SYBR Green-labelled fluorescent probe for fluorescence imaging of molecules on nucleated cells failed due to the plasma membrane penetration and nuclear staining of free SYBR Green I molecules (data not shown). Non-covalently labelling of another fluorescent dye which is not able to penetrate the plasma membrane of cells probably can solve this problem.
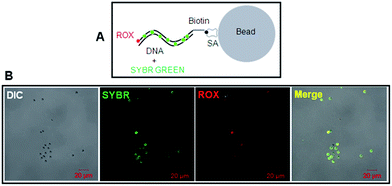
Alternatively, the dsDNA-scaffolded fluorescent probe covalently pre-conjugated with a fluorescent dye is potentially another strategy to solve this problem. To test this possibility, we recruited a biotinylated dsDNA-scaffolded, 6-carboxy-X-rhodamine (ROX)-labelled fluorescent probe (biotin-DNA-ROX) which was covalently pre-conjugated with biotin at one end and with ROX (a widely used fluorescent dye for real-time quantitative PCR or PR-PCR10) at the other terminus (Table 1).
To test the biotin-DNA-ROX fluorescent probe on SA-coated silica beads, SYBR Green I was also used to non-covalently stain the DNA in dual colors (red for ROX and green for SYBR Green I; Fig. 5A). It is clear evident that the DNA-scaffolded, ROX-labelled fluorescent probe also can detect streptavidin molecules coated on silica beads although the fluorescence strength of ROX is a little weaker than that of SYBR Green (Fig. 5B) probably due to different molecular number of fluorescent dyes labelled on a DNA strand (only one ROX molecule and many SYBR Green molecules, respectively).
Then, we tested whether the dsDNA-scaffolded, ROX-labelled fluorescent probe can be applied for fluorescence imaging of specific molecules in the plasma membrane of nucleated cells. The confocal microscopic data showed that the dsDNA-scaffolded, ROX-labelled fluorescent probe can specifically recognize GM1 molecules in the plasma membrane of human umbilical vein endothelial cells (HUVECs) with the fluorescence strength close to Alexa Fluor 555 (Fig. 6).
Here, dsDNA-scaffolded fluorescent probes labelled non-covalently with SYBR Green I and covalently with ROX were tested. In fact, many choices of similar fluorescent dyes are available such as EVA Green,11 PicoGreen,12 YOYO and others13 for non-covalent conjugation selectively to dsDNA and 5-carboxyfluorescein (FAM), 2′,7′-dimethoxy-4′,5′-dichloro-6-carboxyfluorescein (JOE), N,N,N′,N′-tetramethyl-6-carboxyrhodamine (TAMRA), among others for covalent conjugation.14
As the backbone of the probes, dsDNA fragments can be synthesized at any desired length and therefore loaded with different amount of fluorescent dyes (e.g. the binding events of SYBR Green I to dsDNA fragments depend on the dye/base pair ratios15). In another word, the fluorescence strength of the dsDNA-scaffolded fluorescent probes is adjustable by changing the length of the dsDNA backbone (Fig. 3F) besides using dyes of different fluorescence strengths. Unfortunately, at present we only could synthesize biotin-DNA-ROX covalently labelling one ROX molecule. Therefore, the fluorescence strength of the biotin-DNA-ROX is unable to be adjusted by changing the length of the dsDNA backbone. More in-depth studies will be needed to covalently label multiple fluorescent dye molecules (e.g. ROX) simultaneously on the dsDNA backbone. However, the biotin-DNA-ROX still has the advantages as described in the following paragraph.
Except for the biotin- or fluorescent dye (e.g. ROX)-conjugated primers (for PCR reaction) which are generally synthesized commercially, almost the whole procedure for the preparation of dsDNA-scaffolded fluorescent probes can be easily done in a basic biology laboratory. The biotin- or fluorescent dye-conjugated primers and dsDNA-scaffolded fluorescent probes are generally very stable and can be stored for years (e.g. up to 7 years16). Moreover, the primers and the materials for the synthesis of dsDNA-scaffolded fluorescent probes are pretty low-cost.
In this study, biotinylated dsDNA-scaffolded fluorescent probes were tested to specifically detect cell-surface molecules via biotin–streptavidin interaction. Although not tested, protein/antibody-conjugated dsDNA-scaffolded fluorescent probes may potentially work via antigen–antibody or ligand–receptor interaction. Actually, the techniques for protein/antibody-dsDNA conjugation17 are quite mature currently. Anyway, by combining dsDNA fragments with traditional fluorescent dyes, our study provides a novel, simple strategy for fluorescence imaging of cell-surface molecules.
Conclusions
In this study, our data proved that dsDNA-scaffolded fluorescent probes non-covalently or covalently labelled with specific fluorescent dyes (e.g. SYBR Green and ROX, respectively) can be used for fluorescence imaging of specific molecules in the plasma membrane of unnucleated or nucleated cells. The dsDNA backbone can be biotinylated or protein/antibody-conjugated. The fluorescence strength of the probes is adjustable by using a dsDNA backbone of certain length. The probes can be made easily at low cost in a basic biological laboratory and stored for a very long term.Conflicts of interest
There are no conflicts of interest to declare.Acknowledgements
This work was supported by the National Natural Science Foundation of China (No. 81560083 and No. 31760320) and the Natural Science Foundation of Jiangxi Province of China (No. 20151BBG70035 and No. 20161ACB20001).References
- R. Y. Nong, J. J. Gu, S. Darmanis, M. Kamali-Moghaddam and U. Landegren, Expert Rev. Proteomics, 2012, 9, 21 CrossRef CAS PubMed.
- N. M. Green, Methods Enzymol., 1990, 184, 51 CAS.
- (a) G. H. Seong, Y. Yanagida, M. Aizawa and E. Kobatake, Anal. Biochem., 2002, 309, 241 CrossRef CAS PubMed; (b) A. Buxboim, S. S. Daube and R. Bar-Ziv, Nano Lett., 2009, 9, 909 CrossRef CAS PubMed.
- C. S. Neish, I. L. Martin, R. M. Henderson and J. M. Edwardson, Br. J. Pharmacol., 2002, 135, 1943 CrossRef CAS PubMed.
- (a) A. E. Kiltie and A. J. Ryan, Nucleic Acids Res., 1997, 25, 2945 CrossRef CAS PubMed; (b) A. Karsai, S. Muller, S. Platz and M. T. Hauser, BioTechniques, 2002, 32, 790 CAS.
- (a) H. Hagerstrand, L. Mrowczynska, U. Salzer, R. Prohaska, K. A. Michelsen, V. Kralj-Iglic and A. Iglic, Mol. Membr. Biol., 2006, 23, 277 CrossRef PubMed; (b) I. Mikhalyov and A. Samsonov, Biochim. Biophys. Acta, Biomembr., 2011, 1808, 1930 CrossRef CAS PubMed.
- (a) T. Kanda, T. Ariga, H. Kubodera, H. L. Jin, K. Owada, T. Kasama, M. Yamawaki and H. Mizusawa, J. Neurosci. Res., 2004, 78, 141 CrossRef CAS PubMed; (b) Q. S. Tang, X. J. Zhang, W. D. A. Zhang, S. Y. Zhao and Y. Chen, Biochim. Biophys. Acta, Biomembr., 2017, 1859, 756 CrossRef CAS PubMed; (c) L. Wu, J. Huang, X. X. Yu, X. Q. Zhou, C. Y. Gan, M. Li and Y. Chen, J. Membr. Biol., 2014, 247, 189 CrossRef CAS PubMed.
- (a) M. Carquin, L. D'Auria, H. Pollet, E. R. Bongarzone and D. Tyteca, Prog. Lipid Res., 2016, 62, 1 CrossRef CAS PubMed; (b) E. Sezgin, I. Levental, S. Mayor and C. Eggeling, Nat. Rev. Mol. Cell Biol., 2017, 18, 361 CrossRef CAS PubMed; (c) Y. Chen, J. Qin, J. Y. Cai and Z. W. Chen, PLoS One, 2009, 4, e5386 Search PubMed.
- H. R. Sinclair, J. de Slegte, G. R. Gibson and R. A. Rastall, J. Agric. Food Chem., 2009, 57, 3113 CrossRef CAS PubMed.
- (a) G. H. Wang, E. Becker and C. Mesa, Can. J. Microbiol., 2007, 53, 391 CrossRef CAS PubMed; (b) Y. You, A. V. Tataurov and R. Owczarzy, Biopolymers, 2011, 95, 472 CrossRef CAS PubMed.
- Z. Hu, C. Zhu, H. Chang, W. Guo, D. Q. Liu, W. H. Xiang and X. J. Wang, Appl. Microbiol. Biotechnol., 2014, 98, 4179 CrossRef CAS PubMed.
- V. L. Singer, L. J. Jones, S. T. Yue and R. P. Haugland, Anal. Biochem., 1997, 249, 228 CrossRef CAS PubMed.
- S. Gurrieri, K. S. Wells, I. D. Johnson and C. Bustamante, Anal. Biochem., 1997, 249, 44 CrossRef CAS PubMed.
- P. J. Oefner, C. G. Huber, F. Umlauft, G. N. Berti, E. Stimpfl and G. K. Bonn, Anal. Biochem., 1994, 223, 39 CrossRef CAS PubMed.
- H. Zipper, H. Brunner, J. Bernhagen and F. Vitzthum, Nucleic Acids Res., 2004, 32, e103 CrossRef PubMed.
- L. Madisen, D. I. Hoar, C. D. Holroyd, M. Crisp and M. E. Hodes, Am. J. Med. Genet., 1987, 27, 379 CrossRef CAS PubMed.
- (a) C. M. Niemeyer, Trends Biotechnol., 2002, 20, 395 CrossRef CAS PubMed; (b) J. A. G. L. van Buggenum, J. P. Gerlach, S. Eising, L. Schoonen, R. A. P. M. van Eijl, S. E. J. Tanis, M. Hogeweg, N. C. H. J. C. Van Hest, J. C. van Hest, K. M. Bonger and K. W. Mulder, Sci. Rep., 2016, 6, 22675 CrossRef CAS PubMed.
Footnotes |
| † Electronic supplementary information (ESI) available. See DOI: 10.1039/c7ra09869c |
| ‡ The authors contributed equally to this study. |
| This journal is © The Royal Society of Chemistry 2017 |

