 Open Access Article
Formation of oxygenated polycyclic aromatic hydrocarbons by photoelectrocatalysis using TiO2 nanotubes†
Meng Qiao a,
Bochuan Liua,
Xu Zhao*ab,
Yan Gonga,
Yanbin Wanga and
Wei Caoa
aKey Laboratory of Drinking Water Science and Technology, Research Center for Eco-Environmental Sciences, Chinese Academy of Sciences, Beijing 100085, China. E-mail: zhaoxu@rcees.ac.cn; Tel: +86 10 62849667
bUniversity of Chinese Academy of Sciences, Beijing 100049, China
First published on 7th November 2017
Abstract
The transformation intermediates of the polycyclic aromatic hydrocarbons (PAHs), including the oxygenated PAHs in photoelectrocatalytic (PEC) processes has seldom been reported. In this study, anthracene (Ant), a typical PAH, was selected as the target compound. The main transformation intermediates including anthranone (AT) and anthraquinone (AQ) were analyzed in a PEC process using TiO2 nanotubes (TNTs) as a photoanode with simulated solar light irradiation and a bias potential. AT and AQ were demonstrated to be formed from Ant in the PEC process. However, the elimination of AT and AQ was hardly observed when Ant was mostly eliminated. The PEC process efficiently enhanced the elimination of Ant, as well as the total molar concentration of Ant, AT and AQ, compared with the photocatalysis and electrochemical oxidation process. The PEC process achieved a best elimination efficiency at 1.0 V bias and pH 2.0. The elimination efficiency decreased with the increase of the Ant initial concentration. The effect of humic acid was explored. It was concluded that the ˙O2− radical was more effective than ˙OH for the transformation of Ant to AT and AQ. Furthermore, compared with the UV light photocatalysis (PC), the PEC process could save much energy in the aspect of Ant elimination.
1. Introduction
Polycyclic aromatic hydrocarbons (PAHs) and their transformation intermediates (SPAHs) are ubiquitous in the water environment. In the chemical treatment process, before they are totally degraded, PAHs could be transformed to their intermediates.1 Typical SPAHs have been detected in urban rivers and wastewater treatment plants.2,3 Some of the SPAHs are as toxic as or more toxic than their corresponding PAHs. Therefore, the transformation intermediates should be taken into consideration in studying the PAH elimination. During the photocatalytic oxidation process of PAHs, oxygenated PAHs (OPAHs) were the main intermediates.1,4,5Photocatalysis is an attractive method for water purification due to its low cost and non-addition of chemical reagents.4 Titanium dioxide (TiO2) has received much attention as an effective material for photocatalysis. However, TiO2 could only be excited by a light wavelength of less than 387.5 nm (UV light). UV light is an energy consuming technique. Solar light could emit 5% UV light. If the solar light combined with TiO2 could be used for elimination of contaminants, energy might be effectively saved.6 In recent years, the photoelectrocatalytic (PEC) process has been widely used, such as the splitting water into hydrogen and oxygen.7 There were also studies on the modification of the present electrode to improve the visible light activity.8,9 The PEC process, applying a small positive potential across the photocatalytic anode to enhance the separation efficiency of photogenerated holes and electrons, has been proved to be more efficient for the elimination of pollutants than photocatalytic process.10–12 Meanwhile, the semiconductor electrode could overcome the separation problem of catalyst particles from the treated water.4
The reaction process in the TiO2 PEC system was reported as follows:13,14
Anode (working electrode):
| TiO2 + hv → TiO2(ecb− + hvb+) | (1) |
| TiO2(hvb+) + H2O → TiO2 + H+ + ˙OH | (2) |
| TiO2(hvb+) + OH− → TiO2 + ˙OH | (3) |
| TiO2(ecb−) + O2 → TiO2 + ˙O2− | (4) |
| ˙O2− + H+ → HO2˙ | (5) |
Cathode (counter electrode):
| 2H2O + 2e− → H2 + 2OH− | (6) |
One-dimensional highly ordered TiO2 nanotube (TNTs) electrode has been considered as a promising photoanode for solar energy conversion.15 Compared with the TiO2 film electrode, the TNTs electrode was more efficiency for the elimination of organic contaminants.16,17 The surface area of the highly ordered TNTs was much larger than TiO2 film or nanoparticles, which was more efficient for electron transport.18 In our previous study, TNTs have been electrochemically anodized on the photoanode used for Cu-cyanides and Cu–EDTA degradation.19 PEC process with TNTs anode could also be used for synergistically eliminating organic contaminants and heavy metals.6 However, the transformation intermediates of the target organic contaminants in the PEC process have little reported.
In this study, anthracene (Ant) was selected as a target PAH compound. The generation of its main transformation intermediates, anthranone (AT) and anthraquinone (AQ) were investigated in details. TNTs electrode with an application of a bias potential under simulated solar light irradiation was used for the elimination of Ant in water environment. The concentrations of AT and AQ were measured during the elimination of Ant under different conditions. Additionally, the energy consumption was compared with the technique of TiO2 combined with UV light.
2. Materials and methods
2.1 Materials
Chemicals used for TNTs electrode preparation, including hydrofluoric acid (HF), nitric acid (HNO3), ammonia sulfate [(NH4)2SO4], ammonia fluoride (NH4F), glycerol, acetone and sodium sulfate (Na2SO4), were all analytical reagent grade and purchased from Sinopharm Chemical Reagent Co., Ltd. Chemicals used for Ant, AT and AQ detection, including hexane (HEX), dichloromethane (DCM), methanol (MeOH) and acetonitrile (ACN) were HPLC grade solvents and purchased from Fisher Scientific (USA). Ant (200 μg mL−1 in MeOH), AT (solid, analytical standard) and AQ (100 μg mL−1 in ACN) were obtained from AccuStandard, Inc. (USA). Internal standards including 2-fluorobiphenyl (2-FB, in solid > 96%) and decachlorobiphenyl (PCB209) were obtained from Aldrich Chemical Co., Inc. (Gillingham, Dorset, UK). Analytical grade anhydrous sodium sulfate (Tianjin, China) was baked at 450 °C for 5 h before use. The preparation of the TNTs is detailed in Text S1.†2.2 Photoelectrochemical experiment
The PEC degradation experiments were performed using three electrodes system in a quartz reactor (70 × 70 × 60 mm3). The reactor contained 200 mL sample solution. The three electrodes included a working electrode (TNTs electrode with an active area of 18 cm2), a counter electrode (titanium plate with the same area) and a reference electrode (saturated calomel electrode, SCE). The light source was provided by using a 150 W Xe lamp (PLS-SXE300; Beijing Perfect Light Co., Ltd, China) without cutoff filter. The power was provided by an electrochemical workstation (Shanghai Chen Hua CHI 660E, China). In comparison, the photocatalysis (PC), direct photolysis (DP) and electrochemical oxidation (EO) experiments were carried out in the same reactor as the PEC experiment. The PC experiments were performed with the Xe lamp and the TNTs electrode without the power. The DP experiments were performed only with the Xe lamp, and without electrodes or power. The EO experiment was performed with the TNTs electrode combined with the counter and reference electrodes adding the power in darkness.A certain amount of Ant stock solution (200 mg L−1 in ACN) was added in 200 mL of ultrapure water to prepare a reaction solution. 1 mM Na2SO4 was used as the supporting electrolyte. The solution was kept in dark to equilibrium before adding the bias and light. 2 mL samples were collected at 0, 10, 20, 30 and 60 min and extracted by C18 cartridges (Supelco, USA) as soon as possible.
C18 cartridges were activated with 5 mL DCM, 5 mL MeOH and 5 mL ultrapure water successively before extraction. Then the water samples passed through the cartridges at a rate of 10 mL min−1. After the extraction, the cartridges were vacuumed for 20 min. Then the cartridges were eluted with 10 mL DCM and 5 mL HEX successively. The eluent passed through anhydrous sodium sulfate to eliminate water. Finally, the eluent was concentrated to 0.5 mL under nitrogen and the internal standards were added.
2.3 Analytical method
Ant, AQ and AT were detected by gas chromatography-mass spectrometry (GC-MS: 7890A GC-5975C MS, Agilent Technologies, USA) with a HP-5MS column (30 m × 0.25 mm × 0.25 m). The injector and source temperatures were kept at 280 °C and 300 °C, respectively. The temperature program for Ant was as follows: initial temperature at 80 °C (held for 1 min), increasing to 200 °C at a rate of 20 °C min−1, and to 300 °C at a rate of 10 °C min−1 (held for 5 min).The radicals during the reaction were measured using an electron spin resonance (ESR) technique. The experiment was conducted on a Bruker A300-10/12 (Germany) instrument using DMPO as the trapping agent. The measurements were conducted using Microwave Bridge (microwave frequency, 9.85 GHz; modulation frequency, 100 kHz; microwave power, 22.8 mW; modulation amplitude, 1 G).
The characterization method for the TNTs electrode is detailed in Text S2.†
3. Results and discussion
3.1 Elimination of Ant and formation of AT and AQ in the PEC process
The elimination efficiencies of Ant and the total molar concentration of Ant after oxidation and the formed intermediates AT and AQ (Ant + AT + AQ) during the PEC were compared with the PC, DP and EO process (Fig. 1). The initial concentration of Ant was 125 μg L−1 in ultra-pure water at a constant bias potential of 1.0 V and an initial pH value of 8.5. The pH was not adjusted, and maintained at 8.5, possibly due to the weakly alkaline of the ACN aqueous solution. The TiO2 nanotubes characterization and photochemical performance are shown in Text S3 and Fig. S1.†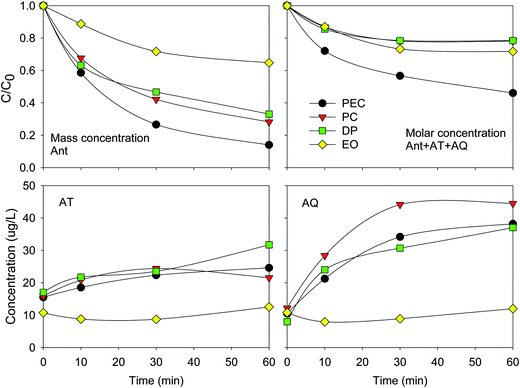 | ||
| Fig. 1 Variation of Ant and ΣAnt + AT + AQ elimination efficiency, AT and AQ concentration in PEC, PC, DP and EO process. Conditions: C0(Ant) = 125 μg L−1 in UPW; E = 1.0 V; pH = 8.5. | ||
The eliminations of Ant and Ant + AT + AQ almost achieved a balance at 60 min. The final elimination efficiencies of Ant were 35%, 67%, 72% and 86% during the EO, DP, PC and PEC process, respectively. The elimination process of Ant was fitted by the pseudo-first order kinetics:
| a E: bias potential, C0: initial concentration, k: reaction constant, r2: correlation coefficient, E: elimination efficiency. |
|---|
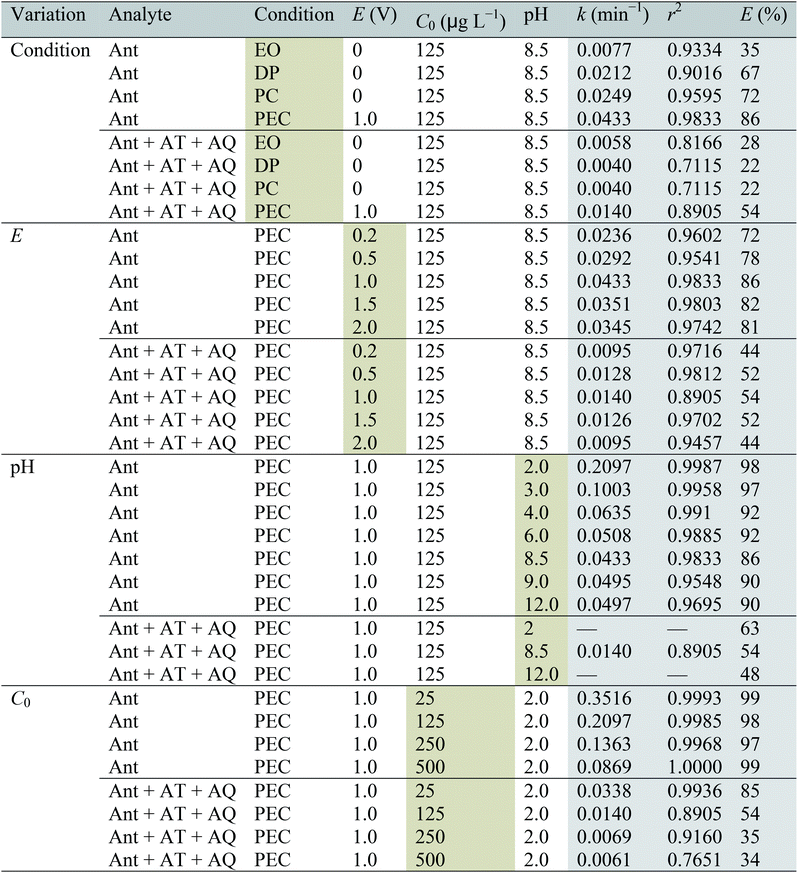 |
Regarding Ant + AT + AQ, the final elimination efficiencies were 28%, 22%, 22% and 54% during the EO, DP, PC and PEC process, respectively. During the EO process, the concentrations of AT and AQ were much lower than those during the DP, PC and PEC process. Therefore, though the elimination efficiency of Ant in the DP and PC process was higher than that in the EO process, the elimination efficiency of Ant + AT + AQ in the DP and PC process was only a little higher than that in the EO process. Additionally, the elimination of AT and AQ in all the processes could not be observed within the 60 min. Therefore, the transformation intermediates should be considered besides the target compound itself. The concentrations of AT and AQ were moderate in the PEC process, possibly because the AT and AQ were more easily eliminated in the PEC process than the other process. For another reason, Ant might transform to other intermediates. As a result, from the aspect of transformation intermediates, PEC was also more efficient than PC, DP and EO process.
3.2 Factors influencing the elimination of Ant and formation of AT and AQ by PEC
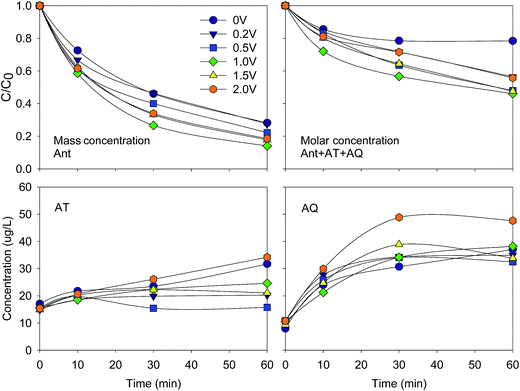 | ||
| Fig. 2 Variation of Ant and ΣAnt + AT + AQ elimination efficiency, AT and AQ concentration at different bias potentials. Conditions: C0(Ant) = 125 μg L−1 in UPW; pH = 8.5. | ||
Regarding Ant + AT + AQ, the highest elimination efficiency (54%) and k value (0.014 min−1) were also obtained at 1.0 V. Similarly, the elimination efficiencies increased from 0 to 1.0 V, and decreased from 1.0 to 2.0 V. The mechanism was probably the same as indicated above.
| TiOH + H+ ↔ TiOH2+ (pH < pHpzc) |
| TiOH + OH− ↔ TiO− + H2O (pH > pHpzc) |
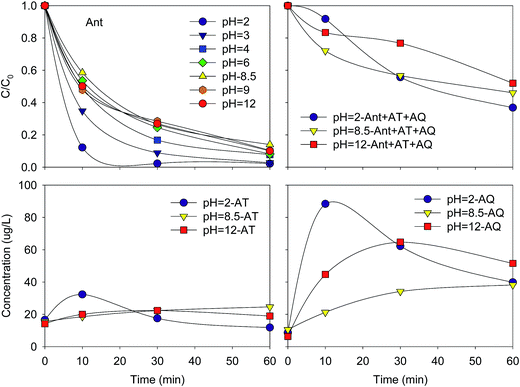 | ||
| Fig. 3 Variation of Ant and ΣAnt + AT + AQ elimination efficiency, AT and AQ concentration at different pH values. Conditions: C0(Ant) = 125 μg L−1 in UPW; E = 1.0 V. | ||
Thus, the charge on the surface is positive at pH less than 6.0, and negative at pH higher than 6.0. Similar result was obtained in the removal of humic acid, 4-chlorocatechol and pentachlorophenol.22,23,27 PEC could be influenced by pH in many ways, including (1) the variation of TiO2 flat-band potential; (2) the changes of adsorption ability of the compounds on the TiO2 surface; (3) the competition of water or OH− oxidation with other reactants able to form powerful oxidants under light irradiation.24,28 In this study, the reason for the higher elimination efficiency of Ant at a lower pH value might be related to the adsorption ability of the TiO2 surface. Ant containing the rich electron group was prone to combine with H+ and TiOH2+ through the electrophilic reaction.
It could be noticed that the concentrations of AT and AQ at pH 2.0 increased in the initial 10 min, higher than those at pH 8.5, then decreased from 10 to 60 min, and finally similar to those at pH 8.5. As a result, the elimination efficiency of Ant + AT + AQ at pH 2.0 (E = 63%) was a little higher compared with that at pH 8.5 and pH 12.0 (E = 48%). The result showed that in the acidic condition, the formation of AT and AQ was much easier than in the neutral and alkaline condition. The reactivity of position 9 and 10 of Ant was the highest due to the highest electron cloud density compared with other positions. Therefore, more AT and AQ will be formed during the reaction. Additionally, the elimination of AT and AQ at pH 2.0 was also much easier. The carbonyl could be nucleophilic addition reacted with H+ in the acid condition, resulting to an easier elimination of AT and AQ.
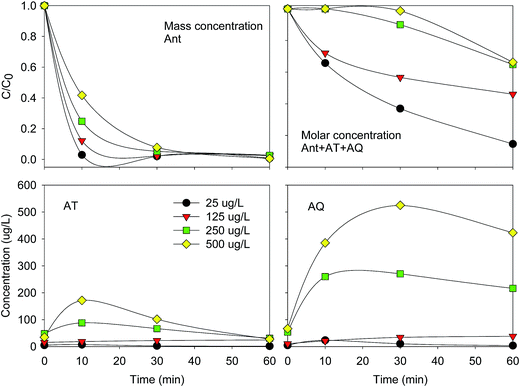 | ||
| Fig. 4 Variation of Ant and ΣAnt + AT + AQ elimination efficiency, AT and AQ concentration at different Ant initial concentrations. Conditions: E = 1.0 V; pH = 2.0. | ||
The elimination efficiencies of Ant + AT + AQ were also lower with a higher initial Ant concentration. The formation concentrations of AT and AQ increased with the increasing initial concentration of Ant. The Ant + AT + AQ did not vary much in the initial 10 min at the initial concentration of 250 μg L−1, and in the initial 20 min at the initial concentration of 500 μg L−1. Correspondingly, at the initial concentrations of 250 μg L−1 and 500 μg L−1, the concentrations of AT and AQ increased firstly and then decreased. The elimination of AT and AQ might be influenced by the photolysis process, during which the compounds with higher concentrations probably absorb more light, resulting to an easier conversion.29
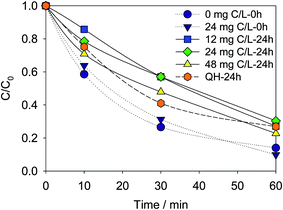 | ||
| Fig. 5 Influence of humic acid on the elimination of Ant. Conditions: C0(Ant) = 125 μg L−1 in UPW; E = 1.0 V; pH = 8.5. | ||
The elimination efficiencies of Ant contacted with the same concentration of humic acid for the different time (0 and 24 h) before experiment were different. The elimination efficiency of Ant contacted with 24 mg C/L humic acid for 24 h (70%) was lower than 0 h (90%). As a result, Ant was probably combined with the humic acid. The elimination of Ant would be influenced by the degradation of the humic acid. Therefore, the elimination efficiency of Ant reduced when being contacted with humic acid for 24 h.
A real water sample was used to determine the influence of DOM on the elimination of Ant. Secondary effluent from a municipal wastewater treatment plant (QH) was spiked with Ant for 24 h. The concentration of TOC was 7.6 mg L−1. Though the TOC was lower than humic acid added in this study, the existence of DOM in real water could also decrease the elimination efficiency of Ant as the humic acid (73%). However, the elimination rate was different from the humic acid, possibly indicating a different composition of DOM to humic acid.
3.3 Oxidation mechanism
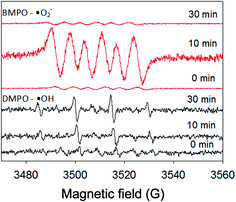
ESR technique was used for the identification of free radical related to the elimination of Ant. As shown in Fig. 6, ˙O2− signal was significant at 10 min, but weak at 0 and 30 min. ˙OH signal increased from 0 to 30 min. The result indicated that both the ˙O2− and ˙OH were generated in the PEC system. The elimination rate of Ant increased in the initial 15 min and decreased from 15 min to 60 min, suggesting that ˙O2− might be more effective than ˙OH for the elimination of Ant.To further investigate the effect of ˙O2− and ˙OH on the elimination of Ant, different quenchers were added to the system (Fig. 7). The elimination efficiency of Ant significantly decreased after benzoquinone (BQ) was added, which was the quencher of ˙O2−, indicating again that ˙O2− was the effective radical for the elimination of Ant. The adding of tert-butyl alcohol (BuOH) and EDTA–2Na, the quencher of ˙OH and photogenerated holes respectively, was slightly reduce the elimination of Ant.
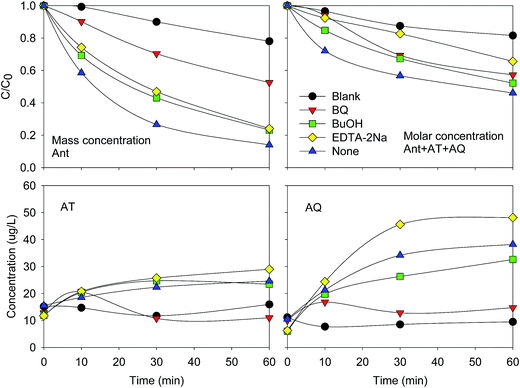 | ||
| Fig. 7 Effect of different quenchers to the elimination of Ant and ΣAnt + AT + AQ, and the formation of AT and AQ. | ||
It was also noticed that AT and AQ were nearly not detected when BQ was added, indicating that ˙O2− was the effective radical transform Ant to AT and AQ. This result was consistent with a previous study that Ant was firstly transformed to AT and AQ (Fig. S2†).5 The concentrations of AT were similar when BuOH and EDTA–2Na were used to the non-using of the quenchers. The concentration of AQ was a little lower when BuOH was added, indicating that ˙OH was also effective for the transformation of Ant to AQ. However, the concentration of AQ was higher when EDTA–2Na was added, suggesting that the absence of photogenerated holes might facilitate the generation of AQ. Therefore, the photogenerated holes might prevent the formation of AQ.
3.4 Estimation of energy consumption
In order to figure out the energy saving using the electricity combined with solar light irradiation to eliminate a typical PAH, the energy consumption for treating 200 mL water containing 125 μg L−1 Ant was calculated in the PEC with solar light and PC with UV light system. In the PEC-solar system of this study, the optimal bias was 1.0 V. The corresponding current ranged from 2.8 to 3.1 mA, and an average of 3.0 mA was used for estimation. The reaction time was 60 min. Thus, the power consumption was 3.0 × 10⁻⁶ kW h. The energy consumption of the Xe lamp was not added because this energy could be compensated when using the real solar energy. In the PC-UV system in our previous study,31 the power of the UV light was 15 W. The reaction time was 10 min. Thus, the power consumption was 2.5 × 10⁻³ kW h. Therefore, the PEC-solar system could save much energy compared to the PC-UV system on the aspect of Ant elimination.4. Conclusions
The transformation intermediates of Ant including AT and AQ were detected during the PEC process. The eliminations of Ant and Ant + AT + AQ were enhanced by PEC compared with the DP, PC and EO process. However, the eliminations of AT and AQ were hardly observed in 60 min. Therefore, transformation intermediates should be considered during the elimination process of organic contaminants. The best elimination efficiencies of Ant and Ant + AT + AQ were achieved at a bias potential of 1.0 V. The elimination efficiency of Ant was higher in acid solution than that in the neutral and alkaline solution. The elimination efficiencies of Ant and Ant + AT + AQ increased with the decreasing of the Ant initial concentration. The contact time of humic acid and Ant was greatly influence the elimination of Ant rather than the concentration of humic acid. The active species ˙OH and especially ˙O2− were mainly responsible for the elimination of Ant. Furthermore, based on the estimation of the energy consumption, TiO2 nanotube with solar light irradiation and a bias potential could save much energy compared with the UV light on the aspect of Ant elimination.Conflicts of interest
There are no conflicts to declare.Acknowledgements
This work was supported by National Natural Science Foundation of China (Grant No. 51508552 and 51438011).References
- O. T. Woo, W. K. Chung, K. H. Wong, A. T. Chow and P. K. Wong, J. Hazard. Mater., 2009, 168, 1192–1199 CrossRef CAS PubMed.
- M. Qiao, W. X. Qi, H. J. Liu and J. H. Qu, Water Res., 2014, 52, 11–19 CrossRef CAS PubMed.
- M. Qiao, W. X. Qi, H. J. Liu and J. H. Qu, Sci. Total Environ., 2014, 481, 178–185 CrossRef CAS PubMed.
- B. Pal and M. Sharon, J. Mol. Catal. A: Chem., 2000, 160, 453–460 CrossRef CAS.
- S. Sanches, C. Leitao, A. Penetra, V. V. Cardoso, E. Ferreira, M. J. Benoliel, M. T. B. Crespo and V. J. Pereira, J. Hazard. Mater., 2011, 192, 1458–1465 CrossRef CAS PubMed.
- C. B. Liu, Y. B. Ding, W. Q. Wu and Y. R. Teng, Chem. Eng. J., 2016, 306, 22–30 CrossRef CAS.
- T. E. Rosser, M. A. Gross, Y. H. Lai and E. Reisner, Chem. Sci., 2016, 7, 4024–4035 RSC.
- Z. H. Wang, G. J. Zou, W. Wang, Z. C. Tang, Y. P. Bi and X. L. Wang, J. Power Sources, 2017, 343, 94–102 CrossRef CAS.
- J. Wang and W. D. Zhang, Electrochim. Acta, 2012, 71, 10–16 CrossRef CAS.
- P. A. Christensen, T. P. Curtis, T. A. Egerton, S. A. M. Kosa and J. R. Tinlin, Appl. Catal., B, 2003, 41, 371–386 CrossRef CAS.
- J. C. Cardoso, T. M. Lizier and M. V. B. Zanoni, Appl. Catal., B, 2010, 99, 96–102 CrossRef CAS.
- Y. Z. Zhang, X. Y. Xiong, Y. Han, X. H. Zhang, F. Shen, S. H. Deng, H. Xiao, X. Y. Yang, G. Yang and H. Peng, Chemosphere, 2012, 88, 145–154 CrossRef CAS PubMed.
- I. K. Konstantinou and T. A. Albanis, Appl. Catal., B, 2004, 49, 1–14 CrossRef CAS.
- Z. Frontistis, V. M. Daskalaki, A. Katsaounis, I. Poulios and D. Mantzavinos, Water Res., 2011, 45, 2996–3004 CrossRef CAS PubMed.
- J. H. Park, T. W. Lee and M. G. Kang, Chem. Commun., 2008, 2867–2869 RSC.
- S. G. Yang, Y. Z. Liu and C. Sun, Appl. Catal., A, 2006, 301, 284–291 CrossRef CAS.
- N. Wang, X. Y. Li, Y. X. Wang, X. Quan and G. H. Chen, Chem. Eng. J., 2009, 146, 30–35 CrossRef CAS.
- X. Nie, G. Y. Li, M. H. Gao, H. W. Sun, X. L. Liu, H. J. Zhao, P. K. Wong and T. C. An, Appl. Catal., B, 2014, 147, 562–570 CrossRef CAS.
- X. Zhao, J. J. Zhang and J. H. Qu, Electrochim. Acta, 2015, 180, 129–137 CrossRef CAS.
- X. Zhao, T. G. Xu, W. Q. Yao, C. Zhang and Y. F. Zhu, Appl. Catal., B, 2007, 72, 92–97 CrossRef CAS.
- X. Zhao and Y. F. Zhu, Environ. Sci. Technol., 2006, 40, 3367–3372 CrossRef CAS PubMed.
- H. Selcuk and M. Bekbolet, Chemosphere, 2008, 73, 854–858 CrossRef CAS PubMed.
- X. Quan, X. L. Ruan, H. M. Zhao, S. Chen and Y. Z. Zhao, Environ. Pollut., 2007, 147, 409–414 CrossRef CAS PubMed.
- A. Rubio-Clemente, R. A. Torres-Palma and G. A. Penuela, Sci. Total Environ., 2014, 478, 201–225 CrossRef CAS PubMed.
- D. D. Dionysiou, M. T. Suidan, E. Bekou, I. Baudin and J. M. Laine, Appl. Catal., B, 2000, 26, 153–171 CrossRef CAS.
- S. F. Chen and Y. Z. Liu, Chemosphere, 2007, 67, 1010–1017 CrossRef CAS PubMed.
- J. M. Kesselman, N. S. Lewis and M. R. Hoffmann, Environ. Sci. Technol., 1997, 31, 2298–2302 CrossRef CAS.
- X. Quan, S. Chen, J. Su, J. Chen and G. Chen, Sep. Purif. Technol., 2004, 34, 73–79 CrossRef CAS.
- J. S. Miller and D. Olejnik, Water Res., 2001, 35, 233–243 CrossRef CAS PubMed.
- J. Wenk, U. von Gunten and S. Canonica, Environ. Sci. Technol., 2011, 45, 1334–1340 CrossRef CAS PubMed.
- B. Liu, L. Wang, M. Qiao, T. Guo, Y. Wang, W. Cao and X. Zhao, Res. Environ. Sci., 2017, 30, 322–328 Search PubMed.
Footnote |
| † Electronic supplementary information (ESI) available. See DOI: 10.1039/c7ra10733a |
| This journal is © The Royal Society of Chemistry 2017 |


