 Open Access Article
Creative Commons Attribution 3.0 Unported Licence
Graphene quantum dot modified g-C3N4 for enhanced photocatalytic oxidation of ammonia performance†
Ruiling Wangab,
Tian Xiea,
Zhiyong Sunb,
Taofei Pua,
Weibing Li*bc and
Jin-Ping Ao *a
*a
aInstitute of Technology and Science, Tokushima University, 2-1 Minami-Josanjima, Tokushima 770-8506, Japan. E-mail: jpao@ee.tokushima-u.ac.jp; Fax: +81 88 656 7442; Tel: +81 88 656 7442
bState Key Laboratory for Marine Corrosion and Protection, Luoyang Ship Material Research Institute (LSMRI), No. 149-1# Zhuzhou Road, Qingdao, 266101, China
cSchool of Environment and Safety Engineering, Qingdao University of Science and Technology, 53 Zhengzhou Road, Qingdao 266042, China
First published on 7th November 2017
Abstract
In this study, graphene quantum dot (GQD) modified g-C3N4 (GQDs/CN) composite photocatalysts were prepared. The photocatalytic ammonia degradation properties of the GQDs/CN composites were much higher than that of pure g-C3N4. When the amount of GQDs added reached 0.5 wt% the GQDs/CN composite showed the best performance for photocatalytic total ammonia nitrogen (TAN) removing, and a 90% TAN removing rate was achieved in 7 hours under visible light illumination (200 mW cm−2), which is approximately 3 times higher than that of pure g-C3N4. The increased photocatalytic property was contributed by the photon adsorption ability and electron transfer capacity, which were improved after GQD modification. The main photocatalytic end-product of TAN was NO3− which is a type of environmentally green ion. Further results indicated that the oxygen concentration and pH value of the reaction solution were very important for the photocatalytic ammonia degradation process. A better performance could be achieved under a higher oxygen concentration and pH value.
Introduction
Ammonia is a typical environmental pollutant which exists in the atmosphere and water system.1,2 It is generally known that the health of the human respiratory system, eyes and skin, and aquatic animals can also be affected deeply by ammonia pollution. Many techniques have been employed to treat ammonia in wastewater and the atmosphere, e.g. adsorption,3 biological treatments,4 chemical precipitation,5 ion exchange,6 membranes,7 and photocatalytic technology.8–10Among a series of semiconductor materials, TiO2 is a widely considered photocatalyst for ammonia treatment due to its non-toxicity, high chemical inertness and cost-effectiveness.11,12 However, the photocatalytic performance of TiO2 is limited by its wide band gap (3.2 eV), which only absorbs UV light below 380 nm. In order to improve the photocatalytic property of TiO2, doping it with impurities and combining it with other narrow band gap semiconductors were carried out.
Although the photocatalytic ammonia treatment performance of TiO2 has been improved, it is far from being ready for practical application.13 In addition, some visible-light driven semiconductors, such as CdS14 and Bi2Fe4O9,15 have also been investigated.
Recently, graphite-like C3N4 (g-C3N4) has been proven to be a possible candidate in the fields of photocatalytic water splitting, organic pollutant degradation and ammonia degradation under visible light illumination.16–21 Besides, some research results have indicated that the photocatalytic performance of g-C3N4 could be improved dramatically by energy band regulation, surface modification and combination with other semiconductors.22,23
Graphene is a typical 2D material with high electron mobility and special optical, electronic, and mechanical properties. Compared with 2D graphene, zero-dimensional GQDs consisting of single- or few-layer graphene with a size of less than 10 nm lead to size-dependent quantum effects. Contributed to by quantum confinement and edge effects, the GQDs possess a bandgap of less than 2.0 eV which induces the unique optical and electronic properties of the GQDs.24,25 Recently, some works have focused on the development of a graphene/g-C3N4 composite photocatalyst to enhance its separation capacity of photogenerated charge carriers.26,27 However, few research has have paid attention to graphene quantum dot (GQD) modified g-C3N4 composite photocatalysts and the working mechanism between the GQDs and g-C3N4 is not clear.
So, in this work, GQDs were synthesized through Hummer’s method28 and hydrothermal treatment. Subsequently, the GQDs were loaded onto the surface of g-C3N4 to form a GQDs/g-C3N4 composite photocatalyst. We aimed to assess the photocatalytic ammonia oxidation performance of g-C3N4 and GQDs/g-C3N4 with a series of GQD additions. In addition, the function of the GQDs on the surface of g-C3N4 was also analyzed.
Experimental section
g-C3N4, GQDs and g-C3N4/GQD materials preparation
Pure g-C3N4 was prepared by annealing 10 g of dicyandiamide at 520 °C (up/down rate of 10 °C per min) for 4 hours in a semi-closed ceramic crucible with a cover. GQDs were prepared as described in a reported method.24 In brief, GO synthesized by Hummer’s method was dispersed in DMF with a concentration of 27 mg mL−1. The mixture solution was ultrasonicated for 30 min (120 W, 100 kHz) and then transferred to a 30 mL Teflon-lined autoclave to be heated at 200 °C for 8 h. After the hydrothermal reaction, we collected the brown transparent suspension and evaporated the solvents to obtain the solid GQD sample. To prepare the g-C3N4/GQD composite materials, 0.3 g of as-prepared pure g-C3N4 was added into 50 mL of methanol, then ultrasonically dispersed for 30 min. Subsequently, the GQD dispersion liquid was added into the g-C3N4/methanol mixture (mass ratio of GQDs![[thin space (1/6-em)]](https://www.rsc.org/images/entities/char_2009.gif) :
:![[thin space (1/6-em)]](https://www.rsc.org/images/entities/char_2009.gif) g-C3N4 = 0.25%, 0.5%, 1% or 2%), and continuously stirred at 40 °C until the methanol and water were completely removed. These powders were marked as GQDs/CN0.25, GQDs/CN0.5, GQDs/CN1 and GQDs/CN2.
g-C3N4 = 0.25%, 0.5%, 1% or 2%), and continuously stirred at 40 °C until the methanol and water were completely removed. These powders were marked as GQDs/CN0.25, GQDs/CN0.5, GQDs/CN1 and GQDs/CN2.
Characterization
The microstructures of the prepared samples were analyzed using a scanning electron microscope (SEM, JSM-6700F; JEOL, Tokyo, Japan) and a field emission transmission electron microscope (FE-HRTEM, Tecnai G2 F20, FEI Company, USA). X-ray diffraction (XRD, D/MAX-2500/PC; Rigaku Co., Tokyo, Japan) was used to identify the crystalline structures of the series of samples. The elementary composition and bonding information of the synthesized GQDs/CN0.5 were analyzed using X-ray photoelectron spectroscopy (XPS, Axis Ultra, Kratos Analytical Ltd., England). A UV-visible diffuse reflectance spectrophotometer (U-41000; HITACHI, Tokyo, Japan) was used to study the optical absorption properties of the samples. A fluorescence spectrometer (PL, Fluoro Max-4, HORIBA Jobin Yvon, France) was employed to record the photoluminescence (PL) properties of the prepared materials. An IRAffinity-1S FTIR spectrometer was employed to test the FT-IR spectra of these samples. The BET results of these samples were obtained by a Micromeritics TriStar 3000.Photocatalytic oxidation of ammonia
In this section, we evaluated the photocatalytic ammonia oxidation performances of the prepared photocatalysts by Wang’s method.21 In brief, 0.02 g of photocatalyst was added into 100 mL of ammonium chloride solution with a total ammonia nitrogen (TAN) concentration of 1.5 mg L−1. The photocatalysis reaction container was a beaker with a volume of 200 mL, and the top of the beaker was covered by a quartz plate. The light source was a 150 W Xe arc lamp (PLS-SXE300, Beijing Changtuo Co. Ltd., Beijing, China) with a 420 nm filter to let in visible light. The distance between the light source and the liquid level was 10 cm. The light density at the liquid level was 200 mW cm−2. The concentration changes of TAN, NO2− and NO3− with time were monitored by a Technicon AutoAnalyzer II system (Bran + Luebbe, Buffalo Grove, IL).Assessment of the photoelectrochemical and electrochemical properties of the samples
Photoelectrochemical and electrochemical measurements were performed in a traditional three-electrode experimental system using a CHI 660D electrochemical workstation (Shanghai Chenhua Instrument Co., Ltd., China). The photoelectrodes (1 cm × 1 cm) prepared with the g-C3N4 or GQDs/g-C3N4 composites acted as the working electrodes. Ag/AgCl and Pt acted as the reference and counter electrodes, respectively. The photogenerated current densities with time (I–t curve) were measured at a 0.5 V bias potential under Xe light (200 mW cm−2) illumination (150 W Xe arc lamp, PLS-SXE300, Beijing Changtuo Co. Ltd., Beijing, China). Electrochemical impedance spectroscopy (EIS) tests were performed at a 0 V bias potential over a frequency range between 104 and 10−1 Hz, with an AC voltage magnitude of 5 mV, using 12 points/decade. All of the tests were carried out in 0.1 mol L−1 Na2SO4.Results and discussion
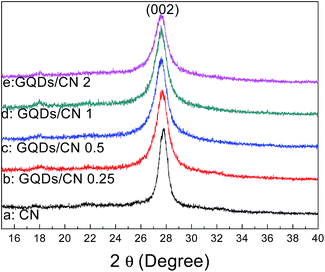
The XRD results of the CN and GQDs/CN composites are presented in Fig. 1. For curve 1a of CN, the peak at 2θ = 27.4 (002) corresponds to interlayer stacking of the C3N4. Curves 1b to 1e show the XRD patterns of the GQDs/CN composites, from which we can see the interlayer stacking peak of C3N4 and no emerging peak, indicating that the layer structure of g-C3N4 was not changed after modification with the GQDs. In addition, the characteristic diffraction peak of the GQDs does not appear on curves 1b to 1e due to its small quantity.Fig. 2 shows the SEM images of CN and the GQDs/CN composites. Fig. 2A shows the surface morphology of CN, which is a typical layered and bulk material. Fig. 2B to E present the surface morphologies of the GQDs/CN composite materials. Due to the small size of the GQDs, the GQDs can’t be observed directly. However, from these images, we can discover that the micro-morphology of CN does not change after GQD modification. The EDS mapping of GQDs/CN0.5 is presented in Fig. S1.† In this, the C, N and O elements can be found on the EDS mapping and EDS spectrum (titanium is attributed to the substrate during SEM testing), but it is difficult to distinguish the GQDs on C3N4 by this method.
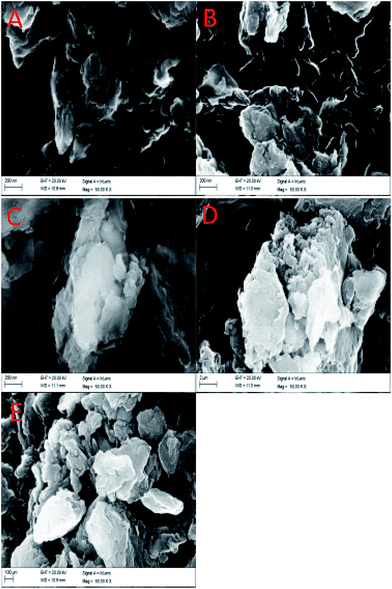 | ||
| Fig. 2 SEM images of (A) CN and the (B) GQDs/CN0.25, (C) GQDs/CN0.5, (D) GQDs/CN1 and (E) GQDs/CN2 composites. | ||
To further observe the microstructures of the GQDs and GQDs on the surface of the CN composites, TEM was carried out for analysis. Fig. 3A shows the HRTEM images of the dispersed GQD particles. The particles which were highly dispersed had diameters of less than 10 nm. Meanwhile, the transmissivity of the GQDs shown on this figure is high, indicating a thin structure. Fig. 3B shows the TEM image of the GQDs/CN0.5 composite. From this image, we can see that the GQDs were loaded on the surface of the layered CN with a high degree of dispersion. Fig. 3C shows the high-resolution TEM image of the GQDs/CN0.5 composite. From this, we can see that the GQDs attached to the surface of CN tightly, indicating that a good contact was formed between the GQDs and CN which decreased the interface transfer barrier of the photogenerated electrons and holes. Fig. 3D presents the SAED patterns of the GQDs/CN0.5 composite. The circular ring-like structure indicates the low crystallinity of g-C3N4.
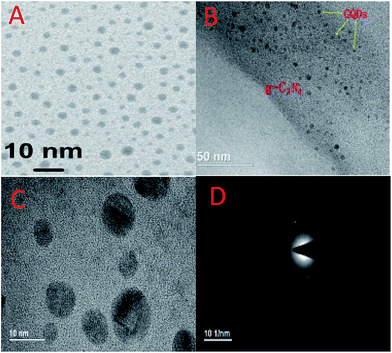 | ||
| Fig. 3 TEM images of (A) the GQD dispersed solution; (B) the GQDs/CN0.5 composite with low-resolution; (C) high-resolution; (D) SAED patterns of the GQDs/CN0.5 composite. | ||
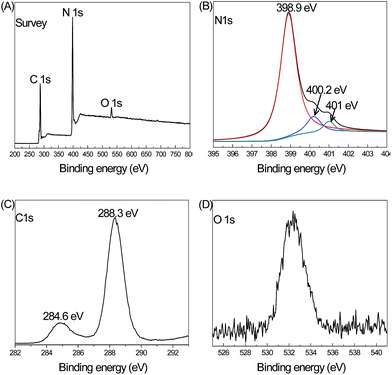
Fig. 4 shows the XPS result of the GQDs/CN0.5 composite material. Fig. 4A shows the survey spectrum of this material. The characteristic peaks of C 1s, N 1s and O 1s can be seen, and the elements correspond to the components of the sample. Fig. 4B shows the deconvoluted XPS result of the N 1s spectrum. The core levels at 398.9 eV, 400.2 eV and 401 eV can be attributed to N (sp2), N (sp3) and C–NHx, respectively. Fig. 4C shows the core level of the C 1s spectrum and the peaks at 284.6 eV and 288.3 eV are attributed to the C–C and N–C–N bonds, respectively. The O 1 s peak is shown in Fig. 4D and the weak density of the O 1s peak is contributed by the oxidation bond formed on the surface of CN in the thermal poly-condensation process in air.
The FT-IR results of CN and GQDs/CN0.5 are shown in Fig. S2.† In the GQD composite, the peaks of the C–OH groups on the surface of C3N4 at 1205 cm−1 and 2932 cm−1 are decreased, meaning that the GQDs have been captured by these surface C–OH groups by van der Waals’ forces.
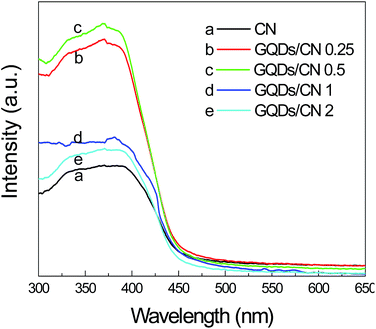
Fig. 5 shows the UV-vis DRS curves of the as-prepared CN and GQDs/CN composites in order to investigate the optical absorption properties. From these curves, we can see that the absorption threshold of CN and the GQDs/CN composites is near 460 nm, which corresponds to a band gap of 2.7 eV. This result indicates that the band gap structure of CN was not changed after the GQD loading. However, the light adsorption ability of CN under 460 nm enhanced after the GQD modification. When the content of GQDs added increased from 0.25 wt% to 0.5 wt%, the photon absorption capacity of the CN increased dramatically, while it decreased as the added content of GQDs continually increased to 1 wt% and 2 wt%. This phenomenon indicates that a small amount of GQD modification can improve the photon absorption capacity of CN greatly, and this change may enhance the photocatalytic performance of CN. However, as the added GQD content increases, it will absorb light in the UV region by π–π conjugated bonds competing with C3N4 to decrease the absorption capacity of the GQDs/CN composites.
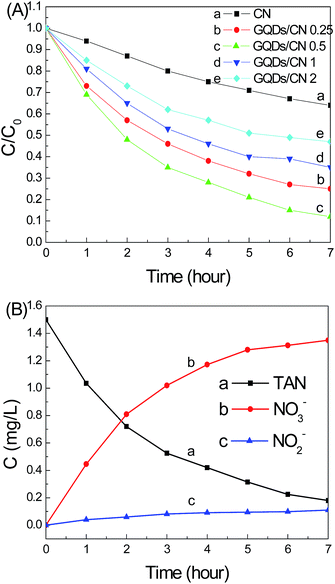
As we know, aqueous ammonia exists in water equilibrated by ionized ammonium (NH4+) and unionized ammonia. They are both environmental pollutants which are difficult to remove. Photocatalytic ammonia treatment in water is a green and energy-saving technique. Herein, for further characterization of the photocatalytic performance of CN and the GQDs/CN composites, photocatalytic ammonia degradation was performed, and the results are shown in Fig. 6. Fig. 6A presents the curves of the TAN removal by the CN and CN/GQD composite photocatalysts, respectively. Before light illumination, the mixed photocatalysts and aqueous ammonia were stirred in the dark for 30 min to adsorption equilibrium, and the results are shown in Fig. 6A. The concentrations at 0 hours indicate that the CN and GQDs/CN composites don’t have an obvious adsorption capacity for ammonium and ammonia in the dark. After light illumination, CN presents a slow reaction of photocatalytic TAN removal, and approximately 30% of the TAN was removed after 7 hours of illumination.
However, compared with CN, the photocatalytic TAN removing properties of the GQDs/CN composites increased obviously. In addition, the added content of GQDs in the GQDs/CN composites is a key factor for improving the TAN removing performance. Curves 6Ab to 6Ae show that the highest TAN removing performance was achieved when the added content of GQDs reached 0.5 wt%, and more than 90% of the TAN was removed after 7 hours of visible light illumination, which is approximately 3 times more than that of pure CN. However, as the added content of GQDs further increased, the photocatalytic TAN removing property decreased. From Fig. 5 we can see that the light absorption capacity of the GQDs/CN composites was decreased, meaning that much fewer photons could be transferred to free photogenerated electrons and holes to decrease the TAN degradation property. The BET results of the CN and GQDs/CN composites were tested and are shown in Fig. S3.† All of the BET curves showed typical accumulation pore. After the GQD modification, the surface area of these samples did not increase, indicating that the TAN degradation property was not influenced by the surface area change.
After the photocatalytic TAN removal process, the end-products included inorganic NO2− and NO3−. NO2− is widely known as a toxic substance which can induce cancer in humans. So we monitored the concentration changes of the NO2− and NO3− ions during the photocatalytic TAN removing process by the GQDs/CN0.5 composite photocatalyst, and the results are presented in Fig. 6B. Curves 6Ba, 6Bb and 6Bc show the concentration changes of TAN, NO3− and NO2−, respectively, during an illumination time prolonged to 7 hours. When the TAN concentration decreased from 1.50 mg L−1 to approximately 0.10 mg L−1 in 7 hours, the concentration of NO3− increased from 0 to 1.35 mg L−1. At the same time, the concentration of NO2− merely increased from 0 to 0.11 mg L−1. This result indicates that the main product during the photocatalytic TAN removing process by the GQDs/CN0.5 composite was nontoxic NO3− ions, and the output of toxic NO2− was very low. So this is a green method to treat ammonia and it never produces any additional secondary pollutants.
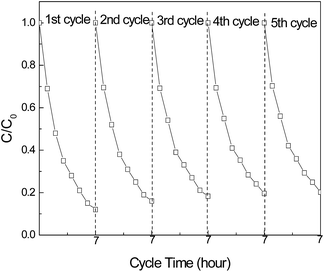
Fig. 7 shows the stability of photocatalytic TAN removal by the GQDs/CN0.5 composite. Every measurement cycle lasted 7 h with new TAN (1.5 mg L−1) used for each cycle. After five cycles, the TAN removing rate remained at 82%, 8% lower than the 90% in the 1st cycle, confirming that the GQDs/CN0.5 composite is a stable photocatalyst for TAN degradation.
Generally, during the photocatalytic degradation process, NH3 can be oxidized by ˙OH and h+ generated by the photocatalyst under light illumination. And the reactions can be described as follows:21
| NH3 + ˙OH → ˙NH2 + H+ | (1) |
| ˙NH2 + ˙OH → NH2OH | (2) |
| NH2OH + ˙OH → ˙NHOH + H+ | (3) |
| NH3+ h+ → ˙NH2 + H+ | (4) |
| ˙NH2 + OH− → NH2OH | (5) |
| NH2OH + h+ → ˙NHOH + H+ | (6) |
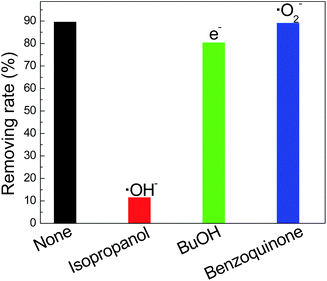
Chemical equations (1) to (3) describe that NH3 can be oxidized into ˙NHOH by ˙OH via three steps. In addition, NH3 can be oxidized by photogenerated holes into ˙NHOH directly, as shown in chemical equations (4) to (6). Herein, we added the scavengers 0.1 mM isopropanol, 0.1 mM BuOH (tert-butanol) and 0.1 mM p-benzoquinone to capture the ˙OH, photogenerated electrons and ˙O2−, respectively (we did not add EDTA-2Na to capture the photogenerated holes because extra nitrogen would be introduced if EDTA-2Na was added in).29 As shown in Fig. 8, when the ˙OH was captured by isopropanol, the ammonia removing rate decreased dramatically, indicating that ˙OH was the main active radical for ammonia degradation, which accords with equations (1) to (3). In addition, after the photogenerated electrons were captured by BuOH, the ammonia removing rate was slightly higher than that of the reaction without scavengers added. As we know, the photogenerated electrons can be changed to ˙OH in solution, as shown in eqn (7) and (8),21 and then participate in the ammonia degradation process. This phenomenon means that the photogenerated electrons can influence the ammonia degradation process, but are not the main cause. When the ˙O2− was captured by p-benzoquinone, the photocatalytic ammonia removing rate remained almost the same as that of the reaction with no scavengers added. This means that the ˙O2− did not participate in the ammonia degradation process.
| 2e− + O2 + 2H+ → H2O2 | (7) |
| H2O2 + e− →˙OH + OH− | (8) |
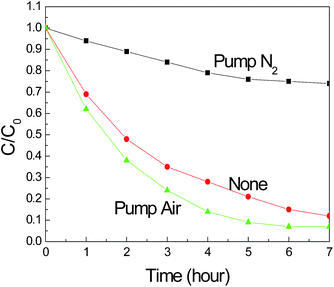
˙NHOH is an important intermediate for NH3 photocatalytic degradation. After that, the ˙NHOH reacted with O2 in the solution to form ˙O2NHOH, as shown in eqn (9). Subsequently, as shown in eqn (10), the ˙O2NHOH reacted with OH− to transform into NO2−, H2O and ˙OH. This reaction is the key step for NO2− formation. In this regard, O2 is very important for ˙O2NHOH production, which determines the nitrate transfer process. So we tested the photocatalytic ammonia degradation performance under three different conditions, including pumping air, not pumping air and pumping nitrogen into the reaction solution, and the results are shown in Fig. 9. From these results, we found that by pumping air into the reaction solution, the photocatalytic ammonia degradation performance was better than that of the reaction without air. However, when pumping nitrogen into the reaction solution during the photocatalytic process, the ammonia degradation performance decreased dramatically. The above phenomenon demonstrates that the O2 in the reaction solution is very important for promoting eqn (9) and it improves the photocatalytic ammonia degradation performance.
| ˙NHOH + O2 → ˙O2NHOH | (9) |
| ˙O2NHOH + OH− → NO2− + ˙OH + H2O | (10) |
Chemical equation (11) is a very important reaction for the detoxification of NO2−, and the key factors are the oxidation abilities of ˙OH and h+. As we know, for a photocatalyst the oxidation abilities of ˙OH and h+ are mainly decided by its band energy level. So, if the oxidation capacities of ˙OH and h+, which are generated by the photocatalyst, are not sufficient to drive equation (11), toxic NO2− should be the main end-product. In contrast, NO2− can be oxidized to NO3− by equations (11) and (12). By referring to the results presented in Fig. 6, we can conclude that the oxidation capacities of the ˙OH and h+ generated by the GQDs/CN 0.5 composite are sufficient to oxidize the NO2− to NO3− in order to keep the end-product environmentally green.
| NO2− + ˙OH → HONO2 or NO2− + H2O + h+ → HONO2 + H+ | (11) |
| HONO2 → NO3− + H+ | (12) |
The photocatalytic ammonia removing efficiencies of the GQDs/CN0.5 composite under different pH values are shown in Fig. 10. From these results, we find that as the pH value of the reaction increased, the photocatalytic ammonia removing performance increased and obtained the best performance at pH = 10. As we know, after the ammonium ions dissolved in water, an equilibrium was established via eqn (13),
| NH4+ + OH− ↔ NH3 + H2O | (13) |
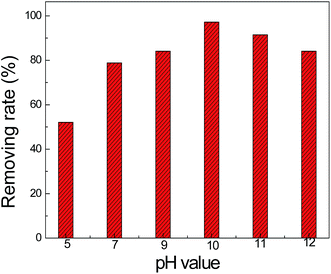 | ||
| Fig. 10 Photocatalytic ammonia removing efficiencies of the GQDs/CN0.5 composite under different pH values. The pH of the reaction solution has been adjusted by 0.2 M NaOH and 0.2 M HCl. | ||
NH4+ ions are an inactive species for oxidation by ˙OH,30 so as the OH− concentration in the reaction solution is increased, the NH3 concentration would be increased to promote the reaction processes of equations (1) and (4). Furthermore, as the OH− concentration increases in the reaction solution, the reaction processes shown in equations (5) and (10) could be promoted to improve the photocatalytic ammonia degradation performance.
Fig. 11A shows the photogenerated current–time (I–t) curves of CN and the GQDs/CN composites. The I–t curve is an indirect method to assess the separation efficiency of the photogenerated carriers. The stronger photogenerated current corresponds to a higher photogenerated carrier separation efficiency of the photocatalyst. From the I–t curves shown in Fig. 8, we can see that the photogenerated current densities increased with the added GQD content increasing from 0.25 wt% to 0.5 wt%. However, the photogenerated current densities decreased with a further increase in GQDs. This phenomenon indicates that the GQDs possibly have a capacity to promote the separation of the carriers, and this capacity is related to the added content of GQDs too. Fig. 11B shows the PL spectra of CN and the GQDs/CN composites. PL is an indirect method to reflect the lifetime of photogenerated carriers, with a smaller PL peak indicating a longer carrier lifetime. In Fig. 11B, GQDs/CN0.5 displays a PL peak which is weaker than that of the other composites, indicating that this photocatalyst possesses the longest photogenerated carrier lifetime.
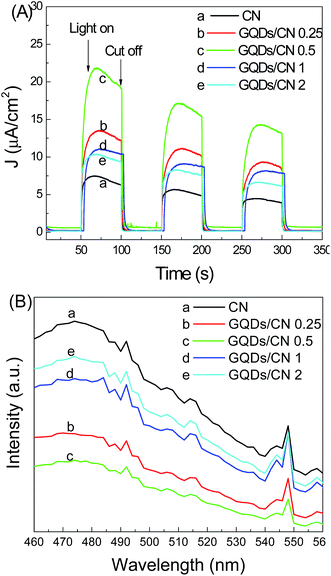 | ||
| Fig. 11 (A) Photogenerated current–time curves and (B) photoluminescence spectra of CN and GQDs/CN composites. | ||
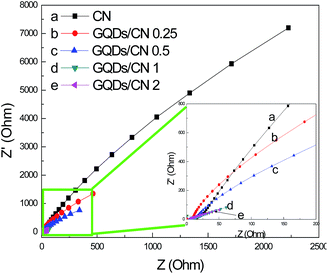
As we know, graphene is an excellent material with high conductivity. When graphene is combined with another semiconductor, the electron transfer ability of the semiconductor can be enhanced greatly, so the photogenerated electrons of the semiconductor would be shifted by graphene quickly, reducing the recombination with photogenerated holes. The conductivity of a semiconductor material can be assessed by an EIS method through coating the semiconductor powder on conductive glass. To assess the conductivity differences of the CN before and after GQD modification, we coated these powder photocatalysts on fluorine-doped tin oxide (FTO) conducting glass, and tested the EIS curves of these materials. The results are shown in Fig. 12. From these results we can find that the arc resistance of CN is very large, indicating that the electron transfer capacity of CN is very weak. However, the arc resistances of the GQDs/CN composites decreased after the modification with GQDs, and the degree of decrease enlarged with a further increase in the number of GQDs added. This phenomenon indicates that being analogous to graphene, GQDs are a good conductor. So when GQDs are composited with CN, the conductivity of the compound can be improved efficiently, and improved continuously with an increasing number of GQDs.
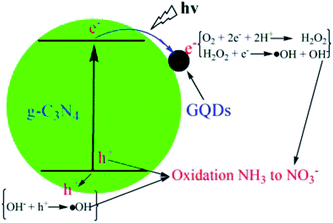
Fig. 13 shows the proposed mechanism for a photocatalytic NH3 removing process by GQD-modified g-C3N4. When the GQDs are loaded on the surface of the g-C3N4, the photon adsorption capacity and electron conductivity of this photocatalyst are improved, meaning that more photogenerated carriers could be formed during light illumination. In addition, the separation efficiency of the carriers could be enhanced with an increase in the conductivity. The photogenerated electrons would transfer from g-C3N4 to the GQDs and quickly react with the dissolved oxygen to form ˙OH radicals through two steps. At the same time, the photogenerated holes would transfer to the surface of the g-C3N4 and oxidate OH− to form ˙OH radicals. Lastly, the ˙OH radicals and h+ would participate in the reaction of NH3 oxidation and transfer to inorganic NO3− and a trace amount of NO2−.
Conclusion
In this article, we prepared g-C3N4 and GQD-modified g-C3N4 composite photocatalysts, and assessed the photocatalytic ammonia degradation properties of them. The SEM, XRD and XPS results indicated that the morphology and composition of g-C3N4 was not changed after the GQD modification. However, the photon adsorption capacity and electron transfer ability of g-C3N4 were improved after GQD loading. The photocatalytic NH3 degradation performance of g-C3N4 improved dramatically after GQD modification with an added content of 0.5 wt%. A 90% TAN removing rate was achieved after 7 hours of illumination with this composite photocatalyst, which was approximately 3 times higher than that of pure g-C3N4. Furthermore, as the oxygen concentration and pH value of the reaction solution was increased, the photocatalytic ammonia degradation performance improved. In addition, when the GQDs/CN0.5 composite served as a photocatalyst, the main photocatalytic degradation end-product of NH3 was NO3−, and the productive rate of toxic NO2− was very low. So, it is a green and highly efficient method to treat environmental NH3 pollution.Conflicts of interest
There are no conflicts to declare.Acknowledgements
The Research Fund of the State Key Laboratory for Marine Corrosion and Protection of the Luoyang Ship Material Research Institute (LSMRI) under the contract No. KF160413.References
- E. J. W. Crossland, N. Noel, V. Sivaram, T. Leijtens, J. A. Alexander-Webber and H. J. Smith, Nature, 2013, 495, 215 CrossRef CAS PubMed.
- T. Hisatomi, J. Kubota and K. Domen, Chem. Soc. Rev., 2014, 43, 7520 RSC.
- H. Huo, H. Lin, Y. Dong, H. Cheng, H. Wang and L. Cao, J. Hazard. Mater., 2012, 292, 229 Search PubMed.
- F. N. Ahmed and C. Q. Lan, Desalination, 2012, 287, 41 CrossRef CAS.
- H. Huang, Q. Song, W. Wang, S. Wu and J. Dai, J. Environ. Manage., 2012, 101, 68 CrossRef CAS PubMed.
- A. R. Ricardo, G. Carvalho, S. Velizarov, J. G. Crespo and M. A. M. Reis, Water Res., 2012, 46, 4556 CrossRef CAS PubMed.
- Y. Dong, Z. Bai, R. Liu and T. Zhu, Catal. Today, 2007, 126, 320 CrossRef CAS.
- H. Kominami, H. Nishimune, Y. Ohta, Y. Arakawa and T. Inaba, Appl. Catal., B, 2012, 297, 111 Search PubMed.
- C. Stoquart, P. Servais, P. R. Berube and B. Barbeau, J. Membr. Sci., 2012, 1, 411 Search PubMed.
- M. Altomare, G. L. Chiarello, A. Costa, M. Guarino and E. Selli, Chem. Eng. J., 2012, 191, 394 CrossRef CAS.
- D. Wang, L. Xiao, Q. Luo, X. Li, J. An and Y. Duan, J. Hazard. Mater., 2011, 192, 150 CrossRef CAS PubMed.
- Y. Shavisi, S. Sharifnia, S. N. Hosseini and M. A. Khadivi, J. Ind. Eng. Chem., 2014, 20, 278 CrossRef CAS.
- Y. Zhang, Q. B. Ma, L. Gao and E. J. M. Hensen, Appl. Surf. Sci., 2013, 282, 174 CrossRef CAS.
- K. T. Ranjit and B. Viswanathan, J. Photochem. Photobiol., A, 2003, 154, 299 CrossRef CAS.
- Z. T. Hu, S. K. Lua and T. T. Lim, ACS Sustainable Chem. Eng., 2015, 3, 2726 CrossRef CAS.
- Q. Sun, K. Lv, Z. Zhang, M. Li and B. Li, Appl. Catal., B, 2015, 164, 420 CrossRef.
- S. C. Yan, Z. S. Li and Z. G. Zou, Langmuir, 2010, 26, 3894 CrossRef CAS PubMed.
- Y. Bu and Z. Chen, Electrochim. Acta, 2014, 144, 42 CrossRef CAS.
- L. Liu, Y. Qi, J. Hu, Y. Liang and W. Cui, Appl. Surf. Sci., 2015, 351, 1146 CrossRef CAS.
- J. Liu, Y. Liu, N. Liu, Y. Han, X. Zhang, H. Huang, Y. Lifshitz, S. T. Lee, J. Zhong and Z. Kang, Science, 2015, 347, 970 CrossRef CAS PubMed.
- K. Li, F. Y. Su and W. D. Zhang, Appl. Surf. Sci., 2016, 375, 110 CrossRef CAS.
- K. Maeda, X. Wang, Y. Nishihara, D. Lu, M. Antonietti and K. Domen, J. Phys. Chem. C, 2009, 113, 4940 CAS.
- J. S. Zhang, X. F. Chen, K. Takanabe, K. Maeda, K. Domen, J. D. Epping, X. Z. Fu, M. Antonietti and X. C. Wang, Angew. Chem., Int. Ed., 2010, 49, 441 CrossRef CAS PubMed.
- S. Zhu, J. Zhang, X. Liu, B. Li, X. Wang, S. Tang, Q. Meng, Y. Li, C. Shi, R. Hu and B. Yang, RSC Adv., 2012, 2, 2717 RSC.
- D. Tang, H. Zhang, H. Huang, R. Liu, Y. Han, Y. Liu, C. Tong and Z. Kang, Carbon quantum dots enhance the photocatalytic performance of BiVO4 with different exposed facets, Dalton Trans., 2013, 42, 6285 RSC.
- X. H. Li, J. S. Chen, X. Wang, J. Sun and M. Antonietti, J. Am. Chem. Soc., 2011, 133, 8074 CrossRef CAS PubMed.
- W. Wang, J. C. Yu, D. Xia, R. K. Wong and Y. Li, Environ. Sci. Technol., 2013, 47, 8724 CrossRef CAS PubMed.
- W. S. Hummers and R. E. Offeman, J. Am. Chem. Soc., 1958, 80, 1339 CrossRef CAS.
- T. Xu, L. Zhang, H. Cheng and Y. Zhu, Appl. Catal., B, 2011, 101, 382 CrossRef CAS.
- H. Yuzawa, T. Mori, H. Itoh and H. Yoshida, J. Phys. Chem. C, 2012, 116, 4126 CAS.
Footnote |
| † Electronic supplementary information (ESI) available. See DOI: 10.1039/c7ra07988e |
| This journal is © The Royal Society of Chemistry 2017 |

