 Open Access Article
Creative Commons Attribution 3.0 Unported Licence
Investigation of SO2 tolerance of Ce-modified activated semi-coke based catalysts for the NO + CO reaction†
Zhiqiang Wanga,
Luyuan Wang*a,
Xingxing Cheng *a,
Chunyuan Maa and
Yukun Qinab
aNational Engineering Lab for Coal-fired Pollutants Emission Reduction, Shandong Provincial Key Lab of Energy Carbon Reduction and Resource Utilization, Shandong University, Jinan, China 250061. E-mail: xcheng@sdu.edu.cn; luyuanwang1988@gmail.com
bSchool of Power Engineering, Harbin Institute of Technology, Harbin, China 150001
First published on 22nd November 2017
Abstract
Activated semi-coke was loaded with Fe–Co mixed oxides and doped with an optimized amount of cerium oxides. This prepared catalyst exhibited excellent NO removal (deNO) activity, and also showed outstanding SO2 resistance at 250 °C. To understand the SO2 tolerance mechanism, the catalysts were characterized by scanning electron microscopy, energy-dispersive X-ray spectroscopy, X-ray diffraction, in situ Fourier-transform infrared spectroscopy, H2-temperature-programmed reduction, and SO2-temperature-programmed desorption, as well as CO–deNO activity testing under different conditions. The results indicate that the Ce (molar ratio = 0.1) doped onto the Fe–Co binary oxide catalysts would promote the generation of Ce2(SO4)3. This generation could prevent the active metal oxides from being poisoned by SO2. Furthermore, this kind of sulfate would weaken the interaction between SO2 and NO, so that the adsorbed NO will have a better opportunity to react with CO.
1. Introduction
Selective catalytic reduction of NOx with NH3 (NH3-SCR) has proven to be the most effective process for removing NOx from stationary sources and diesel engines.1–3 Moreover, it is presently the most applied method for NOx removal in power plants.1,4 However, the NH3-SCR process has some disadvantages, such as NH3 leaks, the toxicity of vanadium catalysts, and use of air preheater blocks.5,6 Recently, researchers have proposed that the leaked NH3 will interact with SO2 to form (NH4)2SO4. This sulfate evolves in the natural atmosphere; furthermore, it is a major contributor to the formation of Chinese haze.7 Therefore, it is extremely urgent to provide a substitute for the NH3-SCR process.Among the processes for NOx removal from vehicle exhaust, selective catalytic reduction with hydrocarbon (HC-SCR)6 and three-way catalyst technology (TWC)8 have been widely investigated. These technologies make almost no contribution to the NH3 leaks. If these could be applied to the NOx elimination process in power plants, the Chinese haze could be alleviated. In recent years, researchers have begun to focus on investigations such as these.9–12 However, the application of the new processes has faced some difficulties: one is that the presence of O2 will consume the majority of the reductant.10–12 Therefore, in consideration of the negative effects of O2, the NOx adsorption–reduction process (model reactor in Fig. S1†) was proposed by Professor Bi.10–12 This technology could also achieve high deNOx efficiency. Developed from the TWC process, CO–deNOx is very suitable for NOx adsorption–reduction. This is because CO is inexpensive, can easily be produced, and cannot generate solid carbon deposits10,13 upon reaction with NO. It is widely reported that transition metal oxides could catalyze the NO + CO reaction efficiently. In fact, Cu-,14–19 Co-,20–22 Fe-,13 Ni-,23 and Mn-based14,24 oxides, as either loaded or non-loaded catalysts, exhibit excellent CO–deNO efficiency at temperatures between 150 and 300 °C. Furthermore, CeO2, SnO2, or ZrO2 mixed with transition metals and carbon supported metal catalysts also promote the efficient reaction of CO with NO.17,25–27 As for the mechanism of the NO + CO reaction, it is established that at relatively low temperatures, NO coordinates with the metal cation and generates nitrites.5,13,28 Subsequently, the formed nitrites can react with CO to yield N2O and CO2.5,28 However, as the temperature increases, the coordinated NO is transformed to nitrates that react with CO, generating N2 and CO2.5,13,27,28 In our previous study, CO–deNO (catalyzed by semi-coke based catalysts) were applied to a NOx adsorption–reduction process, and the deNO efficiency was relatively high.5,9,27 However, in this process, SO2 can be adsorbed onto the adsorbents more easily than NO.5 Even if the deNO reactors are placed downstream of the desulfurization equipment, there is an appreciable quantity of SO2 in the flue gas, which can severely decrease the deNO activity. As shown in our previous studies,5,28 the addition of SO2 reduces NO conversion by approximately 60% at 250 °C, and the coordinated SO2 induced the reversible catalyst deactivation. Therefore, the improvement of SO2 resistance for semi-coke based catalysts should be investigated.
As for the deactivation of catalysts caused by SO2, the most accepted theses are as follows: (1) the competitive adsorption between NO and SO2 can result in no active sites being available for NO on the catalyst surface;29 (2) SO2 can easily occupy the acid site that is the vital point for NH3-SCR;1,30 (3) the interaction of SO2 and H2O can generate some surface sulfates; for instance, Mn,30 Cu,31 Co32 oxides are very actively drawn to SO2; therefore, the SO2 present will easily transform these oxides to sulfates; and (4) the formation of (NH4)2SO4 or NH4HSO4 (NH3-SCR) will accumulate on the surface, which would reduce the available surface area and then deactivate the catalysts.33,34 Therefore, to understand the SO2 poisoning mechanism, researchers have focused on the investigation on the SO2 tolerance of deNOx catalysts. Until now, breakthroughs in the investigation of SO2 resistance have occurred in two domains, viz. the doping of SO2 resistant metals onto active metals and the optimization of the micro-structure. From wide study, it is known that the doping of Ti-,32,35 Zr-,36 Sn-,37 Ce-,2,33 oxides onto the SCR catalysts as active components or supporters can reduce the thermal stability of the surface sulfates. The excellent decomposing performance of surface sulfates is the vital factor for SO2 resistance.2 Recently, it was established that SO2 could directionally accumulate on the surface of CeO2 affording some bulk-like sulfates,1,2 which would be beneficial for NO reacting with the active metals. As for the micro-structure optimization, researchers invented mipor supporters like SSZ-13.38–40 The pore size of these supports is smaller than the molecular vibration radius of SO2, but larger than that of NOx, which can prevent the generation of surface sulfates.
In the present study, based on the previous investigation on the SO2 tolerance of activated semi-coke based catalysts,5 we co-impregnated Ce and Fe–Co binary oxides onto the coke based supports using a hydrothermal method. The CO–deNO results demonstrate that Ce doping can increase the SO2-resistant performance. A variety of methods were used to obtain insight into the mechanism, including scanning electron microscopy (SEM), X-ray diffraction (XRD), X-ray photoelectron spectroscopy (XPS), N2 physisorption, temperature-programmed reduction of hydrogen (H2-TPR), and temperature-programmed desorption of SO2 (SO2-TPD). The evolution of surface components was also detected by in situ diffuse reflectance infrared Fourier transform spectroscopy (DRIFTS).
2. Experiments
2.1 Catalysts preparation
Commercial semi-coke (Shaanxi Shenmu Coal Mine Co., Ltd., China) was first ground and sieved into granules with diameters of 1.02–1.27 mm (labeled SC). Second, the SC particles were activated using nitric acid (30 wt%) at 80 °C for 2 h. Next, after the particles had been washed with deionized water, they were dried at 120 °C for 6 h, followed by calcination in Ar at 700 °C for 4 h (labeled ASC).The supports (ASC) were loaded with transition metals using a hydrothermal method: ferric nitrate, cobalt nitrate, and cerium nitrate (analytical-reagent grade, Sinopharm Chemical Reagent Co., Ltd.) were first dissolved in deionized water for use as precursors. Table 1 summarizes the loading-amount parameters of the prepared catalysts. Then, ASC (5 g) immersed in 30 mL of the precursor was transferred to a stainless-steel autoclave. The autoclave was maintained at 160 °C for 24 h. Next, the activated coke particles were washed using deionized water and then dried at 120 °C for 6 h, followed by calcination in Ar at 700 °C for 4 h.
| Catalysts | Concentration of Fe(NO3)3 (mol L−1) | Concentration of Co(NO3)3 (mol L−1) | Concentration of Ce(NO3)3 (mol L−1) |
|---|---|---|---|
| Fe0.8Co0.2/ASC | 1.653 | 0.413 | |
| Fe0.8Co0.2Ce0.05/ASC | 1.653 | 0.413 | 0.103 |
| Fe0.8Co0.2Ce0.1/ASC | 1.653 | 0.413 | 0.207 |
| Fe0.8Co0.2Ce0.2/ASC | 1.653 | 0.413 | 0.413 |
2.2 Characterization
The textural properties were evaluated by physical adsorption of N2 at 77 K using an automatic surface analyzer (Quantachrome Autosorb 1C), and the specific surface areas and pore volumes were calculated using density functional theory (DFT) from the N2 ad-/de-sorption isotherms. XRD detection was performed on a Rigaku D/max 2400 diffractometer using Cu-Kα radiation (λ = 1.5056 Å) at a scanning rate of 8° min−1 with a step size of 0.02° over a 2θ range of 10–80°. The surface atomic states of the catalysts were analyzed using XPS (Axis UltraDLD) with Al-Kα radiation (hν = 1486.7 eV, 225 W, 15 mA, 15 kV). The binding energies were calibrated using the C 1s peak at 284.5 eV as a reference, and experimental data were fitted with a Gaussian–Lorentzian mixed function as implemented in the Origin software. H2-TPR (SO2-TPD) was performed using a Chemisorb instrument (Chembet Pulsar TPR/TPD 2139). These tests were conducted using a quartz U-type reactor, which was connected to a thermal conductivity detector. The module reductant gas was composed of 10 vol% H2 balanced by Ar at a flow rate of 40 mL min−1. Before the reduction, the sample (100 mg) was pretreated in a He stream at 300 °C for 1 h, and then TPR was heated from room temperature to 900 °C at a rate of 10 °C min−1. As for the TPD, before the test, the sample (100 mg) was pretreated in a He stream at 300 °C for 1 h to eliminate surface impurities. The adsorption of SO2 was performed at room temperature. In this process, the samples were first treated with SO2 (5 vol%, 40 mL min−1) for 2 h to reach saturation. Second, samples were purified using He (40 mL min−1) for 1 h, and then TPD was started at room temperature and heated to 1100 °C at a rate of 5 °C min−1.In situ DRIFTS spectra were recorded from 650 cm−1 to 4000 cm−1 at a spectral resolution of 4 cm−1 (number of scans, 100) on a Nicolet 6700 FTIR spectrophotometer equipped with a high-sensitivity MCT detector cooled by liquid N2. The DRIFTS cell (Pike) was fitted with a ZnSe window and heating cartridge, which permits the heating of the sample to 500 °C. Before the performance, all the samples were ground into fine powder (<2 μm) and diluted with KBr. The dilution factor was approximately 150. Then the powder (approximately 25 mg) was placed on a sample holder and carefully flattened for IR reflection. The sample was pretreated with a high-purity Ar stream at 400 °C for 1 h to eliminate the physically absorbed water and other impurities. At each target temperature, the sample background was collected during cooling. For the steady state response, at each desired temperature, the sample was exposed to a controlled stream of 200 ppm SO2 and/or 1000 ppm NO balanced by Ar at a flow rate of 100 mL min−1 for 0.5 h for saturation. For the transient response, the spectra were continuously collected in synchrony with the reaction time under each desire condition. The spectra were recorded at various target temperatures by subtracting the corresponding background reference.
2.3 Catalytic activity testing
The activity of the catalysts was investigated in a fixed-bed reactor system, which consisted of a stainless steel tubular reactor (internal diameter: 12.7 mm), a gas supply and flow rate control unit (mass flow meter, Beijing Sevenstar Huachuang Electronics Co., Ltd.), a gas heating unit (Shandong Lulong furnace factory), and a gas analysis unit (GASMET DX4000, Finland). First, 2 g (approximately 5 cm3) of the sample was loaded into the reactor and pretreated with N2 at 300 °C for 1 h to activate the samples and eliminate the surface impurities, followed by cooling to room temperature. The total flow rate of the mixed gas was 500 mL min−1 (GHSV = 6000 h−1). The modeled flue gas was nitrogen, 1% NO balanced by N2, 2% CO balanced by N2, and 5000 ppm SO2 balanced by N2 (Deyang Gas, Ltd.). Tests under each reaction condition were completed after more than 1 h, until a steady state had been reached, and the data were collected after the outlet concentration had reached a steady state. The NO conversion and N2O selectivity were calculated from concentrations of the inlet and outlet flue gases using eqn (1).
 | (1) |
 | (2) |
3. Results and discussion
3.1 Catalytic activity
DeNO efficiency is an important factor for evaluating the catalyst activity. Therefore, we determined the deNO efficiency of the prepared catalysts, and the results are displayed in Fig. S2† and 1. As shown in Fig. S2(a),† it can be observed that Fe0.8Co0.2/ASC exhibits excellent deNO performance in the temperature range of 150–300 °C. At 150 °C, the NO conversion has reached to approximate 50%. When the temperature is above 200 °C, the conversion remains at a steady state: approximately 96–98%. With the addition of cerium oxides, the deNO efficiency obviously decreases. The sample Fe0.8Co0.2Ce0.05/ASC shows the lowest NO conversion. In the temperature range of 150–250 °C, the NO conversion for Fe0.8Co0.2Ce0.05/ASC is about 80% of that for Fe0.8Co0.2/ASC. Moreover, the efficiency for Fe0.8Co0.2Ce0.1/ASC and Fe0.8Co0.2Ce0.2/ASC is in between. As we previously proposed,5 the excellent deNO efficiency depends on the optimizing crystalline cell and the interaction of Fe–Co. It is speculated from the decrease of NO conversion, that Ce addition can affect the optimization of the Fe–Co crystalline cell to some extent. This could be established by analysis of the ICP results: the doping of Ce induces variation of the loading of Fe and Co (in Table S1†). Moreover, it can be observed that the molar ratio of Fe![[thin space (1/6-em)]](https://www.rsc.org/images/entities/char_2009.gif) :
:![[thin space (1/6-em)]](https://www.rsc.org/images/entities/char_2009.gif) Co for Fe0.8Co0.2Ce0.1/ASC is very close to that of Fe0.8Co0.2/ASC, which should be responsible for the excellent deNO activity. Fig. S2(b)† shows the N2O selectivity of the prepared catalysts. It can be observed that Ce addition to the surface of ASC can increase the degree of N2O selectivity in the range of 150–200 °C. This is corresponding to that of NO conversion testing, i.e., at low temperature, low NO conversion indicating the high N2O selectivity.27 However, as the temperature increases, the N2O will be decomposed to N2.
Co for Fe0.8Co0.2Ce0.1/ASC is very close to that of Fe0.8Co0.2/ASC, which should be responsible for the excellent deNO activity. Fig. S2(b)† shows the N2O selectivity of the prepared catalysts. It can be observed that Ce addition to the surface of ASC can increase the degree of N2O selectivity in the range of 150–200 °C. This is corresponding to that of NO conversion testing, i.e., at low temperature, low NO conversion indicating the high N2O selectivity.27 However, as the temperature increases, the N2O will be decomposed to N2.
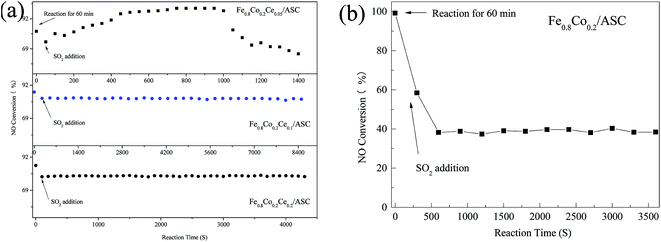 | ||
| Fig. 1 NO conversion of catalysts. Reaction conditions: 2000 ppm CO, 1000 ppm NO, 200 ppm SO2 and balance by N2, at 250 °C, GHSV = 6000 h−1. | ||
Although, the addition of cerium oxides can reduce the deNO efficiency, the SO2 resistance of the catalysts doped by Ce increases. Fig. 1 shows the effect of SO2 on the deNO activity. It can be found that for Fe0.8Co0.2Ce0.05/ASC, when 200 ppm of SO2 is introduced into the dry flue gas, the NO conversion first decreases and then increases: ∼80% → ∼70% → ∼95% (in Fig. 1(a)). The first decreasing is speculated to be ascribed to the competitive adsorption between SO2 and NO, according to the previous literature. After 1000 s of reaction, the NO conversion begins to decrease until reaching steady state at ∼55%; whereas, the SO2 resistance for Fe0.8Co0.2Ce0.1/ASC and Fe0.8Co0.2Ce0.2/ASC are similar. After introduction of SO2, the NO conversion slightly decreases; then remains steady. For Fe0.8Co0.2Ce0.1/ASC, the steady conversion rate is approximately 80%, while that for Fe0.8Co0.2Ce0.2/ASC is ∼75%. When the Ce doped samples are compared with Fe0.8Co0.2/ASC (Fig. 1(b)), it is easy to see that the doping of cerium oxides can improve the SO2 tolerance.
As for the reason for the SO2 tolerance improvement, it is speculated that a small amount of cerium oxide (Fe0.8Co0.2Ce0.05/ASC) may induce gaseous SO2 to adsorb to its surface. The adsorbed SOx can generate some acid sites beneficial for the reaction of NO + CO. Nevertheless, when the amount of adsorbed SOx increases to a threshold degree, surface sulfates may be produced that will result in the decrease of NO conversion. With the doping amount of cerium oxides increasing, the adsorbed SOx may transform to bulk-like sulfates1,2 on CeO2 that will have little influence on the active components (Fe and Co). The evident mechanism will be discussed in the Characterization section.
3.2 Surface morphology and textural parameters of the prepared catalysts
Fig. 2 displays the SEM images of the samples, viz., Fe0.8Co0.2/ASC and the Ce doped catalysts. As shown in Fig. 2(a), it can be observed that uniform spherical clusters are produced on the surface of Fe0.8Co0.2/ASC. With the doping of Ce, the sizes of the clusters begin to differentiate (Fig. 2(b)). When the molar ratio of cerium is ≥0.1, a very obvious accumulation phenomenon is observed. That is, the spherical clusters serry on the surface of ASC (Fig. 2(c)). Moreover, as the ratio is equal to 0.2, a block-like structure appears on the surface (Fig. 2(d)). It is speculated that with the increasing of the loaded metal oxides, the ACS surface structure will be occupied by the metal crystal. The reduction of the available surface area leads to an accumulation phenomenon. The results in surface morphology that is very similar to that in the N2 physisorption. Table 2 summarizes the textural parameters of the prepared catalysts. It can be observed that the average pore size and surface area decrease obviously with increase in the loading amount of the cerium oxides. However, as the molar ratio of cerium is 0.1, the value of the average pore volume increases to 0.61 cm3 g−1. Maybe this is responsible for the improvement of the SO2 tolerance.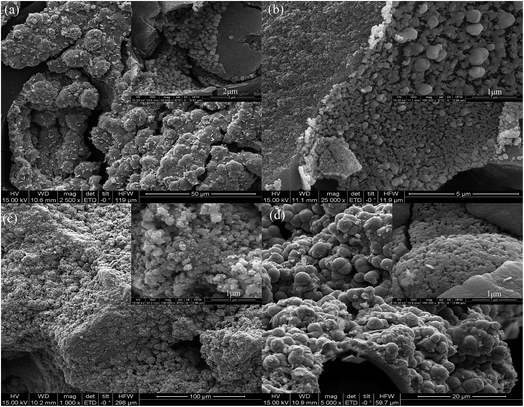 | ||
| Fig. 2 SEM images of catalysts: (a) Fe0.8Co0.2/ASC; (b) Fe0.8Co0.2Ce0.05/ASC; (c) Fe0.8Co0.2Ce0.1/ASC; (d) Fe0.8Co0.2Ce0.2/ASC. | ||
| Catalysts | Average pore width (nm) | Pore volume (cm3 g−1) | Specific surface area (m2 g−1) |
|---|---|---|---|
| Fe0.8Co0.2/ASC | 2.14 | 0.59 | 272.096 |
| Fe0.8Co0.2Ce0.05/ASC | 2.08 | 0.56 | 263.021 |
| Fe0.8Co0.2Ce0.1/ASC | 1.94 | 0.61 | 259.996 |
| Fe0.8Co0.2Ce02/ASC | 1.83 | 0.57 | 233.986 |
3.3 XRD analysis of the prepared catalysts
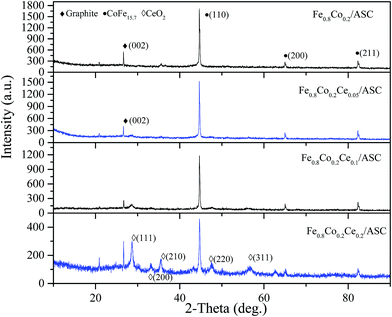
In order to obtain the correlation of the SO2 tolerance with the surface metal crystal, XRD was performed. Fig. 3 shows the XRD patterns of the catalysts. As shown in Fig. 3, for all samples, a diffraction peak is observed at approximately 25–30°, which is a peak characteristic of the (002) crystal face of graphite (JCPDF = 13-0148). In addition, a characteristic peak (at approximate 45°) for the (110) crystal face of CoFe15.7 (JCPDF = 65-7519) is found for these four samples. This indicates that the major active component (CoFe15.7 (ref. 5)) is not changed by the doping of Ce. Notably, it can be also observed that there are no characteristic peaks of cerium oxides when the molar ratio of Ce is 0.05. When the ratio increases to 0.1, a peak appears at approximately 28°, which should be assigned to the characteristic peak for the (111) crystal face of CeO2 (JCPDF = 82-0661). Moreover, the intensity of this peak increases to some extent with the loading amount of CeO2. As the ratio of Ce is 0.2, the sample shows the characteristic peaks for the (200), (220), and (311) crystal faces of CeO2. Comparing the degree of the intensity for the (110) crystal face of CoFe15.7, it can be observed that the introduction of Ce can reduce the intensity of this peak. That indicates the crystallization properties of CoFe15.7 are diminished. This is speculated to be responsible for the slight decrease in the deNO activity.3.4 H2-TPR and SO2-TPD analysis
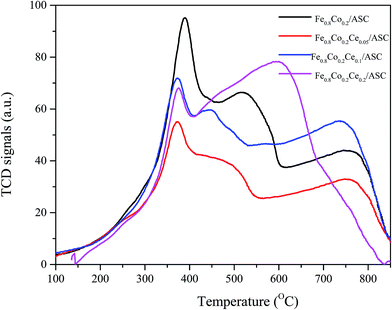
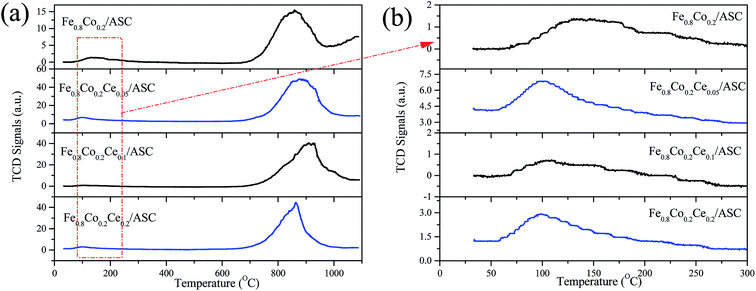
H2-TPR is performed to investigate the reduction behavior of the catalyst surface components. Fig. 4 shows the TPR profiles of the prepared catalysts. It can be observed that for all samples, there is a main peak at approximately 378 °C. As we previously determined, this peak should be attributed to the interaction of Fe and Co oxides.5,41,42 This result corresponds to the XRD analysis results (i.e., the major active component is CoFe15.7). Additionally, along with the main peak, a shoulder peak is observed for each of the four samples. We can also see that the addition of Ce could change the position of this peak to a lower temperature. For Fe0.8Co0.2/ASC, the broad shoulder peak appears at approximate 520 °C, while for Fe0.8Co0.2Ce0.1/ASC, the central temperature of this peak is about 450 °C. It is speculated that the doping of Ce into the Fe–Co binary oxides can improve the activity of the low valent transition metal. However, for Fe0.8Co0.2Ce0.2/ASC, this shoulder peak is mixed with a higher temperature peak. This overlap peak can be decomposed into two peaks: one at approximate 450 °C; the other at 625 °C. For the other three samples, the highest temperature peak appears at ∼780 °C. It is speculated that this peak is assignable to the complex components of solid carbon and metal oxides, while for Fe0.8Co0.2Ce0.2/ASC, the peak at 625 °C should be ascribed to the excellent redox performance of CeO2. In conclusion, it can be seen that Ce doping can improve the reduction behavior of the low valent metal cation, which may be beneficial for SO2 tolerance.SO2-TPD is a significant method for investigating the SO2 resistance of CO–deNO catalysts. Fig. 5 shows the TPD profiles of the prepared catalysts. It is observable that for Fe0.8Co0.2/ASC, a main peak appears at approximately 850 °C. Along with the main peak, a broad weaker peak is also detected at ∼130 °C. As reported,43 the ferric sulfates has a decomposition temperature of 600–800 °C, while the temperature for the cobalt sulfates is approximately 1200 °C. According to our previous research,5 the interaction between Fe and Co changes the position of the main peak to ∼850 °C. The low temperature peak should be ascribed to desorption of coordinated SO2. Furthermore, for the other three samples, similar peaks are observed. However, the central temperatures of these peaks show some differentiation. It is easily seen that the position of the low temperature peak shifts to the left with the introduction of Ce at approximately 100 °C. This phenomenon indicates that CeO2 on the surface could improve desorption of coordinated SO2. Besides, the intensity of the low temperature peak for Fe0.8Co0.2Ce0.05/ASC is stronger than that for other two catalysts, this demonstrated there is more amount of SO2 adsorbing, i.e. the competitive adsorption of NO + SO2 inevitably exists in the initial seconds. However, the high temperature peak shows a reverse trend (i.e., the central temperature shifts to the right). For Fe0.8Co0.2Ce0.05/ASC, the temperature of the peak's maximum is ∼880 °C, while this temperature shifts to ∼910 °C for Fe0.8Co0.2Ce0.1/ASC. Nevertheless, when Ce molar ratio increases to 0.2, this temperature shifts to 850 °C. As reported in the literatures,33,44,45 Ce(SO4)2 shows a decomposition peak at approximate 750 °C, while Ce2(SO4)3 has decomposition peaks at 900 °C. Therefore, we can speculate that when Ce is added into the catalyst, it will introduce some interactions among the metals. These interactions will produce different kinds of sulfates with SO2 added into the flue gas. Compared the decomposition temperature of the sulfates, it is reasonable to demonstrate that the left shift is attributed to the generation of Ce2(SO4)3. The abnormal phenomenon for Fe0.8Co0.2Ce0.2/ASC is attributed to the interaction between Ce(SO4)2 and Ce2(SO4)3, because on the surface of Fe0.8Co0.2Ce0.2/ASC, there should be more kinds of cerium sulfates. Owing to the excellent thermal stability, and rejection for SO2, Ce2(SO4)2 has been proved to improve SO2 resistance of the catalysts.2,33 Moreover, in the atmosphere of simulated flue gas, the generation of Ce2(SO4)3 occurs faster. Therefore, we speculate that on the surface of Fe0.8Co0.2Ce0.1/ASC, there is a larger amount of Ce2(SO4)3. The rapidly generated Ce2(SO4)3 could inhibit the SO2 poisoning of the active components.
3.5 XPS analysis
To demonstrate the opinion we obtained in Section 3.4, we carried out XPS on the surface components. Fig. 6–9 show the XPS results of Fe, Co, Ce, and S; and in addition, the percentages of the surface components are summarized in Table S3.† In these figures, the label “Fresh” indicates catalysts without pretreatment, the label “SO2-pretreated” represents samples purged with 200 ppm of SO2 for 1 h at 250 °C, and the label “SO2 + NO” indicates samples pretreated by 200 ppm SO2 + 1000 ppm NO for 1 h at 250 °C. As shown in Fig. 6, we decomposed the overlapped peaks into three, viz. Fe3+ at approximate 713.5 eV, Fe2+ at ∼711 eV, and the satellite peak of Fe2+ at ∼718.5 eV.46–48 It can be observed that for the Fe0.8Co0.2/ASC, the percentage of the significant component-Fe3+ is about 46.49%. Moreover, this percentage first increases and then shows a trend of decrease with increasing amount of Ce loaded. This is because even a small amount of Ce can induce an increase in the oxygen releasing performance, while a larger amount of Ce will generate more cerium oxide crystals. The producing of crystals can consume the oxidation performance. The SO2 pretreatment of the catalysts results in a decrease of the Fe3+ percentage for Fe0.8Co0.2/ASC, Fe0.8Co0.2Ce0.05/ASC, and Fe0.8Co0.2Ce0.1/ASC, but an increment for Fe0.8Co0.2Ce0.2/ASC. It is speculated that the sulfates on the surface can attract some electrons from FeOx. However, with increasing load of cerium, larger amounts of electrons will come from CeO2, due to its excellent redox performance.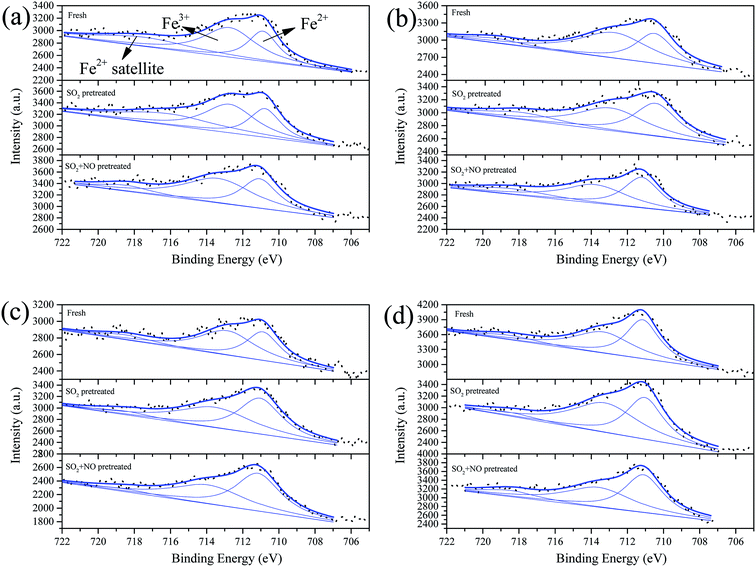 | ||
| Fig. 6 Fe 2p3/2 from XPS spectra of catalysts (a) Fe0.8Co0.2/ASC, (b) Fe0.8Co0.2Ce0.05/ASC, (c) Fe0.8Co0.2Ce0.1/ASC, and (d) Fe0.8Co0.2Ce0.2/ASC, with different treatment. | ||
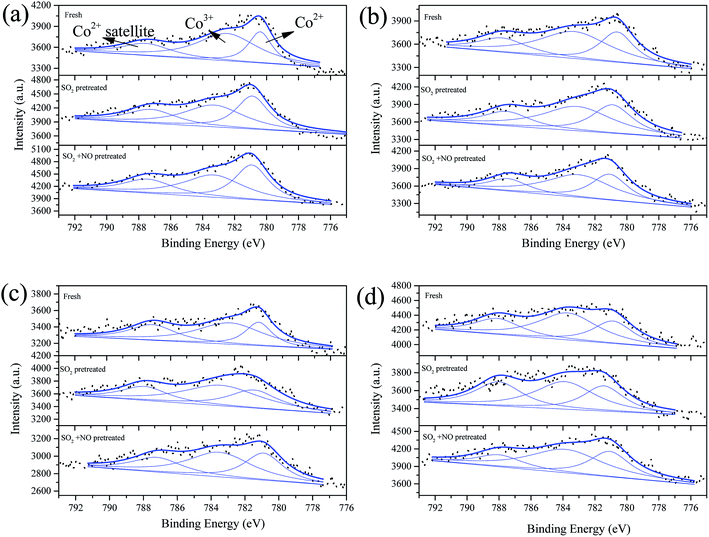 | ||
| Fig. 7 Co 2p3/2 from XPS spectra of catalysts (a) Fe0.8Co0.2/ASC, (b) Fe0.8Co0.2Ce0.05/ASC, (c) Fe0.8Co0.2Ce0.1/ASC, and (d) Fe0.8Co0.2Ce0.2/ASC, with different treatment. | ||
The co-addition of SO2 and NO to the reaction gas can induce an obvious decrease in the Fe3+ percentage for all samples, and may demonstrate that the presence of NO can promote the generation of SO42−. Similarly, the Co 2p3/2 overlapped curves were also decomposed into three peaks: Co3+ (783.5 eV), Co2+ (∼781 eV), and Co2+ satellite peak (∼788 eV).49,50 However, the percentages of Co3+ under different treatments remains stable for all samples (i.e., for the single sample, SO2 or NO + SO2 atmosphere has almost no influence on the percentage of Co3+). Otherwise, the addition of Ce can increase this percentage to some extent. Therefore, it is reasonable to establish that the poisoning mechanism of SO2 to Fe–Co catalysts is the decomposition of Fe–Co crystal. The decomposition is ascribed to the interaction of Fe3+ and SO42−.
Fig. 8 shows the Ce 3d curves of the prepared catalysts, and the binding energies of Ce 3d5/2 and Ce 3d3/2 are summarized in Table S2.†28 It can be observed for fresh Fe0.8Co0.2Ce0.05/ASC, that the percentage of Ce3+ is approximate 38.71%. When the molar ratio of Ce is 0.1, the Ce3+ percentage increases to 43.91%. However, if the molar ratio continues to increase, the percentage begins to decrease. Thus, it is established that the optimizing loading ratio of Ce is approximate 0.1. Furthermore, the pretreatment of SO2 and SO2 + NO can increase the percentage for Fe0.8Co0.2Ce0.05/ASC and Fe0.8Co0.2Ce0.1/ASC. We speculate that the increase is attributable to the generation of Ce2(SO4)3. Notably, for Fe0.8Co0.2Ce0.1/ASC, the influences of SO2 or SO2 + NO are relatively analogous. Therefore, it is established that the sample Fe0.8Co0.2Ce0.1/ASC can obtain stable CO–deNO activity in the presence of SO2. With regard to the sample Fe0.8Co0.2Ce0.2/ASC, the Ce3+ proportion is relatively low all through the different conditions. This may be due to the larger amount of Ce4+ ions produced by a larger amount of cerium oxides loaded.
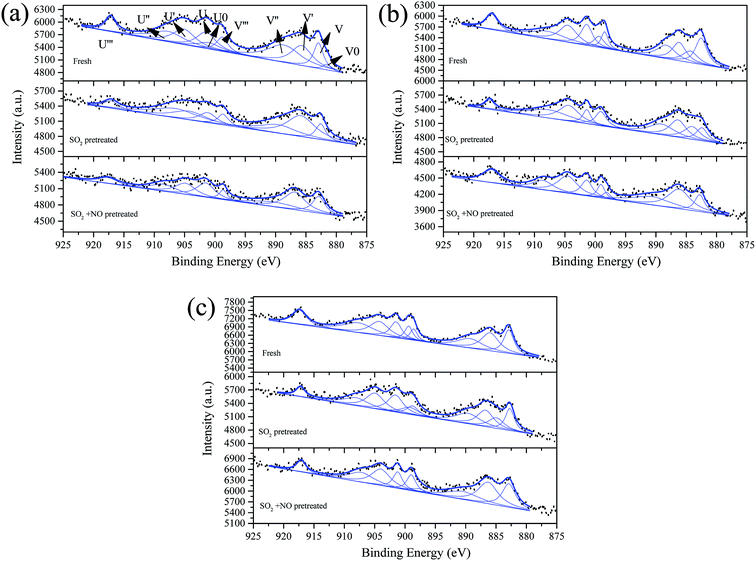 | ||
| Fig. 8 Ce 3d from XPS spectra of catalysts (a) Fe0.8Co0.2Ce0.05/ASC, (b) Fe0.8Co0.2Ce0.1/ASC, and (c) Fe0.8Co0.2Ce0.2/ASC, with different treatment. | ||
The S 2p curves are displayed in Fig. 9. As shown in this figure, it can be observed that except for Fe0.8Co0.2Ce0.1/ASC, the other three samples exhibit variations in the percentages of SO42− under different treatments (i.e., the introduction of NO can increase the SO42− proportion obviously). For Fe0.8Co0.2Ce0.1/ASC, the SO2-pretreated sample's percentage is 51.80%, while that of the SO2 + NO-pretreated sample is 52.08%. This slight variation corresponds to the analysis of the Ce3+ ion. This is reasonable to demonstrate that when the doping ratio of Ce is approximately 0.1, the excellent SO2 tolerance is ascribable to the generation of Ce2(SO4)3 accumulating in the surrounding cerium oxide lattice.
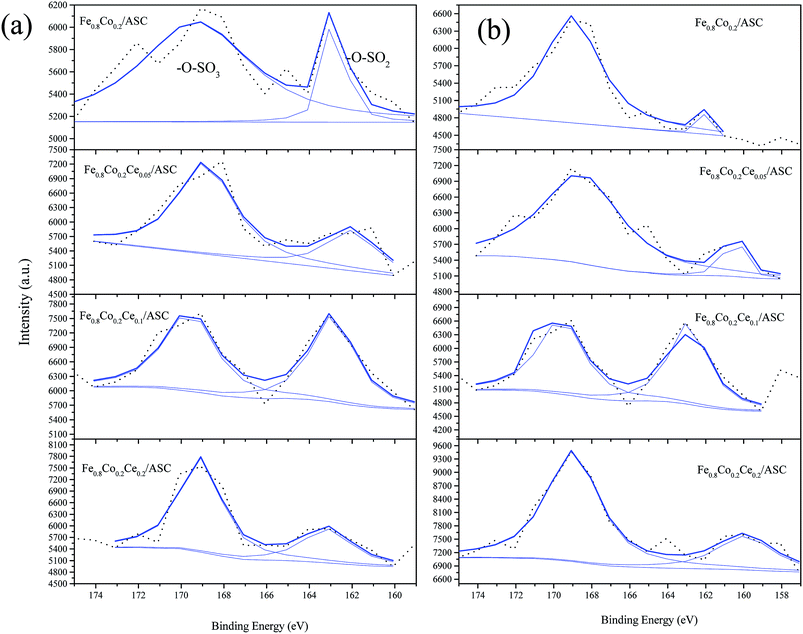 | ||
| Fig. 9 S 2p from XPS spectra of catalysts with different treatment: (a) 200 ppm SO2 pretreated at 250 °C; (b) 200 ppm SO2 + 1000 ppm NO pretreated at 250 °C. | ||
3.6 DRIFTS analysis
To investigate the interaction of surface sulfates with NO or the surface metal ion, in situ DRIFTS was performed. First, we investigated the interaction of SO2 and the catalyst surface. Fig. 10 shows the DRISTS spectra of the catalysts as a function of exposure time in a flow of 200 ppm SO2 at 250 °C. As shown in Fig. 10(a), after 1 min of SO2 exposure, there are several bands appearing at 1084 cm−1, 1140 cm−1, 1389 cm−1, 1535 cm−1, 1638 cm−1, and 1709 cm−1 for Fe0.8Co0.2/ASC. The bands at 1084 cm−1, 1140 cm−1 and 1389 cm−1, are assigned to νs(SO42−), νas(S![[double bond, length as m-dash]](https://www.rsc.org/images/entities/char_e001.gif) O) of bidentate sulfites, and ν(S
O) of bidentate sulfites, and ν(S![[double bond, length as m-dash]](https://www.rsc.org/images/entities/char_e001.gif) O) of surface sulfates with only one S
O) of surface sulfates with only one S![[double bond, length as m-dash]](https://www.rsc.org/images/entities/char_e001.gif) O bond,5,33,36 respectively. While, the bands in the wavenumber range of 1500–1750 cm−1 should be assigned to ν(SO42−) coordinated with Fe3+ or Cox+.33,36 Moreover, the bands at 1084 cm−1, 1140 cm−1 and 1389 cm−1 grow in intensity with exposure time until they become stable; whereas, the bands at 1535 cm−1, 1638 cm−1 and 1709 cm−1 vary inconsistently. The intensity of the band at 1535 cm−1 first decreases and then increases with time, while the positions of the other bands shift until the broad, strong peak appears at approximate 1680 cm−1. It is speculated that during this variation, the surface sulfates evolve with the reaction time, in order to keep a steady state. Contrasting with the results in Fig. 10(a), Fe0.8Co0.2Ce0.1/ASC shows fewer bands (Fig. 10(b)): only four obvious bands at 1112 cm−1, 1168 cm−1, 1389 cm−1 and 1587 cm−1. These bands will grow in intensity with time, but will not change positions. Therefore, we speculate that the sulfates on the surface of Fe0.8Co0.2Ce0.1/ASC are more purified (i.e., the major sulfates are cerous sulfates).
O bond,5,33,36 respectively. While, the bands in the wavenumber range of 1500–1750 cm−1 should be assigned to ν(SO42−) coordinated with Fe3+ or Cox+.33,36 Moreover, the bands at 1084 cm−1, 1140 cm−1 and 1389 cm−1 grow in intensity with exposure time until they become stable; whereas, the bands at 1535 cm−1, 1638 cm−1 and 1709 cm−1 vary inconsistently. The intensity of the band at 1535 cm−1 first decreases and then increases with time, while the positions of the other bands shift until the broad, strong peak appears at approximate 1680 cm−1. It is speculated that during this variation, the surface sulfates evolve with the reaction time, in order to keep a steady state. Contrasting with the results in Fig. 10(a), Fe0.8Co0.2Ce0.1/ASC shows fewer bands (Fig. 10(b)): only four obvious bands at 1112 cm−1, 1168 cm−1, 1389 cm−1 and 1587 cm−1. These bands will grow in intensity with time, but will not change positions. Therefore, we speculate that the sulfates on the surface of Fe0.8Co0.2Ce0.1/ASC are more purified (i.e., the major sulfates are cerous sulfates).
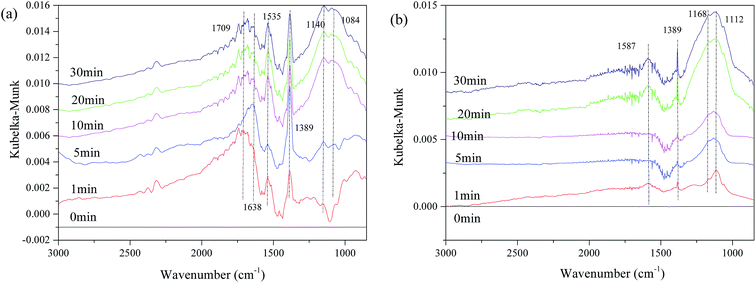 | ||
| Fig. 10 DRIFTS spectra of catalysts: (a) Fe0.8Co0.2/ASC; (b) Fe0.8Co0.2Ce0.1/ASC; exposed to 200 ppm SO2 balanced by N2 at 250 °C for different times. | ||
The influence of NO on the surface sulfates was also investigated, and Fig. 11 displays the spectra of the representative samples. It can be observed in Fig. 11(a), that there are some bands assigned to ν of weakly adsorbed NO (1739 cm−1), νas(NO3−) in bridge bidentate coordination (1632 cm−1), νas of nitro species (1383 cm−1),8,15,18,51 and ν of SO42− (1532 cm−1, 1114 cm−1, 1068 cm−1 and 1002 cm−1). The intensity of these bands increases with time, indicating that the reaction gradually reaches a steady state. The bands of νas(nitro species) should theoretically be located at approximately 1375 cm−1. This shifting is speculated to be related to the interaction of surface sulfates and NO2−. However, for Fe0.8Co0.2Ce0.1/ASC, the band of νas(nitro species) has almost no shifting. In addition to the band at 1378 cm−1, bands also appear at 1698 cm−1 and 1123 cm−1. The intensity and half peak width simultaneously increase with the adsorbing time, indicating some bulk-like sulfates may be produced.
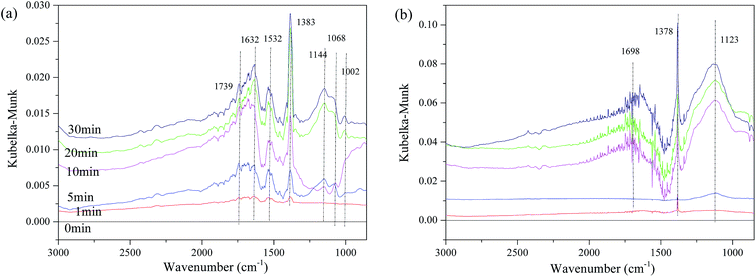 | ||
| Fig. 11 DRIFTS spectra of catalysts: (a) Fe0.8Co0.2/ASC; (b) Fe0.8Co0.2Ce0.1/ASC; exposed to 200 ppm SO2 + 1000 ppm NO balanced by N2 at 250 °C for different times. | ||
In conclusion, it can be deduced that with no Ce doping, there will be more kinds of sulfates like Fe2(SO4)3 generated on the surface of Fe0.8Co0.2/ASC. However, the addition of Ce can attract these sulfates and transform them to cerous sulfates. Nitro acts as an important intermediate in the NO + CO reaction,27 but the presence of SO2 will affect the locating site of nitro species on the micro surface for Fe–Co binary catalysts. That will reduce the deNO activity. Meanwhile, the Ce addition can decrease the NO adsorption performance of the ASC-based catalysts in the presence of SO2, to some extent (this is also reasonable for the decrease of the NO conversion). Notably, cerium oxides show excellent performance for improving the generation of bulk-like cerous sulfates, which could remedy the decrease of CO–deNO activity, and further strengthen the SO2 resistance.
3.7 SO2 tolerance mechanism
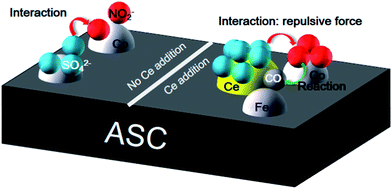
After the analysis above, a possible scheme for the SO2 resistance mechanism in the NO + CO reaction over ASC-based catalysts is proposed. As shown in Fig. 12, when the catalyst surface has no Ce, the adsorbed SO2 will transform the active components to sulfate, and further deactivate the catalysts. Moreover, the SO2 presence could also change the form of the intermediates of nitrates. However, Ce doping can improve the SO2 tolerance in two aspects: one is protecting the active metal oxides; the other is stabilizing the form of the surface nitrates.4. Conclusions
After a series of tests on the samples, the improvement in the SO2 tolerance for Fe0.8Co0.2Ce0.1/ASC in the NO + CO reaction was revealed. The conclusions are as follows:(1) The presence of SO2 in the feed gas can severely decrease the CO–deNO activity catalyzed by Fe–Co binary oxides over activated semi-coke. The doping of Ce onto the Fe–Co binary catalysts will improve the SO2 tolerance, and the optimizing doping molar ratio is approximately 0.1.
(2) The Ce on the surface of catalysts can improve the generation of Ce2(SO4)3. These sulfates will directly accumulate on the Cex+ site, affording some bulk-like sulfates, which can then protect the active metal from poisoning by SO2.
(3) Although the addition of Ce will decrease the NO-adsorption performance of the Fe–Co binary catalysts, the presence of Ce plays an important role in protecting the formation of surface nitrates. Furthermore, this protection can alleviate the interaction of surface sulfates and nitrates.
Conflicts of interest
There are no conflicts to declare.Acknowledgements
The authors thank the National Natural Science Foundation of China (No. 51406104), the National Key Technology R&D Program (No. 2014BAA02B03), the National key R&D program (No. 2017YFB0602904), the Project of Shandong Province Science and Technology Development Program (No. 2014GSF117034), Shandong Province Natural Science Foundation (No. ZR2016EEM17), and the Independent Innovation Funds of Shandong Province (No. 2014ZZCX05201) for financial support.References
- R. Jin, Y. Liu, Y. Wang, W. Cen, Z. Wu, H. Wang and X. Weng, Appl. Catal., B, 2014, 148–149, 582–588 CrossRef CAS.
- C. J. Tang, H. L. Zhang and L. Dong, Catal. Sci. Technol., 2016, 6, 1248–1264 CAS.
- A. Boubnov, H. W. P. Carvalho, D. E. Doronkin, T. Gunter, E. Gallo, A. J. Atkins, C. R. Jacob and J. D. Grunwaldt, J. Am. Chem. Soc., 2014, 136, 13006–13015 CrossRef CAS PubMed.
- Y. Chen, J. Wang, Z. Yan, L. Liu, Z. Zhang and X. Wang, Catal. Sci. Technol., 2015, 5, 2251–2259 CAS.
- L. Wang, X. Cheng, Z. Wang, C. Ma and Y. Qin, Appl. Catal., B, 2017, 201, 636–651 CrossRef CAS.
- R. Mrad, A. Aissat, R. Cousin, D. Courcot and S. Siffert, Appl. Catal., A, 2015, 504, 542–548 CrossRef CAS.
- G. H. Wang, R. Y. Zhang, M. E. Gomez, L. X. Yang, M. L. Zamora, M. Hu, Y. Lin, J. F. Peng, S. Guo, J. J. Meng, J. J. Li, C. L. Cheng, T. F. Hu, Y. Q. Ren, Y. S. Wang, J. Gao, J. J. Cao, Z. S. An, W. J. Zhou, G. H. Li, J. Y. Wang, P. F. Tian, W. Marrero-Ortiz, J. Secrest, Z. F. Du, J. Zheng, D. J. Shang, L. M. Zeng, M. Shao, W. G. Wang, Y. Huang, Y. Wang, Y. J. Zhu, Y. X. Li, J. X. Hu, B. Pan, L. Cai, Y. T. Cheng, Y. M. Ji, F. Zhang, D. Rosenfeld, P. S. Liss, R. A. Duce, C. E. Kolb and M. J. Molina, Proc. Natl. Acad. Sci. U. S. A., 2016, 113, 13630–13635 CrossRef CAS PubMed.
- X. Yao, Y. Xiong, W. Zou, L. Zhang, S. Wu, X. Dong, F. Gao, Y. Deng, C. Tang, Z. Chen, L. Dong and Y. Chen, Appl. Catal., B, 2014, 144, 152–165 CrossRef CAS.
- X. X. Cheng, M. Zhang, P. L. Sun, L. Y. Wang, Z. Q. Wang and C. Y. Ma, Green Chem., 2016, 18, 5305–5324 RSC.
- X. X. Cheng and X. T. T. Bi, Int. J. Chem. React. Eng., 2013, 11, 19–30 Search PubMed.
- X. X. Cheng and X. T. T. Bi, Chem. Eng. J., 2012, 211, 453–462 CrossRef.
- T. T. Yang, H. T. Bi and X. X. Cheng, Appl. Catal., B, 2011, 102, 163–171 CrossRef CAS.
- L. Dong, B. Zhang, C. Tang, B. Li, L. Zhou, F. Gong, B. Sun, F. Gao, L. Dong and Y. Chen, Catal. Sci. Technol., 2014, 4, 482–493 CAS.
- C. Sun, Y. Tang, F. Gao, J. Sun, K. Ma, C. Tang and L. Dong, Phys. Chem. Chem. Phys., 2015, 17, 15996–16006 RSC.
- Y. Xiong, X. Yao, C. Tang, L. Zhang, Y. Cao, Y. Deng, F. Gao and L. Dong, Catal. Sci. Technol., 2014, 4, 4416–4425 CAS.
- Y. Xiaojiang, Y. Xiong, S. Jingfang, G. Fei, D. Yu, T. Changjin and D. Lin, J. Rare Earths, 2014, 32, 131–138 CrossRef.
- C. Ge, L. Liu, Z. Liu, X. Yao, Y. Cao, C. Tang, F. Gao and L. Dong, Catal. Commun., 2014, 51, 95–99 CrossRef CAS.
- Y. Lv, L. Liu, H. Zhang, X. Yao, F. Gao, K. Yao, L. Dong and Y. Chen, J. Colloid Interface Sci., 2013, 390, 158–169 CrossRef CAS PubMed.
- L. Qi, Q. Yu, Y. Dai, C. Tang, L. Liu, H. Zhang, F. Gao, L. Dong and Y. Chen, Appl. Catal., B, 2012, 119–120, 308–320 CrossRef CAS.
- L. Liu, Y. Chen, L. Dong, J. Zhu, H. Wan, B. Liu, B. Zhao, H. Zhu, K. Sun, L. Dong and Y. Chen, Appl. Catal., B, 2009, 90, 105–114 CrossRef CAS.
- L. Simonot and G. Maire, Appl. Catal., B, 1997, 11, 181–191 CrossRef CAS.
- L. Zhang, L. Dong, W. Yu, L. Liu, Y. Deng, B. Liu, H. Wan, F. Gao, K. Sun and L. Dong, J. Colloid Interface Sci., 2011, 355, 464–471 CrossRef CAS PubMed.
- C. Tang, B. Sun, J. Sun, X. Hong, Y. Deng, F. Gao and L. Dong, Catal. Today, 2017, 281, 575–582 CrossRef CAS.
- D. Li, Q. Yu, S.-S. Li, H.-Q. Wan, L.-J. Liu, L. Qi, B. Liu, F. Gao, L. Dong and Y. Chen, Chem.–Eur. J., 2011, 17, 5668–5679 CrossRef CAS.
- X. Yao, C. Tang, Z. Ji, Y. Dai, Y. Cao, F. Gao, L. Dong and Y. Chen, Catal. Sci. Technol., 2013, 3, 688–698 CAS.
- C. Sun, J. Zhu, Y. Lv, L. Qi, B. Liu, F. Gao, K. Sun, L. Dong and Y. Chen, Appl. Catal., B, 2011, 103, 206–220 CrossRef CAS.
- L. Wang, Z. Wang, X. Cheng, M. Zhang, Y. Qin and C. Ma, RSC Adv., 2017, 7, 7695–7710 RSC.
- L. Wang, X. Cheng, Z. Wang, X. Zhang and C. Ma, Can. J. Chem. Eng., 2017, 95, 449–458 CrossRef CAS.
- Y. Yu, J. Wang, J. Chen, X. Meng, Y. Chen and C. He, Ind. Eng. Chem. Res., 2014, 53, 16229–16234 CrossRef CAS.
- W. S. Kijlstra, M. Biervliet, E. K. Poels and A. Bliek, Appl. Catal., B, 1998, 16, 327–337 CrossRef.
- T. Shaymurat, Q. Tang, Y. Tong, L. Dong and Y. Liu, Adv. Mater., 2013, 25, 2269–2273 CrossRef CAS PubMed.
- A. Venezia, G. Di Carlo, L. Liotta, G. Pantaleo and M. Kantcheva, Appl. Catal., B, 2011, 106, 529–539 CrossRef CAS.
- W. Q. Xu, H. He and Y. B. Yu, J. Phys. Chem. C, 2009, 113, 4426–4432 CAS.
- S. T. Choo, S. D. Yim, I.-S. Nam, S.-W. Ham and J.-B. Lee, Appl. Catal., B, 2003, 44, 237–252 CrossRef CAS.
- T. Kanazawa, Catal. Today, 2004, 96, 171–177 CrossRef CAS.
- B. Jiang, B. Deng, Z. Zhang, Z. Wu, X. Tang, S. Yao and H. Lu, J. Phys. Chem. C, 2014, 118, 14866–14875 CAS.
- H. Chang, X. Chen, J. Li, L. Ma, C. Wang, C. Liu, J. W. Schwank and J. Hao, Environ. Sci. Technol., 2013, 47, 5294–5301 CrossRef CAS PubMed.
- K. Wijayanti, K. Leistner, S. Chand, A. Kumar, K. Kamasamudram, N. W. Currier, A. Yezerets and L. Olsson, Catal. Sci. Technol., 2016, 6, 2565–2579 CAS.
- L. Xie, F. Liu, L. Ren, X. Shi, F.-S. Xiao and H. He, Environ. Sci. Technol., 2013, 48, 566–572 CrossRef PubMed.
- L. Xie, F. Liu, K. Liu, X. Shi and H. He, Catal. Sci. Technol., 2014, 4, 1104–1110 CAS.
- Q. Yang, H. Choi, S. R. Al-Abed and D. D. Dionysiou, Appl. Catal., B, 2009, 88, 462–469 CrossRef CAS.
- K. Asami and K. Hashimoto, Corros. Sci., 1984, 24, 83–97 CrossRef CAS.
- G. A. Kolta and M. H. Askar, Thermochim. Acta, 1975, 11, 65–72 CrossRef CAS.
- G. Xie, Z. Liu, Z. Zhu, Q. Liu, J. Ge and Z. Huang, J. Catal., 2004, 224, 42–49 CrossRef CAS.
- T. Luo, J. M. Vohs and R. J. Gorte, J. Catal., 2002, 210, 397–404 CrossRef CAS.
- M. C. Biesinger, B. P. Payne, A. P. Grosvenor, L. W. M. Lau, A. R. Gerson and R. S. C. Smart, Appl. Surf. Sci., 2011, 257, 2717–2730 CrossRef CAS.
- T. Yamashita and P. Hayes, Appl. Surf. Sci., 2008, 254, 2441–2449 CrossRef CAS.
- A. P. Grosvenor, B. A. Kobe, M. C. Biesinger and N. S. McIntyre, Surf. Interface Anal., 2004, 36, 1564–1574 CrossRef CAS.
- A. S. Arico, A. K. Shukla, H. Kim, S. Park, M. Min and V. Antonucci, Appl. Surf. Sci., 2001, 172, 33–40 CrossRef CAS.
- A. Kocijan, I. Milošev and B. Pihlar, J. Mater. Sci.: Mater. Med., 2004, 15, 643–650 CrossRef CAS PubMed.
- M. C. Kung and H. H. Kung, Catal. Rev.: Sci. Eng., 1985, 27, 425–460 Search PubMed.
Footnote |
| † Electronic supplementary information (ESI) available. See DOI: 10.1039/c7ra10721h |
| This journal is © The Royal Society of Chemistry 2017 |

