 Open Access Article
Controlled synthesis of EuPO4 nano/microstructures and core–shell SiO2@EuPO4 nanostructures with improved photoluminescence†
Kui-Suo Yanga,
An-Ping Wua,
Xin Zhaoa,
Yu Yana,
Xue-Yuan Guoa,
Yu-Long Biana,
Jin-Rong Bao *a,
Wen-Xian Lia and
Xiao-Wei Zhu*b
aSchool of Chemistry and Chemical Engineering, Inner Mongolia University, Hohhot 010021, China. E-mail: jinrongbao@imu.edu.cn; Tel: +86-0471-4992981
bCollege of Pharmacology, Inner Mongolia Medical University, Hohhot 010059, China. E-mail: zxwtxwd@sina.com
First published on 10th November 2017
Abstract
Cluster-like, flower-like and sphere-like EuPO4 nano/microstructures and uniform core–shell SiO2@EuPO4 nanostructures have been controllably synthesized by the hydrothermal route and co-precipitation method, respectively. The as-synthesized products are characterized by means of X-ray diffraction (XRD), scanning electron microscopy (SEM), transmission electron microscopy (TEM), energy-dispersive spectroscopy (EDS), X-ray photoelectron spectroscopy (XPS) and infrared spectroscopy (IR). The possible formation mechanism of the as-synthesized products is proposed. The photoluminescence properties demonstrate that the locations of the strongest peaks of nano/microstructured EuPO4 and core–shell nanostructured SiO2@EuPO4 are different. In the emission spectrum of the core–shell SiO2@EuPO4 nanostructures, the 5D0 → 7F2 transition is much stronger than the 5D0 → 7F1 transition, indicating that Eu3+ ions occupy low symmetry sites in the EuPO4 lattice. Furthermore, the core–shell SiO2@EuPO4 nanostructures have stronger emission intensity than the flower-like and sphere-like EuPO4 nano/microstructures.
1 Introduction
Core–shell nanomaterials have attracted significant attention due to their various unique properties, including optical,1 electrical,2 magnetic,3 thermal,4 and mechanical5 properties. The applications of these core–shell particles are very broad because they often exhibit improved physical and chemical properties over their single-component counterparts, and include biomedical applications, catalysts and electronics.6–9 Most core and shell materials are composed of polymers, inorganic solids and metals.10–12 SiO2 has been widely used to fabricate core–shell materials as a core due to its good properties.13,14 When SiO2 was used as the core material, the Si–OH groups and external hydrogen bonds on the surface of SiO2 had a very strong affinity, which makes the SiO2 bond easily with a variety of materials through chemical bonds and electrostatic adsorption interactions. SiO2 core–shell nanomaterials can be used as important functional materials through various modifications with rare-earth compounds. For example, as reported in our previous work on SiO2@Dy(MABA-Si)L (L = Phen or Dipy) core–shell nanometer luminescent composites, the emission intensity of the nanomaterials can be greatly enhanced by the formation of the core–shell structure.15 The silica-coated core–shell Y2O3:Eu3+, Co2+ composite particles as fluorescent contrast agents in cell imaging have been prepared by a precipitation method, and the particles with a silica core fluoresced more strongly.16 Besides, the emission intensity of core–shell SiO2@Y2O3:Eu3+ particles can be tuned by the SiO2 core size and the number of coating cycles.17 It can be also mentioned that SiO2@LaVO4:Eu3+ with tuned emission in the visible region and promising applications as color television and the high-pressure mercury lamp were obtained via sol–gel process.18 The SiO2 core–shell nanomaterials can not only significantly save the cost of expensive rare earth materials by covering them on cheap cores, but also improve the luminescence intensity of phosphor.Recently, rare earth phosphate is considered as an important family of phosphors, due to its easy synthesis, low cost, high thermal and chemical stability over a wide range of temperature.19,20 In addition, rare earth phosphate nanomaterials have potential applications in the LCD displays, plasma display panels (PDPS), field emission displays, new generation fluorescent lamps, and so on.21–24 Many preparation methods have been used to fabricate nanostructured rare earth phosphates such as nanowires, nanotubes, nanoplates, and nanorods to improve the luminescence emission intensity.25–28 So far, much research effort has been devoted to synthesize the core–shell SiO2@REPO4 phosphor materials. However, the approaches to fabricate core–shell structured rare earth orthophosphates are not mature. Yu et al. have synthesized SiO2@LaPO4:Ce3+/Tb3+ particles by sol–gel method, and the emission intensity of Tb3+ increases with the increasing of SiO2 core particles size and the annealing temperature.29 The emission intensity of SiO2@LaPO4:Eu3+ core–shell phosphors also increases with increasing the coating cycles.30 Therefore, it is desirable to explore feasible and easily controllable methods for the synthesis of core–shell SiO2@REPO4 nanomaterials.
In this paper, we report the synthesis of cluster-like, flower-like and spherical-like EuPO4 nano/microstructures materials by a simple hydrothermal process, in combination with the co-precipitation method to controllably synthesize the core–shell SiO2@EuPO4 nanostructures. The possible formation mechanisms of the synthesized materials were proposed. Moreover, the photoluminescence properties of the as-synthesized products were compared. It is demonstrated that the core–shell SiO2@EuPO4 nanostructures showed improved photoluminescence properties. The core–shell SiO2@EuPO4 nanostructures phosphors can lower the cost of precious phosphors, which are promising for applications in the field of emission displays, lamps for lighting, and plasma display panels.
2 Experimental
2.1 Material and reagents
Eu2O3 (99.99%), triethyl phosphate (TEP), ammonia and orthophosphate acid were all provided by Sinopharm Chemical Reagent Limited Corporation. Tetraethoxysilane (TEOS) was provided by Beijing Industry of Fine Chemical Limited Corporation. All reagents were analytical grade and used as received without further purification. The europium nitrate was prepared by dissolving Eu2O3 was dissolved in 10% nitric acid, followed by evaporation and drying in vacuum.2.2 Synthesis of EuPO4 nano/microstructures
For the synthesis of cluster-like and flower-like EuPO4 nano/microstructures, a certain amount of europium nitrate was dissolved in 10 mL of deionized water, and added into 6.0 mol L−1 H3PO4 solution under stirring. Meanwhile, the reactant PO4/Eu molar ratio was changed from 60 to 200 by decreasing the amount of europium nitrate. Then the mixture solution was transferred into a 50 mL-capacity Teflon-lined stainless steel autoclave and heated at 100 °C for 12 h. After cooling down the autoclave to room temperature, the precipitation was separated by centrifugation, washed with deionized water and ethanol several times, and finally dried in air at 60 °C for 8 h.The synthesis of spherical-like EuPO4 nanostructures was achieved by setting the PO4/Eu molar ratio to be 200. The pH value of the system was adjusted from 2.0 to 4.0 with ammonia (25%) under stirring, and then transferred into a 50 mL-capacity Teflon-lined stainless steel autoclave at 100 °C for 12 h.
2.3 Synthesis of the core–shell SiO2@EuPO4 nanostructures
The highly monodispersed SiO2 submicro-spheres were fabricated following the well-known Stöber method.31 First, deionized water and absolute ethanol were mixed, followed by the addition of aqueous ammonia and tetraethoxysilane. A white silica colloidal suspension was formed and stirred with 3.5 h. The SiO2 submicro-spheres were centrifugally separated from the suspension and washed with ethanol and deionized water several times, prior to drying in air at 60 °C for 12 h. After that, a certain amount of SiO2 submicro-spheres is mixed with the prepared 0.1 mol L−1 europium nitrate solution. Then, 0.5 mL triethyl phosphate (TEP) was added under magnetic stirring at 70 °C for 3 days. The resulting solution was centrifuged and washed with ethanol and deionized water several times, respectively.2.4 Characterization
The size and morphology of the products were characterized by scanning electronic microscopy (SEM; Hitachi S-4800, Japan and LEO1530, Germany) and transmission electron microscopy (TEM; FEI Tecnai F20, USA). XRD patterns were measured by a 21 kW extra power X-ray diffractometer (Model M21XVHF22, MAC science Co. Ltd., Japan) using Cu Kα radiation (k = 0.1541 nm) over a 2θ range of 10–60° at room temperature. Infrared spectra (IR) of powders were examined in the range of 400–4000 cm−1 by the KBr pressed disc method on a Nicolet NEXUS 670 FT-IR. The photoluminescence spectra were determined on a FLS980 fluorescence photometer with the slit width of 2.0 nm at room temperature.3 Result and discussion
3.1 Structure and morphology of EuPO4 nano/microstructures
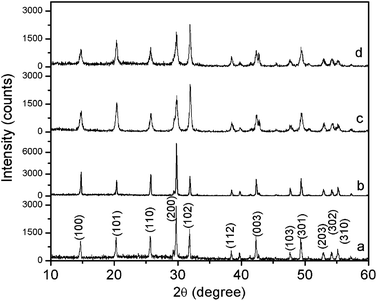
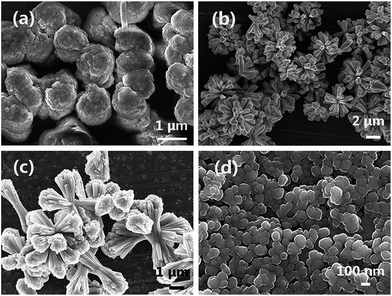
The crystal structure and the phase purity of the products were identified by the XRD. Fig. 1 shows the typical XRD patterns of the as-synthesized products prepared with the different reactant PO4/Eu molar ratios and different pH values. The typical XRD pattern of the products prepared at the reactant PO4/Eu molar ratio of 60 (pH value of 0.70) is shown in Fig. 1a. All the diffraction peaks agree well with hexagonal phase EuPO4 (JCPDS 20-1044). The diffraction peaks are very strong and sharp, indicating that the samples have a good crystallinity. While the reactant PO4/Eu molar ratio is 200 and the pH value is 0.85, the diffraction peaks still agree well with hexagonal phase EuPO4 (Fig. 1b). When the reactant PO4/Eu molar ratio is 200, using ammonia (25%) to adjust the pH values from 2.0 to 4.0, all reflection peaks in Fig. 1c and d can be indexed to hexagonal phase EuPO4.The morphology of the as-synthesized products prepared with different reactant PO4/Eu molar ratios and different pH values were investigated using SEM. As can be seen from Fig. 2a, the product synthesized with the reactant PO4/Eu molar ratio of 60 is uniform cluster-like nanostructures composed of nanowires, which has a diameter of about 80–90 nm and a length of about 1 μm. When the PO4/Eu molar ratio increased to 200, the as-synthesized EuPO4 exhibits uniform flower-like microcluster morphology (Fig. 2b). The flower-like microstructures are actually composed of a self-assembly of the similar hexagonal prisms with a diameter of about 250 nm and a length of about 1.5 μm, which radiated out from the centers and formed uniform flower-like aggregates. Obviously, the concentration of phosphoric acid might be responsible for the morphologies formation of the as-synthesized nano/microstructured EuPO4. When phosphoric acid is excessive, the pH value of the reaction solution will decrease. To investigate the influence of pH values on the morphology, the products subjected to different pH values were studied by SEM (Fig. 2c and d). When the reactant PO4/Eu molar ratio is 200, the pH value was adjusted to 2.0 by adding ammonia (25%), the flower-like nanostructures composed of a large number of nanowires with a diameter of about 90–100 nm and a length of about 1–2 μm were observed in the product (Fig. 2c). Subsequently, the pH values increased to 4.0, the morphology of the product changed into uniform sphere-like nanostructures, which have a diameter of about 80–100 nm (Fig. 2d). In our system, when the pH value of the reaction solution is lower 2.0, the flower-like nanostructures composed of a large number of nanowires were obtained. When the pH values increased to 4.0, uniform sphere-like nanostructures were obtained. Fang et al.32 reported that the hexagonal crystal structures are characteristic of highly anisotropic growth, a higher growth rate along the c axis and a lower one perpendicular to the c axis to form LnPO4 nanowires/nanorods. Our experimental results indicate that the pH value of the reaction solution is lower 2.0, the growth rate of EuPO4 along c axis is faster than that in other directions, which results in the formation of LnPO4 nanorods/nanowires. When the pH values increased to 4.0, the c axis direction of growth and the anisotropy is inhibited, and the formed nanorods/nanowires started to break up, and started to form nanoparticles.33
3.2 Structure and morphology of core–shell SiO2@EuPO4 nanostructures
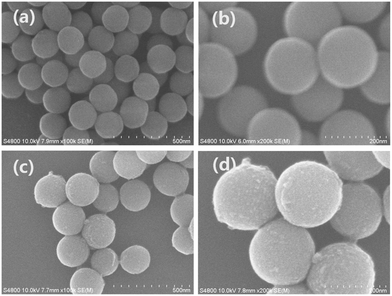
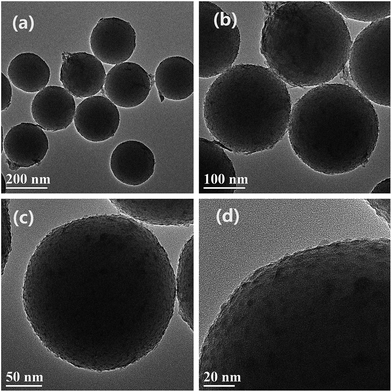
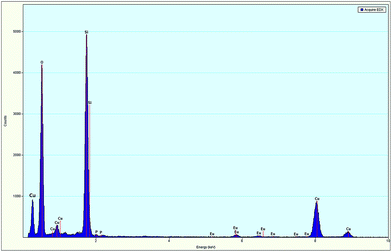
The SEM images of the as-synthesized SiO2 submicro-spheres and core–shell SiO2@EuPO4 nanostructures are shown in the Fig. 3. The uniform-size SiO2 with an extremely smooth surface is first successfully prepared, which has a diameter of about 200 nm (Fig. 3a and b). Then the core–shell SiO2@EuPO4 were prepared using TEP and Eu3+ ions as precursor. The EuPO4 nanoparticles were absorbed on the surface of the SiO2 submicro-spheres by the interactions between the Si–OH and EuPO4. The surface of the core–shell SiO2@EuPO4 is rough and has obvious granular substances, which might be caused by the inhomogeneous crystals of EuPO4 coating on the surface of SiO2 submicro-spheres. The core–shell SiO2@EuPO4 nanostructures was further characterized by TEM analysis. The typical TEM images are shown in Fig. 4, which reveals that SiO2@EuPO4 has a “core–shell” structure and present a uniform spherical morphology. Besides, SiO2@EuPO4 has a SiO2 sphere with diameter about 200 nm and a thin EuPO4 surface. Further observation (Fig. 4d) indicated that the EuPO4 surface layer is composed by a number of small nanoparticles with a diameter of about 4 nm, which accounts for the rough surface of SiO2@EuPO4 spheres. The EDS spectrum of core–shell SiO2@EuPO4 nanostructures is plotted in Fig. 5, which confirm the presence of Eu, O, P and Si in the thin layer of submicro-spheres. The EDX mapping images are presented in Fig. S1.† As evidenced by the EDX mapping images, the elements of Eu, P, O, and Si are distributed uniformly in the single SiO2@EuPO4 submicro-spheres. Further elemental analysis of the SiO2@EuPO4 surface was performed by X-ray photoelectron spectroscopy (XPS). Fig. S2† shows the XPS spectrum of the core–shell SiO2@EuPO4 nanostructures. The binding energies are calibrated using the carbon peak (C 1s) at 284.8 eV as reference. As shown in the XPS spectrum, Eu, P, O, Si and C elements are detected. The peaks that located at 1135.0, 532.5, 284.8, 136.2, and 103.0 eV can be attributed to the binding energy of Eu 3d, O 1s, C 1s, P 2p, Si 2p of the SiO2@EuPO4 core–shell nanostructures, respectively.30,34 The structures of the core–shell SiO2@EuPO4 were further analyzed by the IR spectra (Fig. S3†). Fig. S3a† is IR spectrum of the SiO2 submicro-spheres. The broad band located at 3423 cm−1 is assigned to the O–H stretching vibrations, and the peak at 1630 cm−1 is assigned to the bending vibrations of O–H bond, which indicate that high content OH groups exist on the surface of the SiO2 submicro-spheres. The surface Si–OH groups play an important role in the formation of EuPO4 layer on the SiO2 submicro-spheres surfaces. The strong and wide absorption band located at 1104 cm−1 is attributed to the asymmetrical stretching vibration of Si–O–Si, and the peak located at 798 cm−1 is assigned to symmetrical vibration of Si–O–Si bond. The peaks at 946 cm−1 and 465 cm−1 are assigned to symmetrical stretching vibration, and bending vibrations of Si–O bond, respectively. IR spectrum of the core–shell SiO2@EuPO4 nanostructures is showed in Fig. S3b.† The peaks of OH groups on the surface of the SiO2 submicro-spheres also located at 3429 cm−1 and 1631 cm−1. However, the peak intensity is greatly weakened, which should result from the EuPO4 surface coating on the SiO2 submicro-spheres. Furthermore, a sharp peak at 1103 cm−1 appeared, which is the typical P–O stretching vibrations originating from the thin shell layer of EuPO4 nanostructures. The other new peak at 470 cm−1 is assigned to Eu–O bond.35 The above results indicate that the EuPO4 are successfully coated on the SiO2 submicro-spheres.Therefore, we suggest a possible formation mechanism of the core–shell SiO2@EuPO4 nanostructures (Fig. 6) based on the above results. First, the PO43− ions were formed in the solution via the hydrolysis of TEP. EuPO4 were then formed by reaction of PO43− ions with europium ions. Finally, the EuPO4 were slowly absorbed on the surface of SiO2 submicro-spheres through a hydrogen bond or electrostatic adsorption interactions. It is assumed that TEP has two effects in the core–shell nanostructure formation process. On the one hand, it was a PO43− precursor by slowly hydrolyzing to provide PO43− ions. On the other hand, the slow release of PO43− ions can decrease the reaction rate of PO43− ions reacting with Eu3+ ions. It is quite possible that the EuPO4 nanoparticles are absorbed on the surface of the SiO2 submicro-spheres at the early stage of the reactions, due to the weak interactions between the Si–OH and PO43−. With the extension of the reaction time, the EuPO4 nanoparticles gradually deposit on and coat on the surface of SiO2 submicro-spheres.
3.3 Photoluminescence properties
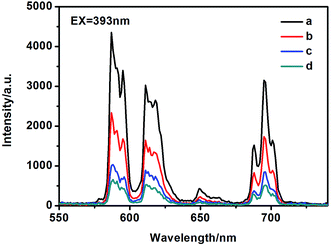
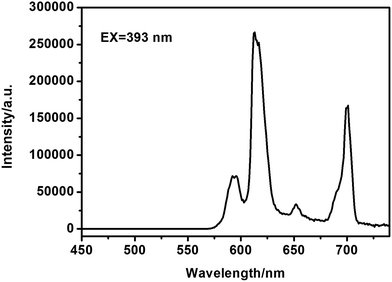
The photoluminescence (PL) spectra were measured at room temperature. Fig. S4† and 7 are the excitation and emission spectra of the cluster-like, flower-like and spherical-like EuPO4 nano/microstructures, respectively. The excitation peak centered at 393 nm could be contributed to the f → f transitions of the europium ions.36 The emission spectra shown in Fig. 7 is made up of four sharp peaks at 587, 610, 651, and 699 nm, which correspond to the 5D0 → 7F1, 5D0 → 7F2, 5D0 → 7F3, and 5D0 → 7F4 optical transitions of Eu3+, respectively. And the photoluminescence intensity of the magnetic-dipole transition of 5D0 → 7F1 was stronger than that of the electronic-dipole transition of 5D0 → 7F2. When the trivalent europium ion lies on an inversion center, it is well known that the electric-dipole transitions would be strictly forbidden due to the parity selection rules. In consequence, the magnetic-dipole transition of 5D0 → 7F1 dominated (587 nm).37,38 By contrast, due to the perturbation of the crystal field and the change of the local site symmetry, the degeneracy of 7FJ (J = 1–4) energy level was resolved, and then the emission peaks split to multi-peaks. The transition of 5D0 → 7F1 can split at most to three emission peaks, and 5D0 → 7F2 can split to five peaks at most.39Fig. S5† and 8 presented the excitation and emission spectra of the core–shell SiO2@EuPO4 nanostructures. When the core–shell SiO2@EuPO4 nanostructures were excited in the UV (393 nm), the spectrum displays four characteristic emission lines ascribed to 5D0 → 7FJ (J = 1–4) transitions of Eu3+. Interestingly, the photoluminescence intensity of electronic-dipole transition of 5D0 → 7F2 was stronger than the magnetic-dipole transition of 5D0 → 7F1. It is well-known that the 5D0 → 7F2 transition is more sensitive to the symmetry than the 5D0 → 7F1 transition. The symmetry around the Eu3+ ions of the core–shell SiO2@EuPO4 nanostructures decreases leading to the enhancement of the 5D0 → 7F2 transition.37 The size of EuPO4 on the surface of as-synthesized SiO2 submicro-spheres is ultra small, which might result in the Eu3+ ions cannot occupy a lattice site with inversion symmetry. Yan et al.40 reported that when the size of the REPO4:Eu nanocrystals decreased, the ratio of surface Eu3+ ions increased and therefore, the symmetry around the Eu3+ ions decreases, leading to the increase in I610/I590. It's more remarkable that the emission intensity of the core–shell SiO2@EuPO4 nanostructures is 245![[thin space (1/6-em)]](https://www.rsc.org/images/entities/char_2009.gif) 600 a.u., which is 56.79 times higher than that of the flower-like EuPO4 nanostructures. Comparing to the cluster-like, flower-like and spherical-like EuPO4 nano/microstructures, the core–shell SiO2@EuPO4 nanostructures have excellent photoluminescence properties. The photoluminescence properties are affected by many factors including morphologies, sizes and crystal structures. The emission intensity of cluster-like morphologies composed by nanowires is stronger than that of spherical-like morphologies. In our previous work, it was found that the emission intensity of 1D nanorods/nanowires is stronger than that of nanoparticles.41 In this study, when the EuPO4 nanoparticles coated on the surface of SiO2 submicro-spheres, the emission intensity of Eu3+ is stronger than that of EuPO4 particles with different morphology nano/microstructures. We contribute this enhancement to the unique core–shell structure, in which the SiO2 cores greatly enhance the physical stability of EuPO4 and decrease the energy loss of EuPO4 molecular vibration.
600 a.u., which is 56.79 times higher than that of the flower-like EuPO4 nanostructures. Comparing to the cluster-like, flower-like and spherical-like EuPO4 nano/microstructures, the core–shell SiO2@EuPO4 nanostructures have excellent photoluminescence properties. The photoluminescence properties are affected by many factors including morphologies, sizes and crystal structures. The emission intensity of cluster-like morphologies composed by nanowires is stronger than that of spherical-like morphologies. In our previous work, it was found that the emission intensity of 1D nanorods/nanowires is stronger than that of nanoparticles.41 In this study, when the EuPO4 nanoparticles coated on the surface of SiO2 submicro-spheres, the emission intensity of Eu3+ is stronger than that of EuPO4 particles with different morphology nano/microstructures. We contribute this enhancement to the unique core–shell structure, in which the SiO2 cores greatly enhance the physical stability of EuPO4 and decrease the energy loss of EuPO4 molecular vibration.
The photoluminescence fitting curve of the core–shell SiO2@EuPO4 nanostructures was also recorded, as shown in Fig. S6.† It is noted that the decay curve can be fitted well with a biexponential function.
I(t) = I0 + A1![[thin space (1/6-em)]](https://www.rsc.org/images/entities/char_2009.gif) exp(−t1/τ1) + A2 exp(−t1/τ1) + A2![[thin space (1/6-em)]](https://www.rsc.org/images/entities/char_2009.gif) exp(−t2/τ2) exp(−t2/τ2) |
Two lifetimes of 238.828 μs and 432.030 μs are detected. Therefore, the average lifetime (τ) is calculated using the following equation.
| (τ) = (A1τ12 + A2τ22)/(A1τ1 + A2τ2) |
Herein, the calculated average lifetime (τ) is 374.494 μs of Eu3+ ion for the core–shell nanostructures. And these core–shell SiO2@EuPO4 nanostructures with improved photoluminescence have possible applications for making optical devices namely upconvertors, LEDs, optical bioprobes, and so on.
4 Conclusions
The cluster-like, flower-like and spherical-like EuPO4 nano/microstructures, and the uniform core–shell SiO2@EuPO4 nanostructures have been successfully synthesized by a hydrothermal route and a simple co-precipitation method, respectively. The cluster-like, flower-like and spherical-like EuPO4 nano/microstructures can be synthesized in a controlled manner by adjusting the reactant PO4/Eu molar ratios and the solution pH values. The core–shell SiO2@EuPO4 nanostructures were achieved by using TEP and Eu3+ ions as precursors by the interactions between the Si–OH and EuPO4. In addition, the photoluminescence properties demonstrate that the core–shell SiO2@EuPO4 nanostructures have stronger emission intensity than the cluster-like, flower-like and spherical-like EuPO4 nano/microstructures. Moreover, the electronic-dipole transition 5D0 → 7F2 was stronger than the magnetic-dipole transition 5D0 → 7F1, which indicates that the symmetry around the Eu3+ ions occupy low symmetry sites after the formation of the core–shell structures. This research has opened new opportunities not only in lowing the waste of precious phosphors by coating the rare earth phosphate on the SiO2, and but also in developing advanced luminescence materials with improved photoluminescence properties.Conflicts of interest
There are no conflicts to declare.Acknowledgements
This work is supported by the Major projects of Natural Science Foundations of Inner Mongolia Science Foundation (2015ZD01) and the Natural Science Foundations of Inner Mongolia Science Foundation (2015MS0502).Notes and references
- M. Yu, J. Lin and J. Fang, Chem. Mater., 2005, 17, 1783–1791 CrossRef CAS.
- H. Ding, H. S. Tao, X. Z. Zhu and M. G. Li, Appl. Surf. Sci., 2017, 41, 9580–9585 Search PubMed.
- A. A. Markeb, A. Alonso, A. Sánchez and X. Font, Sci. Total Environ., 2017, 598, 949–958 CrossRef PubMed.
- S. Y. Gim, S. Hong, J. Kim, Y. J. Kwon, M. Kim, G. H. Kim and J. H. Lee, Food Chem., 2017, 235, 160–166 CrossRef CAS PubMed.
- W. Di, X. Zhao, S. Lu, X. Wang and H. Zhao, J. Solid State Chem., 2007, 180, 2478–2484 CrossRef CAS.
- Y. H. Haba, C. Kojima, A. Harada and K. Kono, Macromolecules, 2006, 39, 7451–7453 CrossRef CAS.
- F. Caruso, A. S. Susha, M. Giersig and H. Mohwald, Adv. Mater., 1999, 11, 950–953 CrossRef CAS.
- S. L. Westcott, S. J. Oldenburg, L. Randall and N. J. Halas, Langmuir, 1998, 14, 5396–5401 CrossRef CAS.
- P. D. Yang, D. Y. Zhao, D. I. Margolese, B. F. Chmelka and G. D. Stucky, Nature, 1998, 396, 152–155 CrossRef CAS.
- K. Suzuki, Y. Saito, Y. Tokuoka, M. Abe and T. Sato, J. Am. Chem. Soc., 1997, 74, 55–59 CAS.
- D. L. Berthier, I. Schmidt, W. Fieber, C. Schatz, A. Furrer, K. Wang and S. Lecommandoux, Langmuir, 2010, 26, 7953–7961 CrossRef CAS PubMed.
- D. L. Berthier, A. Herrmann and L. Ouali, Polym. Chem., 2011, 2, 2093–2101 RSC.
- M. Ocaña, E. Cantelar and F. Cussó, Mater. Chem. Phys., 2011, 125, 224–230 CrossRef.
- L. Liu, H. Xiao, X. An, Y. Zhang, R. Qin, L. Liu, D. Zhang, R. Sun and L. Chen, Chem. Phys. Lett., 2015, 619, 169–173 CrossRef CAS.
- W. X. Li, Y. S. Zheng, X. F. Cao, J. Bai, Z. F. Fu and J. R. Bao, J. Lumin., 2016, 178, 470–478 CrossRef CAS.
- T. S. Atabaev, O. S. Jin, J. H. Lee, D. W. Han, H. H. T. Vu, Y. H. Hwang and H. K. Kim, RSC Adv., 2012, 2, 9495–9501 RSC.
- H. Wang, M. Yu, C. K. Lin, X. M. Liu and J. Lin, J. Phys. Chem. C, 2007, 111, 11223–11230 CAS.
- M. Yu, J. Lin and J. Fang, Chem. Mater., 2005, 17, 1783–1791 CrossRef CAS.
- F. Zhang and S. Wong Stanislaus, ACS Nano, 2010, 4, 99–112 CrossRef CAS PubMed.
- S. Rodriguez-Liviano, A. I. Becerro, D. Alcántara, V. Grazú, J. M. de la Fuente and M. Ocaña, Inorg. Chem., 2013, 52, 647–654 CrossRef CAS PubMed.
- W. Di, X. Zhao, S. Lu, X. Wang and H. Zhao, J. Solid State Chem., 2007, 180, 2478–2484 CrossRef CAS.
- Y. C. Kang, E. J. Kim, D. Y. Lee and H. D. Park, J. Alloys Compd., 2002, 347, 266–270 CrossRef CAS.
- B. Moine and G. Bizarri, Opt. Mater., 2006, 28, 58–63 CrossRef CAS.
- A. K. Parchur and R. S. Ningthoujam, RSC Adv., 2012, 2, 10854–10858 RSC.
- O. Lehmann, K. Kompe and M. Haase, J. Am. Chem. Soc., 2004, 126, 14935–14942 CrossRef CAS PubMed.
- X. Li and H. F. Bi, J. Alloys Compd., 2012, 532, 72–77 CrossRef CAS.
- R. S. de-Oliveira, B. S. de-Brito, J. Kulesza, S. Alves-Jr and B. S. Barros, Ceram. Int., 2017, 43, 8276–8283 CrossRef CAS.
- G. G. Li, L. L. Li, M. M. Li, Y. H. Song, H. F. Zou, L. C. Zou, X. C. Xu and S. C. Gan, Mater. Chem. Phys., 2012, 133, 263–268 CrossRef CAS.
- M. Yu, H. Wang, C. K. Lin, G. Z. Li and J. Lin, Nat. Nanotechnol., 2006, 17, 3245–3252 CrossRef CAS.
- J. Dai, M. Lv, G. Chao and X. Li, Mater. Des., 2015, 83, 795–800 CrossRef CAS.
- W. Stöber, Inhalation Toxicol., 1999, 11, 269–292 CrossRef PubMed.
- Y. P. Fang, A. W. Xu, R. Q. Song, H. X. Zhang, L. P. You, J. C. Yu and H. Q. Liu, J. Am. Chem. Soc., 2003, 125, 16025–16034 CrossRef CAS PubMed.
- T. T. Huong, L. T. Vinh, T. K. Anh, H. T. Khuyen, H. T. Phuong and L. Q. Minh, New J. Chem., 2014, 38, 2114–2119 RSC.
- J. H. Lang, Q. Zhang, Q. Han, Y. Fang, J. Y. Wang, X. Y. Li, Y. Q. Liu, D. D. Wang and J. H. Yang, Mater. Chem. Phys., 2017, 194, 29–36 CrossRef CAS.
- M. Yu, J. Lin, J. Fu, H. J. Zhang and Y. C. Han, J. Mater. Chem., 2003, 13, 1413–1419 RSC.
- T. S. Atabaev, H. T. V. Hong, H. K. Kim and Y. H. Hwang, J. Alloys Compd., 2012, 525, 8–13 CrossRef CAS.
- Y. G. Yang, Mater. Sci. Eng., B, 2013, 178, 807–810 CrossRef CAS.
- C. Zollfrank, H. Scheel, S. Brungs and P. Greil, Cryst. Growth Des., 2008, 8, 766–770 CAS.
- Y. H. Zheng, H. P. You, G. Jia, K. Liu, Y. H. Song, M. Yang and H. J. Zhang, Cryst. Growth Des., 2009, 9, 5101–5107 CAS.
- H. X. Mai, Y. W. Zhang, L. D. Sun and C. H. Yan, Chem. Mater., 2007, 19, 4514–4522 CrossRef CAS.
- J. R. Bao, R. B. Yu, J. Y. Zhang, D. Wang, J. X. Deng, J. Chen and X. R. Xing, Scr. Mater., 2010, 62, 133–136 CrossRef CAS.
Footnote |
| † Electronic supplementary information (ESI) available. See DOI: 10.1039/c7ra10556h |
| This journal is © The Royal Society of Chemistry 2017 |

