 Open Access Article
Creative Commons Attribution 3.0 Unported Licence
SnO2/SnS2 nanotubes for flexible room-temperature NH3 gas sensors†
Rui Liac,
Kai Jiang*b,
Shuai Chenac,
Zheng Louc,
Tingting Huangac,
Di Chen*a and
Guozhen Shen *c
*c
aCollege of Physics and Mathematics, Beijing Key Laboratory for Magneto-Photoelectrical Composite and Interface Science, University of Science and Technology Beijing, Beijing 100083, China. E-mail: chendi@ustb.edu.cn
bInstitute & Hospital of Hepatobiliary Surgery, Key Laboratory of Digital Hepatobiliary Surgery of Chinese PLA, Chinese PLA Medical School, Chinese PLA General Hospital, Beijing 100853, China. E-mail: jiangk301@126.com
cState Key Laboratory for Superlattices and Microstructures, Institute of Semiconductors, Chinese Academy of Sciences, Beijing 100083, China. E-mail: gzshen@semi.ac.cn
First published on 14th November 2017
Abstract
Complex composites have attracted tremendous attention due to their superior physic–chemical properties. In this work, using electrospun-synthesized SnO2 nanotubes as backbones, tubular SnO2/SnS2 composites were successfully prepared from an in situ hydrothermal sulfuration process. As-synthesized composite SnO2/SnS2 nanotubes have an average diameter of about 300 nm and are aggregated into numerous small nanoparticles. Flexible gas sensors were fabricated with the composite SnO2/SnS2 nanotubes on a polyethylene terephthalate (PET) substrate. When exposed to ammonia (NH3) gas at room temperature, the flexible SnO2/SnS2 nanotube sensors exhibited excellent sensitivity as high as 2.48 (100 ppm NH3), almost twice as high as pure SnO2 nanotubes. In addition, the sensors also showed a fast response time, excellent repeatability, stability and outstanding selectivity. Studies found that the hollow structures and the synergistic effect of both SnO2 and SnS2 played important roles in enhanced the sensing performance.
Introduction
Ammonia (NH3), a kind of colorless gas, has been widely used in various fields, including compound fertilizers, biofuels, textiles and paper products. However, this highly toxic gas is not only harmful to public health, but also has a negative effect on the surrounding environment. Thus, developing high-performance gas sensors for NH3 detection and monitoring has attracted increasing attention in recent years.1–3Unlike traditional gas sensors assembled by depositing solid sensing powders on ceramic tubes or interfinger probes, flexible gas sensors are fabricated on flexible or stretchable substrates, and can thus be used in portable electronic devices to provide ultra-sensitive and highly selective real-time analysis for environmental monitoring and other applications.4–6 Several recent reports showed that flexible ammonia sensors can be assembled with conductive films, such as carbon nanotube (CNT) film and polyaniline (PANI) film, to detect NH3 gas at room temperature.7–10 Unfortunately, the flexible ammonia sensors reported until now have displayed either relatively low sensing performance or have poor long-term environmental stability mainly caused by the sensing material characteristics. Developing flexible gas sensors with other sensing materials, such as inorganic compounds, might provide an effective way to realize high-performance ammonia sensors with better sensitivity, wearability and cycling stability.11–13
Tin oxide (SnO2), an n-type semiconductor, has been widely applied in gas sensors and exhibits a sensing response to various gases, including CO,14 CH4,15 NO2,16 and NH3,17 because of its low cost and high electrical conductivity. However, gas sensors built on pure SnO2 are usually limited to high-temperature operation, which leads to high power consumption, safety hazards and low lifetimes.18–20 An efficient way to overcome this is to composite it with other inorganic/organic materials or to dope it with some noble metals.21–24 Combined sensing materials with a particular interface between both crystalline materials can display outstanding sensing performance due to their specific synergistic effect. For example, SnO2/SnS2 heterojunction based sensors exhibited enhanced sensitivity and selectivity to different concentrations of NO2 at the testing temperature of 80 °C.25 Zhang's group reported an interesting NH3 sensor based on hybrid Co3O4/SnO2 core–shell nanospheres, which displayed a fast response time and good reproducibility to ammonia gas.26 Kim et al. synthesized composite SnO2–ZnO nanofibers from an electrospinning method and found a superior sensing performance towards H2 gas.27
Herein, by using electrospinning followed by in situ hydrothermal sulfuration routes in the presence of CH3CSCH2, we prepared tubular SnO2/SnS2 composites and fabricated high-performance flexible ammonia gas sensors. As-fabricated NH3 sensors exhibited better sensing performance than pure SnO2 nanotubes in terms of sensitivity, response time, and cycle stability. In addition, the flexible sensors also showed reliable flexibility and mechanical stability, making them ideal candidates for practical sensor applications.
Experimental
Materials
Stannic chloride pentahydrate (SnCl4·5H2O), sodium sulfide nonahydrate (CH3CSNH2), ethanol and N,N-dimethylformamide (DMF) were purchased from Sinopharm Chemical Reagents Co., Shanghai, China. Polyvinylpyrrolidone (PVP, M = 1![[thin space (1/6-em)]](https://www.rsc.org/images/entities/char_2009.gif) 300
300![[thin space (1/6-em)]](https://www.rsc.org/images/entities/char_2009.gif) 000 g mol−1) was supplied by Qi Fuqin Materials Technology Co., LTD. Shanghai, China.
000 g mol−1) was supplied by Qi Fuqin Materials Technology Co., LTD. Shanghai, China.
Synthesis of SnO2 nanotubes and SnO2/SnS2 nanotubes
Tubular SnO2 precursors were first prepared from the facile electrospinning process. Typically, SnCl4·5H2O (3 g) and PVP (2.8 g) were dissolved in an ethanol/DMF mixture solution (26 g) with a weight ratio of 1![[thin space (1/6-em)]](https://www.rsc.org/images/entities/char_2009.gif) :
:![[thin space (1/6-em)]](https://www.rsc.org/images/entities/char_2009.gif) 1 under magnetic stirring. Following vigorous stirring for 12 h at room temperature, the solution was electrospun from a stainless steel needle on an aluminium foil collector placed at a distance of 22 cm with an applied voltage of 20 kV and a constant flow rate of 0.3 ml h−1. The as-spun SnO2 precursors were then calcinated at 600 °C for 3 h with a heating rate of 0.5 °C min−1, resulting in the formation of pure SnO2 nanotubes.28 After that, the as-synthesized SnO2 nanotubes were added into 20 ml of 10 vol% acetic acid solution, and 12 mmol of thioacetamide was dissolved in 20 ml of distilled water. After mixing both solutions and stirring continuously for 30 min at room temperature, the mixture was transferred into a 50 ml Teflon-lined autoclave and heated at 150 °C for 3 h. The obtained yellow products were washed with deionized water and ethanol and dried in a vacuum drying oven for 6 h at 100 °C.
1 under magnetic stirring. Following vigorous stirring for 12 h at room temperature, the solution was electrospun from a stainless steel needle on an aluminium foil collector placed at a distance of 22 cm with an applied voltage of 20 kV and a constant flow rate of 0.3 ml h−1. The as-spun SnO2 precursors were then calcinated at 600 °C for 3 h with a heating rate of 0.5 °C min−1, resulting in the formation of pure SnO2 nanotubes.28 After that, the as-synthesized SnO2 nanotubes were added into 20 ml of 10 vol% acetic acid solution, and 12 mmol of thioacetamide was dissolved in 20 ml of distilled water. After mixing both solutions and stirring continuously for 30 min at room temperature, the mixture was transferred into a 50 ml Teflon-lined autoclave and heated at 150 °C for 3 h. The obtained yellow products were washed with deionized water and ethanol and dried in a vacuum drying oven for 6 h at 100 °C.
Characterization and gas sensing measurement
The surface morphology and microstructure of the obtained products were characterized by field emission scanning electron microscopy (FESEM, SUPRA 55) and transmission electron microscopy (TEM, JEM 2200FS). The crystallographic structures of the products were determined by X-ray diffraction (XRD, DMAX-RB) and electron energy-loss spectroscopy (EELS, SUPRA 55). The chemical composition of the products was analyzed by X-ray photoelectron spectroscopy (XPS Thermo escalab 250XI). The Brunauer–Emmett–Teller (BET) specific surface area of the products was examined by measuring the N2 adsorption–desorption isotherm (QS-18, 0.01 M).Flexible gas sensors were fabricated with the photolithographic process using PET as a substrate. In a typical process, we ground the appropriate SnO2/SnS2 samples with a small amount of ethanol solution to form a paste. Then we spin coated the paste on the PET substrate with an interdigital electrode. The gas-sensing properties of the flexible sensors were measured by a CGS-1 TP intelligent gas sensitivity analysis system. The gas-sensing sensitivity was assessed through the response value of the electric resistance, which was defined as S= Ig/Ia, where Ia and Ig were the sensor current in dry air and in the target gas, respectively.
Results and discussion
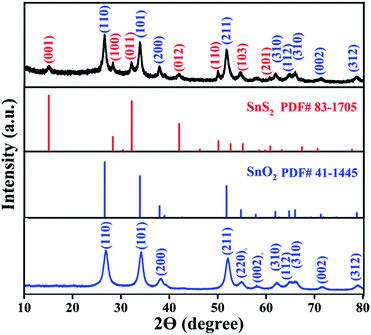
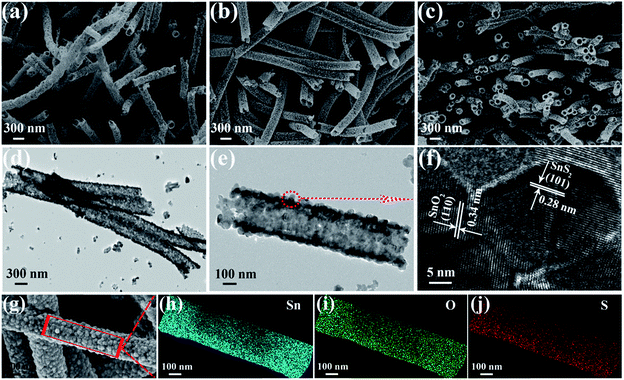
The crystal structure and phase of the obtained samples from the in situ hydrothermal sulfuration process with a CH3CSNH2 concentration of 12 mmol at 150 °C for 3 h were first characterized by XRD, as shown in Fig. 1. Clearly, all the diffraction peaks can be indexed to rutile SnO2 (JCPDS card No. 41-1445) and hexagonal phase SnS2 (JCPDS card No. 83-1705), indicating the formation of composite SnO2/SnS2 samples. The XRD pattern of the calcinated SnO2 precursor is also shown in Fig. 1, revealing the formation of a pure SnO2 sample after calcination.To obtain information about the morphology and microstructures of the samples, we studied the samples with SEM and TEM, respectively. Fig. 2a shows the SEM image of the precursor SnO2 samples before in situ hydrothermal sulfuration. SnO2 nanotubes with uniform diameters of about 300 nm were prepared on a large scale via the electrospinning/calcination process. When the precursor SnO2 nanotubes were sulfurated in the presence of CH3CSNH2 at 150 °C for 3 h, the resulting SnO2/SnS2 composites retain the nanotube shape of the precursor, as can be seen in the SEM images shown in Fig. 2b and c, confirming the successful synthesis of composite SnO2/SnS2 nanotubes.
Fig. 2d depicts the TEM image of the composite SnO2/SnS2 nanotubes, which have uniform diameters of about 300 nm. The clear brightness contrast revealed the formation of nanotubes, in good accord with the SEM results. A TEM image of a single SnO2/SnS2 nanotube is shown in Fig. 2e. The SnO2/SnS2 nanotube is composed of SnO2 and SnS2 nanoparticles with a diameter of about 25 nm and the wall thickness is about 30 nm. A close-up HRTEM image taken from the nanotube in Fig. 2e is shown in Fig. 2f. The clearly resolved lattice fringes are calculated to be 0.28 nm and 0.34 nm, corresponding to the (101) crystal planes of hexagonal SnS2 and the (110) crystal planes of rutile SnO2, respectively. The high-magnification SEM image in Fig. 2g further confirmed that the SnO2/SnS2 nanotubes were composed of numerous aggregated nanoparticles with a rough surface. Fig. 2h–j displays the EDS elemental mapping analysis of the single SnO2/SnS2 nanotube shown in Fig. 2g. Obviously, three elements of Sn, O and S were detected in these images, confirming the uniform distribution of the three elements in the composite nanotube after the sulfuration treatment. Based on these results, we can see that uniform composite SnO2/SnS2 nanotubes are formed in our process. The nitrogen adsorption–desorption isotherm and pore size distribution curve of the SnO2/SnS2 nanotubes are shown in Fig. S1,† and the measured BET surface area of the samples is about 38.0 m2 g−1.
X-ray photoelectron spectroscopy (XPS) was employed to analyse the surface chemical compositions and the valence states of the SnO2/SnS2 nanotubes. As shown in Fig. 3a, the obtained full spectrum suggested the existence of several elements, including C, Sn, O, and S. Fig. 3b shows the XPS spectra of Sn 3d and two signals at ∼487 eV and ∼497 eV can be attributed to Sn4+ 3d3/2 and Sn4+ 3d5/2, respectively. The peaks in Fig. 3c centered at ∼158 eV and ∼166 eV can be attributed to the S 2p. The peak of O 1s (Fig. 3d) can be attributed to the O2− of SnO2/SnS2 composites that appeared at a binding energy of ∼531 eV. These results further indicated that the as-synthesized samples were composite SnO2/SnS2 nanotubes.
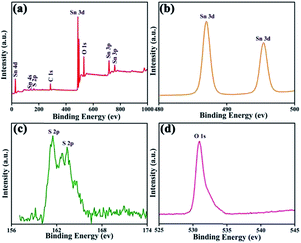 | ||
| Fig. 3 XPS spectra for the as-synthesized SnO2/SnS2 nanotubes: (a) survey spectrum, and high resolution spectra of (b) Sn 3d, (c) S 2p and (d) O 1s. | ||
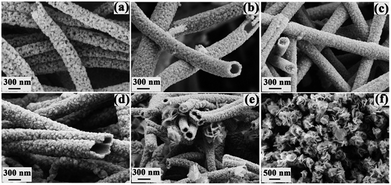
To study the effects of experimental parameters on the final samples, we performed control experiments at different CH3CSNH2 concentrations and different reaction times, respectively. Fig. 4a–c show the SEM images of the synthesized samples with CH3CSNH2 concentrations of 8 mmol, 10 mmol, and 14 mmol at 150 °C for 3 h, respectively. From these images, we can see that, similar to the above sample with a CH3CSNH2 concentration of 12 mmol, nanotubes were still formed with CH3CSNH2 concentrations of 8 mmol and 10 mmol except that the sample obtained at a lower CH3CSNH2 concentration was composed of nanoparticles with lower densities. While for the sample at 14 mmol, almost no hollow nanotubes were observed and the sample consisted of nanofibers instead. Although samples with different morphologies were obtained under different CH3CSNH2 concentrations, XRD patterns confirmed that all of them are still composite SnO2/SnS2 nanostructures (Fig. S2, ESI†).
We also studied the effect of reaction time on the final samples by increasing the reaction time from 3 h to 5 h, 7 h, and 9 h and the corresponding SEM images are shown in Fig. 4d–f, respectively. Nanotubes are obtained after 5 h and the XRD data (Fig. S3a†) confirms that they are still composite SnO2/SnS2 nanotubes. After reacting for 7 h, XRD revealed that the sample is composed of both SnO2 and SnS2 (Fig. S3b†). However, nanoflowers were found coexisting with nanotubes (Fig. 4e). When the reaction time was further prolonged to 9 h, only nanoflowers were obtained, as shown in Fig. 4f, and XRD data (Fig. S3c†) revealed they are pure SnS2.
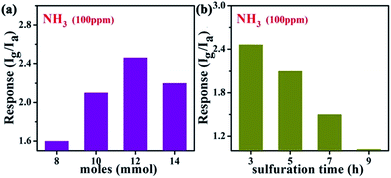
Flexible chemical sensors based on nanomaterials with high sensitivity, stability and workability under ambient conditions are of great interest for wearable sensing applications. After obtaining the samples, we then fabricated flexible gas sensors on PET substrates with interdigitated electrodes to detect ammonia gas using the conventional photolithographic technique. Fig. 5a shows the NH3 gas sensing response of the gas sensors built on the samples obtained with different CH3CSNH2 concentrations of 8 mmol, 10 mmol, 12 mmol, and 14 mmol, to 100 ppm NH3 gas at room temperature. From the data, it was found that the sensitivity first increased and then dropped for the samples treated with increased CH3CSNH2 concentrations. The highest sensitivity is about 2.48 for the sample treated with 12 mmol of CH3CSNH2. The sensitivity of the samples treated with 12 mmol of CH3CSNH2 at different reaction times was then investigated and the corresponding results are shown in Fig. 5b. This revealed that the sample after reacting for 3 h showed the best sensitivity with a value of 2.48. All these results suggested that composite SnO2/SnS2 nanotubes after sulfuration for 3 h in 12 mmol of CH3CSNH2 exhibited the highest sensitivity to NH3 gas at room temperature, which were therefore chosen as the target material to investigate the gas sensing properties in the following work.
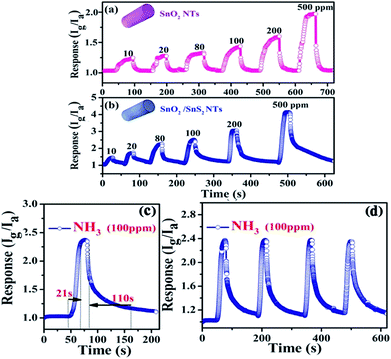
First, we compared the room-temperature NH3 sensing performance of our SnO2/SnS2 nanotubes with that of pure SnO2 nanotubes. Fig. 6a and b show the sensing performance of the SnO2/SnS2 nanotubes and the pure SnO2 nanotubes to NH3 gas with concentrations of 10–500 ppm at room temperature, respectively. It is clear that both samples showed an obvious response to NH3 gas. With increased concentration of NH3 gas, the sensitivity also increased gradually. However, the sensitivity of the SnO2/SnS2 nanotubes is much higher than that of pure SnO2 nanotubes. For example, when exposed to NH3 gas with a concentration of 100 ppm, the sensitivity for the SnO2/SnS2 nanotubes is 2.48, while it is 1.25 for pure SnO2 nanotubes, indicating a great NH3 gas sensing enhancement. The fast response–recovery time is an important assessment standard for evaluating a good gas sensor. Fig. 6c illustrates the real-time dynamic response curve of the SnO2/SnS2 nanotube sensor to 100 ppm NH3 at room temperature. The response curve indicated that the sensor has a relatively rapid response to NH3 gas. And the response time and recovery time were determined to be 21 s and 110 s, respectively, which are comparable to previously reported room-temperature NH3 gas sensors.29–31 The repeatability of the SnO2/SnS2 nanotube sensor toward 100 ppm NH3 gas is shown in Fig. 6d. The test was performed under the same conditions for four exposure/recovery cycles. No obvious changes in the response amplitude of response and recovery time were observed, revealing the outstanding stability of our flexible composite sensor.
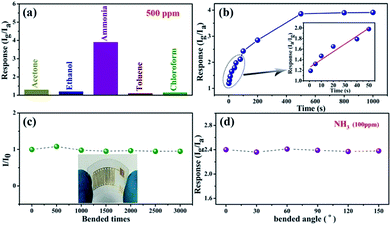
The sensing selectivity of the fabricated flexible SnO2/SnS2 nanotube based sensors was investigated by exposing the devices to different volatile organic gases at the same concentration of 500 ppm, including acetone, ethanol, ammonia, toluene, and chloroform. As shown in Fig. 7a, the SnO2/SnS2 nanotube based sensors show much higher response to NH3 than to other gases at room temperature, indicating that the as-synthesized SnO2/SnS2 nanotubes can be chosen to be the sensing material for NH3 sensors. Fig. 7b further displays the response of the SnO2/SnS2 nanotube based sensors to NH3 at various concentrations, in which the sensors exhibited a very broad gas sensing range toward NH3 from 1 to 1000 ppm. The sensing saturation concentration is found to be ∼500 ppm for the SnO2/SnS2 nanotube sensors. In addition, the minimum detection limit for the SnO2/SnS2 nanotubes to NH3 is about 1 ppm and the response has a linear relationship with the NH3 concentration in the low concentration region, as can be seen in the Fig. 7b inset.
Generally, the mechanical flexibility of flexible gas sensors is very important for potential applications in wearable electronics. Fig. 7c shows the long-term mechanical stability of our flexible sensors evaluated by the current ratio after bending for different times with the initial current. When the nanotube sensor was bent 500, 1000, 1500, 2000, 2500 and 3000 times, the calculated current ratio obviously remained almost constant, confirming the reliable and robust flexibility of the device. The inset in Fig. 7c is a photograph of the fabricated ammonia sensor, also demonstrating its good flexibility. Fig. 7d further shows the response of our gas sensor to 100 ppm NH3 under different bending angles of 0, 30, 60, 90, 120 and 150° at room temperature. With an increase in bending angle, the gas sensors still retained a high sensing performance to ammonia at room temperature, indicating the good flexibility and mechanical stability of the device. After the sensing test, the samples were characterized by SEM again. As shown in Fig. S4 (ESI),† the samples still retain a tubular morphology, demonstrating that the microstructure of the samples is not affected by the sensing event.
Table 1 depicts a brief comparison of the performance of our ammonia gas sensor with that of other sensors. Apparently, compared to other room-temperature NH3 sensors, including SnO2/SnS2,38 In2O3/PANI,39 CeO2/Pani,40 and Pd/SnO2/RGO41 based devices, our SnO2/SnS2 nanotube sensors show faster response and recovery times to ammonia. Moreover, this SnO2/SnS2 based sensor also exhibits a lower operating time than other oxide based sensors,26,35,36 demonstrating that this tubular composite based sensor with high sensing performance could be applied to the potential monitoring of ammonia at room temperature.
| Material | Structure | Temperature (°C) | Concentration (ppm) | Sensitivity | Response time (s) | Recovery time (s) | Reference |
|---|---|---|---|---|---|---|---|
| SnO2/SnS2 | Nanotubes | Room temperature | 100 | 2.48 (Ig/Ia) | 21 | 110 | This work |
| SnO2 | Nanorods | 300 | 800 | 180 | 36 | 25 | 35 |
| MoO3 | Nanoparticle | 400 | 500 | 69% (Ra − Rg)/Ra | 60 | 180 | 36 |
| Co3O4/SnO2 | Nanospheres | 200 | 50 | 13.6 | 4 | 17 | 26 |
| Pt/SnO2 | Thin film | 230 | 450 | 25.7 | 1 | — | 37 |
| SnO2–SnS2 | Nanosheets | Room temperature | 100 | 2.0 | 200 | 200 | 38 |
| In2O3/PANI | Nanofibers | Room temperature | 1000 | 1.2 | 500 | 500 | 39 |
| CeO2@Pani | Particles | Room temperature | 2 | 7.5% | 400 | 600 | 40 |
| Pd/SnO2/RGO | Thin film | 25 | 100 | 19.6% | >300 | >500 | 41 |
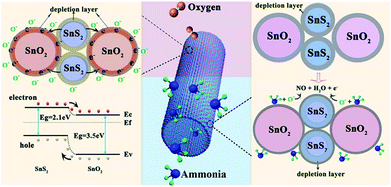
All the above-mentioned testing results demonstrated that our tubular SnO2/SnS2 composites exhibited excellent sensing performance to ammonia gas at room temperature, including high sensitivity, good selectivity, and outstanding repeatability and stability. Fig. 8 shows the proposed mechanism for the sensing behaviour of SnO2/SnS2 nanotube based sensors in air and in ammonia gas at room temperature. From the energy band structure diagram in Fig. 8 left, a heterojunction is formed at the boundaries of SnO2 and SnS2 crystallites in the composites. Electrons can transfer from the conduction band of SnS2 to that of SnO2 due to the work function of SnS2 being higher than that of SnO2,32 resulting in the formation of a thin electron depletion layer on the side of SnS2 and an accumulation layer on the side of SnO2. When exposed to air, oxygen molecules physically adsorbed onto the surface of SnO2 and SnS2 form O− by capturing electrons from the conduction bands of SnO2 and SnS2.33 The depletion layer is widened, leading to an increase in the measured resistance of the sensor. When the sensor is exposed to ammonia gas, NH3 molecules react with O− on the surface of SnO2 and SnS2 as below:
| 2NH3 + 5O− = 2NO + 3H2O + 5e− | (1) |
The depletion layer is narrowed, leading to a decrease in the measured resistance of the sensor, as shown in Fig. 8 right. In this case, the response of SnO2/SnS2 nanotube based sensors to ammonia is much higher than that of both pure SnO2 and SnS2 based sensors at room temperature, which could be attributed to the following two factors. Firstly, the hollow structure SnO2/SnS2 composites with a high aspect ratio provide more active sites for ammonia to adsorb on the surface.34 Secondly, the synergistic effect of both SnO2 and SnS2 particles is helpful to the reversible adsorption of more NH3 gases for an enhanced sensing response. Thus, the sensing response was effectively increased in SnO2/SnS2 nanotubes.
Conclusions
In summary, tubular SnO2/SnS2 composites composed of highly aggregated nanoparticles have been synthesized on the backbones of pristine SnO2 nanotubes from an in situ hydrothermal sulfuration process in the presence of CH3CSNH2. Flexible gas sensors based on the SnO2/SnS2 nanotubes were fabricated and exhibited good sensing performance to ammonia at room temperature, including fast sensing response/recovery time, good selectivity and mechanical stability. Besides, the results showed that the composite SnO2/SnS2 nanotube sensors exhibited an enhanced sensing performance towards ammonia gas at room temperature when compared to pristine SnO2 or SnS2, mainly due to the hollow structure and synergistic effect of both grains. Our experimental results highlight that these tubular composites are promising candidates for building ammonia gas sensors at room temperature.Conflicts of interest
There are no conflicts to declare.Acknowledgements
The work was supported by National Natural Science Foundation of China (51672308, 61625404, and 61504136), the Beijing Natural Science Foundation (4162062), Beijing Municipal Science and Technology Project (No. Z1711000220000) and the Key Research Program of Frontiers Sciences, CAS (QYZDY-SSW-JSC004).Notes and references
- L. L. Wang, Z. Lou, R. Zhang, T. T. Zhou, J. N. Deng and T. Zhang, ACS Appl. Mater. Interfaces, 2016, 8, 6539 CAS.
- J. Zhou, J. W. Zhang, A. U. Rehman, K. Kan, L. Li and K. Y. Shi, J. Mater. Sci., 2017, 52, 3757 CrossRef CAS.
- N. Du, H. Zhang, B. B. Chen, X. Y. Ma, Z. H. Liu, J. B. Wu and D. R. Yang, Adv. Mater., 2007, 19, 1641 CrossRef CAS.
- H. Liu, M. Li, O. Voznyy, L. Hu, Q. Fu, D. Zhou and J. Tang, Adv. Mater., 2014, 26, 2718 CrossRef CAS PubMed.
- A. I. Uddin and G. S. Chung, Sens. Actuators, B, 2016, 231, 601 CrossRef CAS.
- P. Bahoumina, H. Hallil, J. L. Lachaud, A. Abdelghani, K. Frigui and S. Bila, Sens. Actuators, B, 2017, 249, 708 CrossRef CAS.
- D. K. Bandgar, S. T. Navale, S. R. Nalage, R. S. Mane, F. J. Stadler, D. K. Aswal and V. B. Patil, J. Mater. Chem. C, 2015, 3, 9461 RSC.
- S. Abdulla, T. L. Mathew and B. Pullithadathil, Sens. Actuators, B, 2015, 221, 1523 CrossRef CAS.
- P. Wan, X. Wen, C. Sun, B. K. Chandran, H. Zhang, X. Sun and X. Chen, Small, 2015, 11, 5409 CrossRef CAS PubMed.
- L. Xue, W. Wang, Y. Guo, G. Liu and P. Wan, Sens. Actuators, B, 2017, 244, 47 CrossRef CAS.
- S. Niu, Y. Hu, X. Wen, Y. Zhou, F. Zhang, L. Lin and Z. L. Wang, Adv. Mater., 2013, 25, 3701 CrossRef CAS PubMed.
- Z. Q. Zheng, J. D. Yao, B. Wang and G. W. Yang, Sci. Rep., 2015, 5, 11070 CrossRef CAS PubMed.
- O. Krsko, T. Plecenik, T. Roch, B. Grancic, L. Satrapinskyy and M. Truchly, Sens. Actuators, B, 2017, 240, 1058 CrossRef CAS.
- Q. Wang, C. Wang, H. Sun, P. Sun, Y. Wang, J. Lin and G. Lu, Sens. Actuators, B, 2016, 222, 257 CrossRef CAS.
- A. Amutha, S. Amirthapandian, A. K. Prasad, B. K. Panigrah and P. Thangadurai, J. Neurosci. Res., 2015, 17, 1 CAS.
- H. Zhang, J. Feng, T. Fei, S. Liu and T. Zhang, Sens. Actuators, B, 2014, 190, 472 CrossRef CAS.
- M. Shahabuddin, A. Sharma, J. Kumar, M. Tomar, A. Umar and V. Gupta, Sens. Actuators, B, 2014, 194, 410 CrossRef CAS.
- K. Suematsu, Y. Shin, Z. Hua, K. Yoshida, M. Yuasa, T. Kida and K. Shimanoe, ACS Appl. Mater. Interfaces, 2014, 6, 5319 CAS.
- D. Hu, B. Han, S. Deng, Z. Feng, Y. Wang, J. Popovic and I. Djerdj, J. Phys. Chem. C, 2014, 118, 9832 CAS.
- Y. Zou, S. Chen, J. Sun, J. Liu, Y. Che, X. Liu and D. Yang, ACS Sens., 2017, 2, 897 CrossRef CAS PubMed.
- S. H. Yan, S. Y. Ma, W. Q. Li, X. L. Xu, L. Cheng, H. S. Song and X. Y. Liang, Sens. Actuators, B, 2015, 221, 88 CrossRef CAS.
- L. Zhou, C. Zhao, B. Giri, P. Allen, X. Xu, H. Josh and P. M. Rao, Nano Lett., 2016, 16, 3463 CrossRef CAS PubMed.
- T. Ma, X. Yu, H. Li, W. Zhang, X. Cheng, W. Zhu and X. Qiu, Nano Lett., 2017, 17, 3959 CrossRef CAS PubMed.
- L. P. Wang, Y. Leconte, Z. Feng, C. Wei, Y. Zhao, Q. Ma and Z. J. Xu, Adv. Mater., 2017, 29, 1603286 CrossRef PubMed.
- D. Gu, X. Li, Y. Zhao and J. Wang, Sens. Actuators, B, 2017, 244, 67 CrossRef CAS.
- A. Katoch, J. H. Kim, Y. J. Kwon, H. W. Kim and S. S. Kim, ACS Appl. Mater. Interfaces, 2015, 7, 11351 CAS.
- W. S. Kim, B. S. Lee, D. H. Kim, H. C. Kim, W. R. Yu and S. H. Hong, Nanotechnolgy, 2010, 21, 245 Search PubMed.
- H. Wang, F. Sun and Y. Zhang, J. Mater. Chem., 2010, 20, 5641 RSC.
- B. Nketia-Yawson, A. R. Jung, Y. Noh, G. S. Ryu, G. D. Tabi, K. K. Lee and Y. Y. Noh, ACS Appl. Mater. Interfaces, 2017, 9, 7322 CAS.
- L. Wang, H. Huang, S. Xiao, D. Cai, Y. Liu, B. Liu and Q. Li, ACS Appl. Mater. Interfaces, 2014, 6, 14131 CAS.
- P. G. Su and L. Y. Yang, Sens. Actuators, B, 2016, 223, 202–208 CrossRef CAS.
- Y. C. Zhang, Z. N. Du, K. W. Li, M. Zhang and D. D. Dionysiou, ACS Appl. Mater. Interfaces, 2011, 3, 1528–1537 CAS.
- K. Xu, N. Li, D. Zeng, S. Tian, S. Zhang and D. Hu, ACS Appl. Mater. Interfaces, 2015, 7, 11359 CAS.
- J. Chen, L. Xu, W. Li and X. Gou, Adv. Mater., 2005, 17, 582 CrossRef CAS.
- C. S. Rout, M. Hegde, A. Govindaraj and C. N. R. Rao, Nanotechnology, 2007, 18, 205504 CrossRef.
- S. S. Sunu, E. Prabhu, V. Jayaraman, K. I. Gnanasekar and T. K. Seshagiri, Sens. Actuators, B, 2004, 101, 161 CrossRef CAS.
- M. Shahabuddin, A. Sharma, J. Kumar, M. Tomar, A. Umar and V. Gupta, Sens. Actuators, B, 2014, 194, 410 CrossRef CAS.
- K. Xu, N. Li, D. W. Zeng, S. Q. Tian, S. S. Zhang, D. Hu and C. S. Xie, ACS Appl. Mater. Interfaces, 2015, 7, 11359 CAS.
- Z. Y. Pang, Q. X. Nie, A. F. Wei, J. Yang, F. L. Huang and Q. F. Wei, J. Mater. Sci., 2017, 52, 686 CrossRef CAS.
- L. L. Wang, H. Huang, S. H. Xiao, D. P. Cai, Y. Liu, B. Liu, D. D. Wang, C. X. Li, H. Wang and Y. R. Wang, ACS Appl. Mater. Interfaces, 2014, 6, 14131 CAS.
- P. G. Su and L. Y. Yang, Sens. Actuators, B, 2016, 223, 202 CrossRef CAS.
Footnote |
| † Electronic supplementary information (ESI) available. See DOI: 10.1039/c7ra10537a |
| This journal is © The Royal Society of Chemistry 2017 |

