
 Open Access Article
 This Open Access Article is licensed under a Creative Commons Attribution-Non Commercial 3.0 Unported Licence
Tunable solid state emission of novel V-shaped fluorophores by subtle structure modification: polymorphism, mechanofluoro-chromism and micro-fabrication†
Hong-Yu Fu,
Xiao-Jing Liu and
Min Xia *
*
Department of Chemistry, Zhejiang Sci-Tech University, Hangzhou 310018, P. R. China. E-mail: xiamin@zstu.edu.cn
First published on 31st October 2017
Abstract
A family of V-shaped fluorophores with different numbers and positions of vinyl are rationally designed, using which a largely wide and approximately successive range of solid-state emission wavelengths can be achieved before and after force stimuli. These compounds are intensely emissive and highly mechanofluorochromic (MFC), and many physical properties such as emission wavelengths, quantum yields, intramolecular charge transfer (ICT) extent, solvatochromism, aggregation-induced emission (AIE) activity and time consumed for restoration from amorphous phase are profoundly influenced by the number and site of vinyl groups. However, the emission wavelength shifts under force stimuli seem to be related to neither the number nor the position of vinyl. For a member with double polymorphs, the unqiue molecular pair packing in one of them revealed by X-ray crystallography is presumably responsible for its MFC inertia and the abnormally one-way phase transformation from the stable to the metastable one. Interestingly, a shape-dependent emission of self-assembled crystal with a fractal structure occurs when both of the two polymorphs are fumed in solvent vapor for long time. Moreover, the films made of these V-shaped compounds are successfully developed to be erasable mediums for information storage with robust fatigue resistance.
Introduction
Many materials showing switchable and reversible solid-state luminescence upon exposure to external stimuli have been reported during the last decade.1 Among them, mechano-fluorochromic ones2 produced by small organic molecules are particularly important because of their fundamental relevance and promising applications in sensors,3 memory chips,4 security inks5 or papers,6 and optical data storage devices.7 Generally, MFC effect occurs on molecules with considerably twisted conformations,8 whose loose packing makes corresponding crystals readily collapsed into amorphous phase under force stimuli. Therefore, a red-shifted emission takes place on amorphous sample, in which a more planar conformation is preferred to be adopted.It has been reported that “┼” or X-shaped cruciforms are MFC-active,9 as two conjugated arms intersect at a central core to provide highly-twisted conformations. However, such cruciforms always have highly symmetric and complicated skeletons, which lead to the poor solubility of them in common solvents and low crystallization in solid state.10 Moreover, mono-functionalized side products are inevitably generated, which results in the tedious work-up and significantly reduced yields of desired double-functionalized cruciforms. Recently, a series of V-shaped molecules, (E)-2′-[2-(benzo[d]thiazol-2-yl)vinyl]-N,N-dimethyl-(1,1′-biphenyl)-4-amine and its analogous, which can be considered as half-cut X-shaped cruciforms, have been developed by our group.11,12 They exhibit the reversible MFC activity with vividly contrasted colour change in exposure to force stimuli and render a practical solution to the abovementioned shortcomings of X-shaped cruciforms.
In spite of high MFC activities, the range of solid-state emission wavelengths for ever reported compound family is quite limited and discontinuous before and after force stimuli. In order to realize such continuity, herein a new family with different number of vinyl inserted between dimethylaminophenyl or 2-benzo[d]-thiazolyl and phenyl core at different position is rationally designed as a part of the serial studies on V-shaped fluorophores. It is widely believed that emission color of a molecule is intrinsically dependent on the electronic property of its frontier molecular orbits (FMOs), and even the subtle structure modification certainly has some influence on such property. Hence, the different number and site of vinyl, a commonly used π-electron unit, whose introduction into a V-shaped molecule will vary the length of π-conjugated region, will finely adjust the FMOs electron property of the corresponding compound. Actually, the produced molecules under such design strategy display the closely structure-related solution-state physical features like emission wavelength, quantum yield, solvatochromism, aggregation-induced emission (AIE) activity. Moreover, as solid-state physical properties are dependent not only on individual molecules but also on their packing modes, making polymorphism and differentiated solid-state physical properties feasibly occur on them. It is found that emission wavelength and time taken for recovery from amorphous to crystalline phase are largely different among compounds in this work. By this subtle structure modification, these molecules successfully exhibit a largely wide and approximately continuous range of solid-state emission wavelengths before and after force stimuli.
Apart from MFC mechanism, polymorphism is another practical method to provide tunable solid-state fluorescence. In general, multicolour polymorphs are several thermodynamically stable or metastable crystals packed by molecules with remarkably different conformations. Meanwhile, their solid-state emission wavelengths together with the powder X-ray diffraction (PXRD) patterns are largely different from each other.13 For a polymorph whose conformation is less twisted, it exhibits longer-wavelength emission due to the relatively strengthened π-conjugation. In this work, the compound V3 with a vinyl inserted between the dimethyl-aminophenyl and the phenyl core produces two polymorphs, which respectively emit green and yellow fluorescence. However, only the green one is MFC-active, and the transformation between them is just one-way from the yellow to the green one. X-ray diffraction reveals that unique molecular pairs emerge in the yellow one, which is assumed to account for its MFC inertia and the one-way transformation.
Recently, the crystal micro-/nano-fabrication has been an attractive topic in field of functional organic materials, as micro-/nano-structures formed by such means to show specific shapes like wires, rods and ribbons have exhibited their distinguished optical properties.14 In contrast to polymorphs, different emissions of such micro-/nano-particles are significantly dependent on size, shape or defects of crystals rather than molecular conformations. Herein, we report that particular micro-crystal of V3 with fractal structure exhibits orange fluorescence and can be transformed from either the green or the yellow polymorph by a probable dissolution–recrystallization process under prolonged exposure to solvent vapour. It is demonstrated that the PXRD pattern of the orange crystal is the same as that of the green polymorph but thoroughly different from that of the yellow one.
Results and discussions
Synthesis
The family of the V-shaped fluorophores have four members and each of them contains a dimethylaminophenyl as the electron-donating group and a 2-benzo[d]thiazolyl as the electron-withdrawing one (Fig. 1). For them, different number of vinyl is introduced at different position: V1 with no vinyl, V2 with one vinyl located between 2-benzo[d]thiazolyl and phenyl core, V3 with one vinyl inserted between dimethylaminophenyl and phenyl core, and V4 with double vinyls.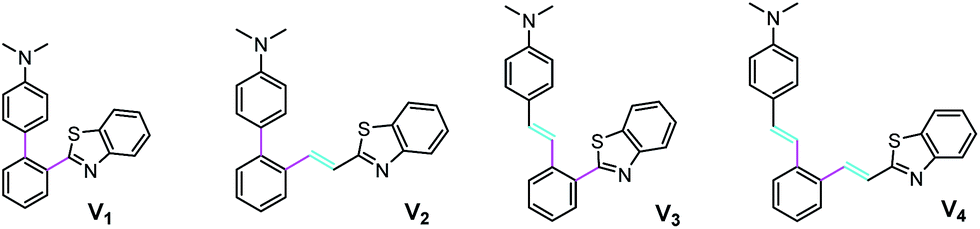 | ||
| Fig. 1 Chemical structures of V-shaped fluorophores V1–V4. | ||
4′-(Dimethyl-amino)-[1,1′-bi-phenyl]-2-carbaldehyde, the intermediate 1, which is obtained by a Suzuki coupling of 2-bromobenzaldehyde and N,N-dimethyl-4-(4,4,5,5-tetramethyl-1,3,2-dioxaborolan-2-yl)aniline, is respectively carried out a condensation with 2-aminothiophenol by using DMSO as an oxidant in the air and a Wittig reaction with 2-methylbenzo[d]thiazolyl triphenylphosphonium bromide to produce V1 and V2 in moderate to good yields. The similar reactions are also executed to prepare V3 and V4 from (E)-2-[4-(dimethylamino)styryl]benzaldehyde, the intermediate 2, which is gained by a Heck reaction of N,N-dimethyl-4-vinylaniline and 2-bromobenzaldehyde. All the pristine samples of these compounds are crystals and intensely emissive. The V-shaped fluorophores together with the double intermediates are carefully characterized by 1H, 13C NMR and EI-MS, and satisfactory date is obtained to support their structures (ESI†).
Photophysical property in solution
Initially, in order to learn about the solution-state emission feature of this family, the emission spectra in n-hexane are investigated, because the polarity of n-hexane is so small that its solvent effect on the emission wavelengths is very slight. It is shown that the emission wavelengths are respectively located at 443 nm for V1, 459 nm for V2, 460 nm for V3 and 490 nm for V4, which indicates that only the quantity rather than the site of vinyl has influence on them. The more vinyls a V-shaped compound has, the longer emission wavelength it displays. Subsequently, the absorption and emission spectra of this family in different solvents are determined (Fig. S1–4, ESI†). It is illustrated that the absorption spectra of each member are not solvent-dependent, but the emission ones are very sensitive to the polarity of the solvents. Such sensitivity can be readily observed on the photos of these compounds in different solvents taken under 365 nm UV light (Fig. 2).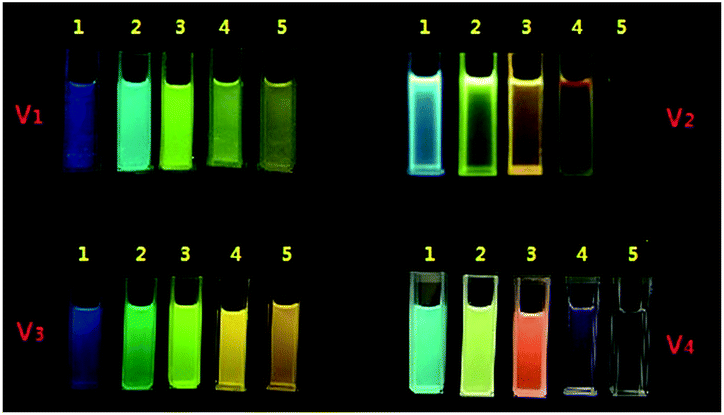 | ||
| Fig. 2 Photos of V1–V4 in different solvents under 365 nm light (1: n-hexane; 2: benzene; 3: dichloromethane; 4: acetone; 5: acetonitrile). | ||
As the solvent polarity rises up, the emission wavelengths make considerably red shifts except V4 in MeCN (Table 1). It is assumed that the blue shift in MeCN may well be induced by some unknown interactions between V4 and the solvent. This positive solvatochromism implies that a remarkably enlarged dipole moment accompanying with significant ICT effect occurs on the excited state of each compound. Moreover, the wavelength shift from in n-hexane to in acetone is respectively 80 nm for V1, 119 nm for V2, 88 nm for V3 and 115 nm for V4. Considering such shift as an indicator to roughly differentiate the extent of ICT effect, it is evidently that the extent is larger in V2 and V4 than in V1 and V3. Next, the quantum yields of this family in acetone are used as another factor to finely divide the ICT extent. It is measured that they are respectively 0.436 (±0.025), 0.113 (±0.008), 0.269 (±0.017) and 0.025 (±0.004) for V1–V4 (Table 1). Therefore, the extent of ICT effect is in the order of V1 < V3 < V2 < V4, which means that both the number and the location of vinyl have profound impact on it. A V-shaped compound with the more number of vinyl exhibits the stronger ICT effect, while a fluorophore with a vinyl introduced on the electron-withdrawing group instead of on the electron-donating one produces a heavier ICT effect.
| Compd. | λem (nm) | Φa | ||||
|---|---|---|---|---|---|---|
| n-Hexane | Benzene | CH2Cl2 | Acetone | MeCN | Acetone | |
| a Using quinine sulfate in 0.1 M sulfuric acid solution (Φ = 0.55) as the reference. | ||||||
| V1 | 443 | 471 | 500 | 523 | 528 | 0.436 (±0.025) |
| V2 | 459 | 513 | 551 | 578 | 586 | 0.113 (±0.008) |
| V3 | 460 | 499 | 531 | 548 | 555 | 0.269 (±0.017) |
| V4 | 490 | 535 | 587 | 605 | 536 | 0.025 (±0.004) |
Generally, AIE effect is referred to the phenomenon that solution of a compound is faintly or not emissive, but its aggregation state (including powder or suspension) is intensely emissive.15 As the quantum yields of V2 and V4 in MeCN are less than 0.01, water is added as a poor solvent into the MeCN solution of them to check their AIE activity. It is shown (Fig. 3 and S5, ESI†) that the emission intensity is extremely low when the water fraction in MeCN/H2O mixture is less than 50%, but it is abruptly increased when the water content is respectively enhanced to over 70% for V2 and 60% for V4. Due to the good hydrophobicity of vinyl, the threshold of water fraction required to produce the emission intensity jump is obviously reduced for V4. For both V2 and V4, the emission intensity is at least 100-fold higher in MeCN/H2O (5![[thin space (1/6-em)]](https://www.rsc.org/images/entities/char_2009.gif) :95, v/v) mixture than in pure MeCN solution. The dynamical scattering light (DSL) measurements (Fig. S6, ESI†) demonstrate that well-dispersed nano-particles with the averaged diameter in 392.1 nm for V2 and 536.8 nm for V4 are formed in MeCN/H2O (5:95, v/v) mixture, which confirms that the dramatically enhanced fluorescence intensity in aqueous binary mixture with large water content originates from the emission of the aggregated molecules. Additionally, the emission wavelengths of the two compounds in this aqueous mixture (532 nm for V2 and 580 nm for V4) and in ground samples (535 nm for V2 and 585 nm for V4) are very close to each other, which indicates that out-of-order aggregates are generated in MeCN/H2O mixture, because the ground samples are verified to be in amorphous phase by powder X-ray diffraction (PXRD).
:95, v/v) mixture than in pure MeCN solution. The dynamical scattering light (DSL) measurements (Fig. S6, ESI†) demonstrate that well-dispersed nano-particles with the averaged diameter in 392.1 nm for V2 and 536.8 nm for V4 are formed in MeCN/H2O (5:95, v/v) mixture, which confirms that the dramatically enhanced fluorescence intensity in aqueous binary mixture with large water content originates from the emission of the aggregated molecules. Additionally, the emission wavelengths of the two compounds in this aqueous mixture (532 nm for V2 and 580 nm for V4) and in ground samples (535 nm for V2 and 585 nm for V4) are very close to each other, which indicates that out-of-order aggregates are generated in MeCN/H2O mixture, because the ground samples are verified to be in amorphous phase by powder X-ray diffraction (PXRD).
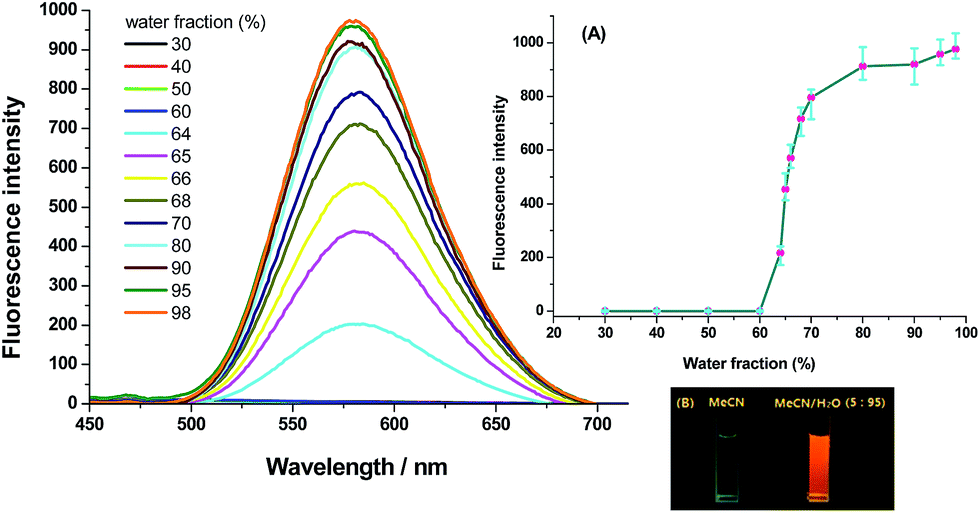 | ||
| Fig. 3 Emission spectra of V4 (50 μM) in MeCN with varied water fraction [inserted: (A) the fluorescence intensity of V4 in MeCN with varied water fraction; (B) photos of V4 in MeCN and MeCN/H2O (v/v, 5:95) mixture]. | ||
Polymorphism-induced tunable emission
Unlike in solution, the solid-state fluorescence intimately depends on molecular packing, conformational flexibility and intermolecular interactions, while any modification of molecular arrangement and conformation would inevitably affect the HOMO–LUMO energy levels of a fluorophore and consequently alter its optical property. Hence, polymorphism whose several crystals have dramatically different molecular array and conformation from each other is an important approach to multicolour and tunable emission.16 The variations of crystallization conditions like solvents, temperature, concentrations, pH values and so on strongly influence the ultimate arrangement of molecules and make polymorphism possible.Through the recrystallization of the compound V3 purified by column chromatography in ethanol under different conditions, two polymorphs with different fluorescence colours are respectively obtained. The green one (V3(G)C) is generated by dissolving V3 at 50 °C and cooling it rapidly to 0 °C, while the yellow one (V3(Y)C) is formed by dissolving V3 at 80 °C and slowly cooling it to room temperature. Under an electron microscope, it is clearly shown that V3(Y)C is needle crystals but V3(G)C is flake ones (Fig. 5A and B). Actually, their shapes can be readily distinguished even by the naked eyes. PXRD patterns indicate that they belong to the entirely different crystalline phases whose sharp and intense peaks correspond to distinctive 2θ angles (Fig. 4A), while the emission wavelengths are respectively centred at 519 nm for V3(G)C and 535 nm for V3(Y)C (Fig. 4B). When the pristine V3(Y)C sample is fumed in acetone vapour for 30 min, its fluorescence colour turns from yellow to green. Such change can also be fulfilled by fuming the ground sample (V3(Y)FC) in acetone vapour for 3 min. Obviously, particles with smaller size are much easier to carry out this conversion. Both PXRD and emission spectra indicate that identical patterns and wavelengths to those of pristine V3(G)C sample occur on the fumed V3(Y)FC or V3(Y)C samples (Fig. S7 and 8, ESI†), which confirm that a crystalline transformation can be readily achieved from V3(Y)C to V3(G)C. However, V3(G)C can be converted into V3(Y)C by neither vapour fuming nor annealing treatment. Moreover, when the melted V3(G)C is either very slowly cooled to room temperature or rapidly quenched in liquid nitrogen, each resulted sample is quite fragile and ready to be crushed into powder whose solid-state emission wavelength is the same as that of the ground V3(G)am sample (Fig. S9, ESI†). This result indicates that recrystallization from melted state, which is a common method to realize the transformation between polymorphs, is ineffective for the change from V3(G)C to V3(Y)C.
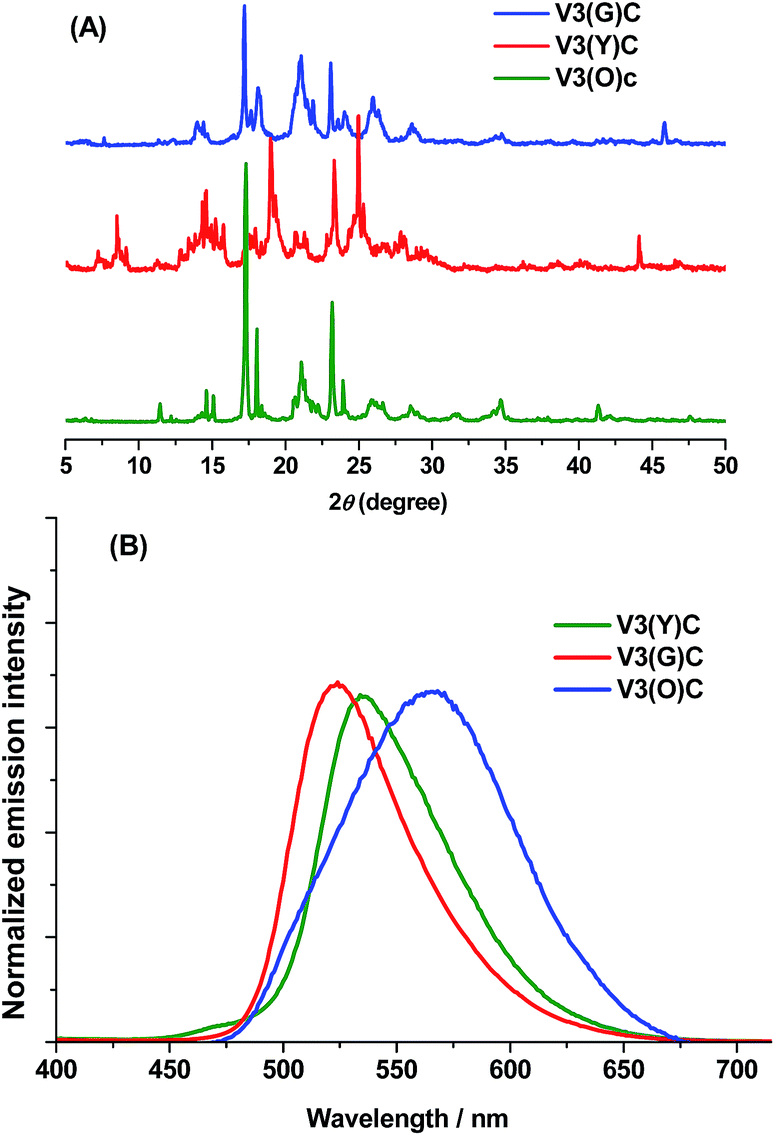 | ||
| Fig. 4 PXRD patterns (A) and solid-state emission spectra (B) of three crystalline forms of V3. | ||
According to Ostwald's step rule,17 it is presumed that V3(Y)C should be in thermodynamically more stable state than V3(G)C. Based on this assumption, it would be expected that the transformation from V3(G)C to V3(Y)C could smoothly occur by vapour fuming or annealing treatment. However, the conversion between V3(Y)C and V3(G)C does not actually take place in this way. As the thermal gravimetric analysis (TGA) (Fig. S10, ESI†) indicates that there is only a slight weight loss of V3(G)C until its melting point, it may be safely deduce that V3(G)C is not a pseudopolymorph and its different solid-state emission from that of V3(Y)C should not be caused by the participation of solvent molecules.
Subsequently, thermal properties of V3(G)C and V3(Y)C are investigated by differential scanning calorimetry (DSC) (Fig. S11†). It is illustrates that a branched endothermic peak is presented on the curve of V3(G)C whose first tip is centred at 104.5 °C. Below this temperature, none of other peak occurs. Hence, this endothermic peak is assigned as the melting peak of V3(G)C. The branches on the peak should be caused by the crystal defects of the sample, as intact crystals of V3(G)C without defects cannot be available for us. On the curve of V3(Y)C, before the melting peak located at the same temperature as that of V3(G)C, an additional endothermic peak at 100.1 °C can be readily observed. This result demonstrates that a phase transformation involving the molecular reorganization from V3(Y)C to V3(G)C really takes place just as what have been verified by PXRD and solid-state emission spectra. Since the V3(Y)C sample for DSC measurement contains particles suitable for single crystal X-ray diffraction, the melting peak on its DSC curve is completely convergent without any branch. The DSC curves reveal that V3(Y)C and V3(G)C are enantiotropic polymorphs, but the one-way phase change from the presumably low energy V3(Y)C to the high energy V3(G)C is rarely unusual and seems to be related to their molecular packing modes (vide infra).
Interestingly, the fluorescence colour further turns into orange in 565 nm (Fig. 4B) when the ground V3(Y)FC sample is fumed for 30 min. Similar case also occurs on the ground V3(G)am sample. PXRD pattern demonstrates that the orange sample (V3(O)C) is also in crystalline state, and its peaks are very similar to those of the pristine V3(G)C sample (Fig. 4A). Obviously, the difference of emission between V3(O)C and V3(G)C should not be attributed to their different conformations in crystalline phase. However, V3(O)C cannot be gained by annealing of V3(Y)FC or V3(G)am, even if the treatment time is largely prolonged.
In addition to polymorphism involving molecules with different conformations, the other important approach to tunable solid-state emission is micro-/nano-fabrication, by which crystals with the same molecular conformations are assembled into micro-/nano-scaled particles in specific shapes.18 Hence, we are encouraged to investigate the shapes of V3(O)C particles, as V3(O)C and V3(G)C have the same PXRD patterns but display the different fluorescence colours. The photo of a V3(O)C crystalline particle taken under an electron microscope (Fig. 5C) clearly shows that branches with sharp dentate tips are regularly arranged into a kind of fractal structure, where the growth lines are readily observable, just like the veins on a leaf with the similar fractal geometry (Fig. 5D). Very possibly, it is such particular shape that makes V3(O)C emit orange fluorescence.
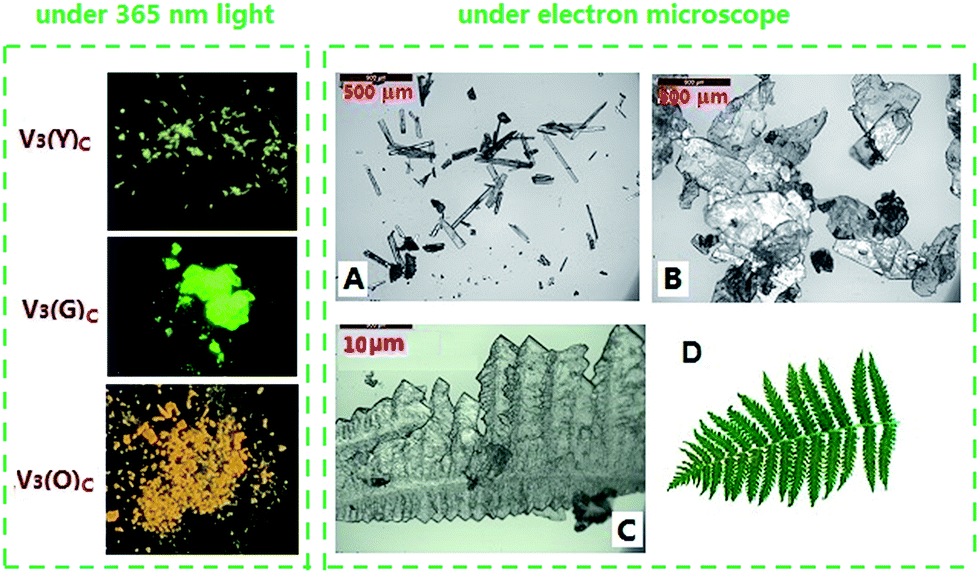 | ||
| Fig. 5 Photos of three polymorphic forms of V3 in crystalline state taken under 365 nm UV light (left) and electron microscope (right) (A: V3(Y); B: V3(G); C: V3(O); D: a leaf with the similar fractal structure as a V3(O) particle). | ||
A reasonable hypothesis for the micro-fabrication of V3(O)C involves a dynamic dissolution–recrystallization process. Under short-time vapour fuming, solvent molecules can just diffuse inward into V3(Y)FC or V3(G)am particles but not dissolve them, offering V3 molecules some extent of mobility to be reorganized into V3(G)C. In prolonged exposure to vapour, the formed tiny V3(G)C crystals are gradually dissolved in the vapour. When solvent molecules leave off, V3 molecules are preferably recrystallized and self-assembled into V3(O)C with unique fractal structure. As annealing treatment below melting point cannot provide particles with the sufficient mobility to make macroscopically morphological change, V3(O)C crystals are unable to be obtained by annealing of V3(Y)FC or V3(G)am powder.
Solid-state emission under force stimuli
Due to the lack of strong intermolecular interactions like π-π overlaps, V1–V4 exhibit intensely solid-state emission whose quantum yields determined by using an integrating sphere are 0.434 (±0.021) (V1), 0.565 (±0.025) (V2), 0.621 (±0.027) (V3(G)C), 0.513 (±0.035) (V3(Y)C), 0.335 (±0.018) (V3(O)C) and 0.317 (±0.020) (V4), respectively. Similar to that in solution state, the pristine V1 and V4 samples in solid state correspondingly has the shortest and longest emission wavelength. Different from that in solution state, however, both the as-prepared V3(G)C and V3(Y)C samples display longer emission wavelengths than V2. Apparently, intermolecular interactions in solid state should account for such difference. For pristine V1, V2, V4 and V3(G)C samples, each of them is MFC-active with vividly contrasted color change before and after force stimuli. Under exposure to force stimuli, a largely wide and nearly successive range of solid-state emission wavelengths can be achieved on these V-shaped fluorophores by subtle structure modification (Fig. 6). However, it seems that their emission shifts (30–40 nm) under force stimuli are related to neither the number nor the position of vinyl. The detailed experimental and theoretic research in our previous work has verified that not only the extent of ICT effect at single molecular level but also intermolecular interactions at supramolecular level have profound impact on MFC activity of a V-shaped fluorophore. Therefore, it seems that some unknown compromises between ICT extent and intermolecular interactions result in the apparently structure-irrelevant emission shift in this family.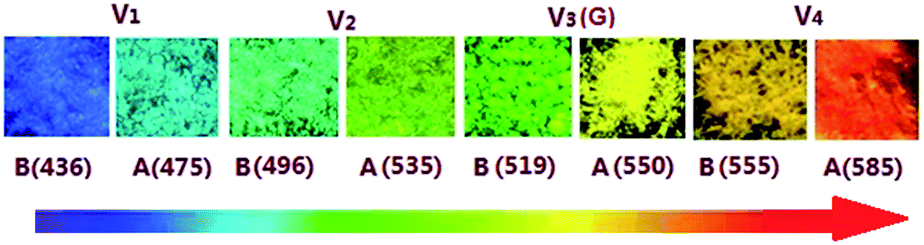 | ||
| Fig. 6 Photos of V1–V4 before and after grinding under 365 nm UV light (B: before grinding; A: after grinding; unit: nm). | ||
In order to have a deep insight of the MFC activity in this family, PXRD measurements are carried out on the samples of V1–V4. The corresponding patterns of V1, V2 and V4 (Fig. S12–14, ESI†) clearly indicate that transformations from crystalline to amorphous phase take place on them by grinding, and such morphology-dependent conversion can be reversibly recovered with robust fatigue resistance via fuming or annealing the ground samples, providing the restored samples with the emission wavelengths nearly identical to those of the as-prepared ones (Fig. S15–17, ESI†). The similar case occurs on V3(G)C (Fig S18 and 19, ESI†) but not on V3(Y)C, because the ground V3(Y)FC presents the same emission spectra as the pristine V3(Y)C (Fig. S8, ESI†). The PXRD pattern (Fig. S7, ESI†) demonstrates that a crystalline phase is still maintained by V3(Y)FC even if it is vigorously and thoroughly ground. Since V3(G)C and V3(Y)C polymorphs have the same chemical structure, the MFC inertia of V3(Y)C should be attributed to its particular packing mode, which is confirmed by the X-ray crystallographic analysis (vide infra). Moreover, the emission wavelength of the ground V3(O)am sample makes a unique blue shift (Fig. S20, ESI†) due to the destruction of the fractal structure, which is equivalent to that of V3(G)am. By fuming V3(O)am for 1 min or annealing it for 3 min, its emission wavelength is further hypsochromically shifted to be identical to that of V3(G)C. PXRD patterns (Fig. S21, ESI†) verify that the ordered structures identical to V3(G)C are completely recovered on the fumed or annealed V3(O)am sample. For V3(O)am, it can be smoothly converted into V3(O)C by prolonged exposure to solvent vapour, just as the cases happen on V3(Y)FC or V3(G)am. Herein, a schematic diagram which describes the transformations among various forms of V3under different conditions is summarily presented in Fig. 7.
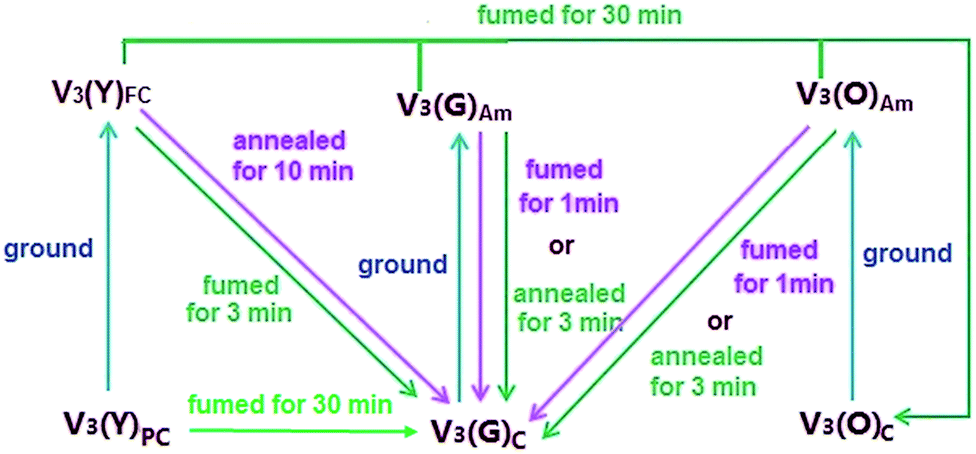 | ||
| Fig. 7 Schematic diagram of transformations among different forms of V3 (C: in crystalline phase; FC: in crystalline phase with fine particles; PC: in pristine crystalline phase; Am: in amorphous phase). | ||
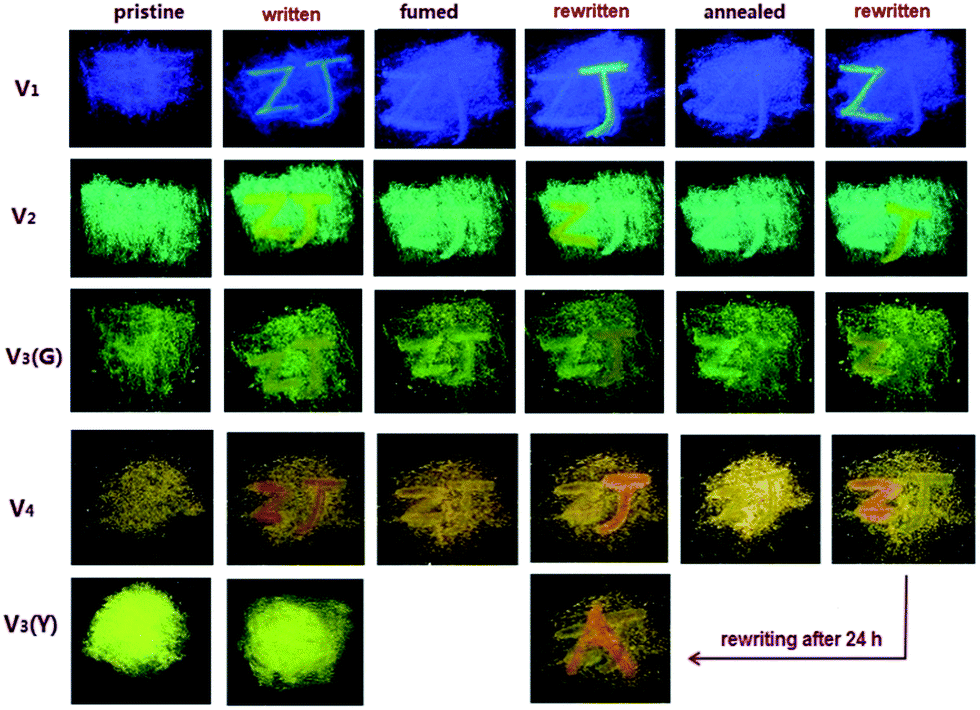
The films made by spreading out the tiny crystalline particles of these MFC-active compounds on filtrate paper can be used as the erasable mediums for information storage (Fig. 8). Initially, two letters “Z” and “J” in vivid contrast from the background are written on the films by using a thin glass rod. In order to produce the readily observable letters on the films, the places on which the letters are written have to be repeatedly smeared by the rod, making the writing traces stay there. After the films are fumed in acetone vapor, the colors of the letters are fully restored into those of the backgrounds, even if the writing traces are still remained. Subsequently, the letter “Z” or “J” can be rewritten on the fumed films, whose colors are the same as that of the initially written ones. After annealing the films at 80 °C, the colors of the rewritten letters are completely faded again into those of the backgrounds, and the third-time writing of letter “Z” or “J” can be easily carried out on the annealed films. Actually, the above writing-erasing process is able to be repeated for at least 20 times without obvious fatigue. However, any color change does not occur on the V3(Y)C film under the similar treatment.
 | ||
| Fig. 8 Photos of letters written on compound films taken under 365 nm UV light. | ||
For all the MFC-responsive members, the time consumed by the ground samples to be fully recovered into crystalline phase is much shorter via annealing than via fuming, which means that solvent vapour is more efficient than heat to rebuild the ordered structure. Additionally, it takes each compound different time to be restored from amorphous phase. The time required by fuming is 30 min for V1, 1 min for V2 and V3(G)C, and just 10 s for V4, while the time needed by annealing is 1 h for V1, 2–3 min for V2 and V3(G)C, and only 30 s for V4. Actually, the recovery of V4 is so ready that an isothermal phase transformation can even spontaneously take place at room temperature. The solid-state emission spectra (Fig. S22, ESI†) show that the emission wavelength of the ground V4 sample is progressively blue-shifted until it is the same as that of the pristine sample after 24 h. Such automatic recovery can be directly observed on the V4 film with the already written letter “Z”, where another letter “A” can be smoothly rewritten on it after it is stood at room temperature for 24 h (Fig. 8). These results indicate that the existence of vinyl facilitates the recovery of corresponding samples from random to ordered structure.
X-ray crystallographic analysis
In addition to PXRD measurements, X-ray crystallographic analysis is another important way to explore the nature of the MFC activity in this family. Herein, high quality crystals of V1, V2 and V3(Y)C are gained by recrystallization of corresponding compound in EtOH/MeCN mixture. However, V3(G)C crystal with sufficient thickness and no defect is unable to be available and V4 one is full of cracks even if it has large enough 3D size. Hence, the satisfactory crystallographic data are obtained for neither V3(G)C nor V4 by our best effort.Fig. 9 demonstrates that several weak second-order forces like C–H⋯π interactions and C–H⋯N hydrogen bonds rather than π–π overlaps should be responsible for the efficient immobilization of the conformations in V1, V2 and V3(Y)C crystals. X-ray diffraction reveals that H-bonds participated by N atoms on dimethylamino-phenyls emerge in each of these crystals, and it is suggested that the collapse of lattices and the destruction of H-bonds due to the protonation at these N atoms should account for the liquidation of them into films with the quenched fluorescence when they are exposed to trifluoroacetic acid (TFA) vapour. As V4 has the similar structure to those of V1–V3, it is safely to deduce that the liquidation of V4 in presence of TFA vapour may well be attributed to the same reason as that for liquidation of V1–V3, even if the crystallographic data of V4 is lack under the current condition.
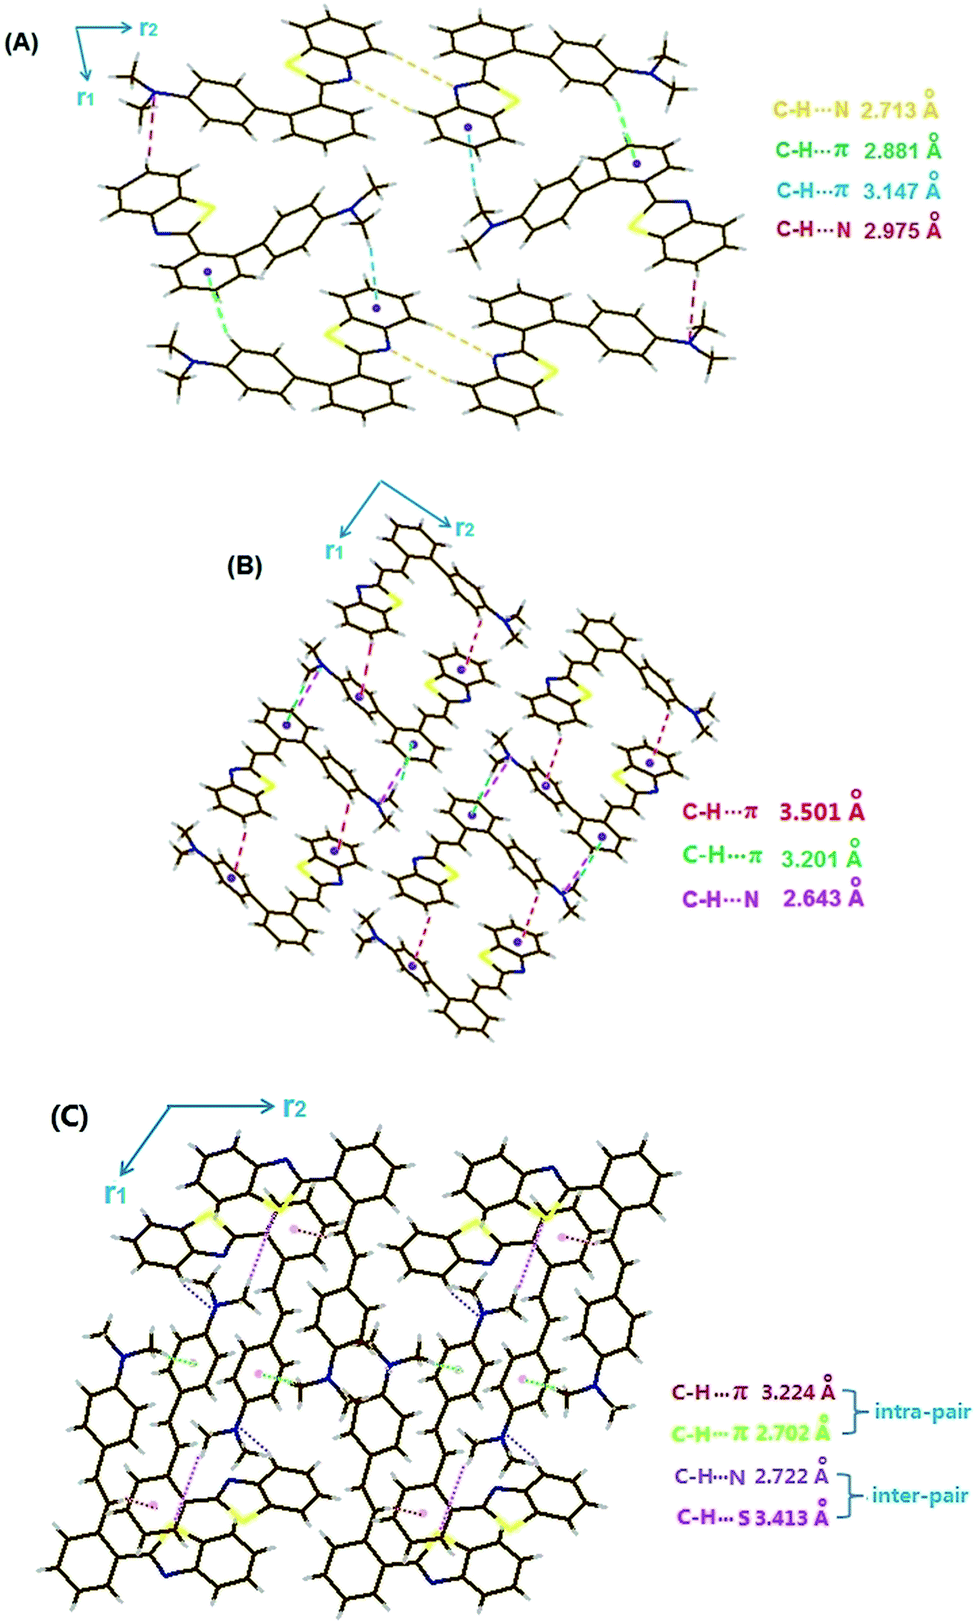 | ||
| Fig. 9 Molecular stacking of V1 (A), V2 (B) and V3(Y) (C). | ||
For V1, V2 and V3(Y)C crystals, each of them belongs to the monoclinic crystal system and the P21/c space group. In V1 crystal, the adjacent (benzo[d]thiazol-2-yl)phenyl moieties are oppositely approached along the r2 direction via double H-bonds (2.713 Å), producing “open” substructures with outward dimethyl-aminophenyls. Meanwhile, the adjacent molecules along the r1 direction interact with each other via C–H⋯N hydrogen bond and the electron-deficient moiety are quite planar. Consequently, it is reasonable to deduce that the damages of the intermolecular interactions due to the planarization of conformation induced by the rotation of dimethylaminophenyl under force stimuli should account for the red-shifted emission of the amorphous samples. For a V3(Y)C crystal, however, it is packed by special molecular pairs (note: they are not dimers formed via intermolecular interactions between two crystallographically equivalent adjacent molecules like the cases in V1 and V2 crystals). In each pair, the double crystallo-graphically non-equivalent molecules interact with each other via two forms of C–H⋯π forces (2.702 and 3.224 Å), which make the global conformation of the both molecules still largely distorted and the opposite orientation of the two 2-benzo[d]thiazolyls in crystalline phase (Fig. S23C, ESI†). If a pair is treated as a molecule, the similar packing mode to that of V2 occurs in V3(Y)C with the opposite arrangement of 2-benzo[d]thiazolyl along the r1 direction via two H-bonds (C–H⋯N in 2.722 Å and C–H⋯S in 3.413 Å), producing the “closed” tube-shaped substructures with inward dimethylaminophenyl-4-styryls. In lack of the interactions along the r2 direction, the pairs are stacked into 1D chains. Fully different from the break of interactions between the adjacent individual molecules in both V1 and V2 crystals, it is assumed that only the interactions between the adjacent pairs rather than those inside pairs can be destroyed under force stimuli in V3(Y)C crystal. Hence, the undamaged intermolecular interactions make the conformation change hardly take place inside pairs, which results in the heavy resistance of V3(Y)C sample against force disruption.
Although the crystallographic data of V3(G)C is unavailable for us at present, it is deduced that the molecular packing in this crystal may well resemble that in V1 and V2 participated by individual molecules, due to their similar MFC behaviours. The abnormal transformation from presumably lower energy V3(Y)C into higher energy V3(G)C reminds us of the similar case taken place on the two polymorphs of 2-octyl-6-[(4-(octyloxy)naphthalen-1-yl)ethynyl]-1H-benzo[de]isoquinoline-1,3(2H)-dione.19 In this report, it was suggested that some structural link between dynamic motion and stability of a certain packing mode should account for the abnormal polymorph change from lower to higher energy state. Hence, we are enlightened to consider that the packing in V3(Y)C established by the unique molecular pairs seems to be the possible reason for the unusual conversion from a presumably stable to a metastable crystal in our work, as a polymorph crystallized by molecular pairs is very rare in most of polymorphic systems. However, the exact nature for this peculiar transformation from V3(Y)C to V3(G)C is still currently unknown.
Conclusion
Herein we describe the synthesis and photophysical characteristics of some V-shaped fluorophores, on which varied number of vinyl is introduced at different position of the skeleton. These compounds, which are intensely emissive in solid state and sensitive to force stimuli, can be gained in good yields by using readily available starting materials via a straightforward and reliable synthetic route. The structure–property relationship reveals that many physical features of this family are closely related to the number and position of vinyl: (1) solid-state emission wavelengths, solvota-chromic effect, solution-state quantum yields and AIE activity heavily depend on both the number and the site of vinyl; (2) solution-state emission wavelengths and time consumed for samples to be restored from amorphous to crystalline phase only rely on the number rather than the location of vinyl; (3) emission wavelength shifts before and after force stimuli seem to be dependent on neither the number nor the position of vinyl. By the subtle structure modification, a largely wide and approximately successive range of solid-state emission wavelengths can be achieved on these V-shaped fluorophores in exposure to force stimuli.Except for MFC effect induced by morphologic change, V3 turns up tunable fluorescence colors by means of polymorphism and shape-dependent micro-fabrication, by which the unique fractal structure of particles is probably produced by the self-assembling of V3 molecules through a dissolution–recrystallization process. It is suggested that the unbroken intermolecular interactions inside the particular molecular pairs may well account for the resistance of V3(Y)C crystal against force stimuli. Although it is presumed that the abnormal phase transformation from apparently stable V3(Y)C to metastable V3(G)C may also be ascribed to these molecular pairs, the real cause for such transformation is still unclear. Future studies will continue to probe this question and the development of V3(O)C with attractive fractal structure as promising material in optoelectronic field.
Conflicts of interest
There are no conflicts of interest to declare in this work.Acknowledgements
We are grateful for the financial support from Zhejiang Provincial Top Key Academic Discipline of Chemical Engineering and Technology.References
-
(a) A. Beneduci, S. Cospito, M. La Deda, L. Veltri and G. Chidichimo, Nat. Commun., 2014, 5, 3105 CrossRef PubMed
; (b) W. R. Browne, M. M. Pollard, B. De Lange, A. Meetsma and B. L. Feringa, J. Am. Chem. Soc., 2006, 128, 12412–12413 CrossRef CAS PubMed
-
(a) Y. Q. Dong, J. W. Y. Lam and B. Z. Tan, J. Phys. Chem. Lett., 2015, 6, 3429–3436 CrossRef CAS PubMed
-
(a) A. Pucci, F. D. Cuia, F. Signori and G. Ruggeri, J. Mater. Chem., 2007, 17, 783–790 RSC
-
(a) S. Hirata and T. Watanabe, Adv. Mater., 2006, 18, 2725–2729 CrossRef CAS
-
(a) A. Kishimura, T. Yamashita, K. Yamaguchi and T. Aida, Nat. Mater., 2005, 4, 546–549 CrossRef CAS PubMed
-
(a) W. Z. Yuan, Y. Tan, Y. Gong, P. Lu, J. W. Y. Lam, X. Y. Shen, C. Feng, H. Y. Sung, Y. Lu, I. D. Williams, J. Z. Sun, Y. Zhang and B. Z. Tang, Adv. Mater., 2013, 25, 2837–2843 CrossRef CAS PubMed
-
(a) Y. Sagara and T. Kato, Angew. Chem., Int. Ed., 2011, 50, 9128–9132 CrossRef CAS PubMed
-
(a) X. Zhang, Z. Chi, J. Zhang, H. Li, B. Xu, X. Li, S. Liu, Y. Zhang and J. Xu, J. Phys.
Chem. B, 2011, 115, 7606–7611 CAS
-
(a) L. Bu, M. Sun, D. Zhang, W. Liu, Y. Wang, M. Zheng, S. Xue and W. Yang, J. Mater. Chem. C, 2013, 1, 2028–2035 RSC
-
(a) H. Li, X. Zhang, Z. Chi, B. Xu, W. Zhou, S. Liu, Y. Zhang and J. Xu, Org. Lett., 2011, 13, 556–559 CrossRef CAS PubMed
- X.-L. Lu and M. Xia, J. Mater. Chem. C, 2016, 4, 9350–9358 RSC
- H.-Y. Fu, N. Xu, Y.-M. Pan, X.-L. Lu and M. Xia, Phys. Chem. Chem. Phys., 2017, 19, 11563–11570 RSC
-
(a) R. Wei, P. Song and A. Tong, J. Phys. Chem. C, 2013, 117, 3467–3474 CrossRef CAS
-
(a) P. S. Hariharan, D. Moon and S. P. Anthony, J. Mater. Chem. C, 2015, 3, 8381–8388 RSC
-
(a) Y. Hong, J. W. Y. Lam and B. Z. Tang, Chem. Commun., 2009, 4332–4353 RSC
-
(a) A. J. Cruz-Cabeza, S. M. Reutzel-Edens and J. Bernstein, Chem. Soc. Rev., 2015, 44, 8619–8635 RSC
- T. Threlfall, Org. Process Res. Dev., 2003, 7, 1017–1027 CrossRef CAS
-
(a) A. Patra, N. Hebalkar, B. Sreedhar, M. Sarkar, A. Samanta and T. P. Radhakrishnan, Small, 2006, 2, 650–659 CrossRef CAS PubMed
- C. Peebles, C. D. Wight and B. L. Iverson, J. Mater. Chem. C, 2015, 3, 12156–12163 RSC
Footnote |
| † Electronic supplementary information (ESI) available: 1H and 13C NMR spectra, MS spectra, absorption and emission spectra, PXRD patterns, DLS diagrams, X-ray crystallography and others. CCDC 1551666 and 1551667. For ESI and crystallographic data in CIF or other electronic format see DOI: 10.1039/c7ra10432d |
| This journal is © The Royal Society of Chemistry 2017 |