 Open Access Article
Creative Commons Attribution 3.0 Unported Licence
An amorphous dual action electrocatalyst based on oxygen doped cobalt sulfide for the hydrogen and oxygen evolution reactions†
Ummul K. Sultana,
Tianwei He,
Aijun Du and
Anthony P. O'Mullane
 *
*
School of Chemistry, Physics and Mechanical Engineering, Queensland University of Technology (QUT), GPO Box 2434, Brisbane, QLD 4001, Australia. E-mail: anthony.omullane@qut.edu.au
First published on 4th December 2017
Abstract
The fabrication of electrocatalysts that are active for more than one of the water splitting reactions has gained significant momentum. Here we demonstrate such a material produced via an electrochemical process that is based on amorphous cobalt sulfide films doped with oxygen which are active for the hydrogen evolution reaction (HER) and oxygen evolution reaction (OER) under alkaline conditions. The optimum electrochemical protocol was found to be a repetitive potential cycling approach rather than a constant potential to create an amorphous CoSx film containing oxygen. Samples with a Co![[thin space (1/6-em)]](https://www.rsc.org/images/entities/char_2009.gif) :
:![[thin space (1/6-em)]](https://www.rsc.org/images/entities/char_2009.gif) S ratio of 1.56
S ratio of 1.56![[thin space (1/6-em)]](https://www.rsc.org/images/entities/char_2009.gif) :
:![[thin space (1/6-em)]](https://www.rsc.org/images/entities/char_2009.gif) 1 were found to be active for the HER in 0.5 M H2SO4, phosphate buffer and 0.1 M NaOH. Significantly this activity is comparable to highly crystalline nanomaterials of cobalt sulfide. Density functional theory calculations indicated that a reduced S–Co coordination number, as encountered in amorphous materials, leads to an optimum binding energy for hydrogen adsorption on the material which facilitates good electron transfer kinetics. In addition, this material was also active for the OER in alkaline conditions with evidence of conversion to cobalt oxide which gave a low overpotential of 370 mV for an applied current density of 10 mA cm−2 with a Tafel slope of 67 mV dec−1. This simple approach shows promise for the fabrication of a dual action electrocatalyst for electrochemical water splitting under alkaline conditions.
1 were found to be active for the HER in 0.5 M H2SO4, phosphate buffer and 0.1 M NaOH. Significantly this activity is comparable to highly crystalline nanomaterials of cobalt sulfide. Density functional theory calculations indicated that a reduced S–Co coordination number, as encountered in amorphous materials, leads to an optimum binding energy for hydrogen adsorption on the material which facilitates good electron transfer kinetics. In addition, this material was also active for the OER in alkaline conditions with evidence of conversion to cobalt oxide which gave a low overpotential of 370 mV for an applied current density of 10 mA cm−2 with a Tafel slope of 67 mV dec−1. This simple approach shows promise for the fabrication of a dual action electrocatalyst for electrochemical water splitting under alkaline conditions.
Introduction
The ever increasing global demand for energy can only be satisfied in an environmentally sustainable manner with the rapid uptake of clean renewable energy sources. It is well documented that the storage of intermittent energy from sources such as wind and solar is urgently required. Fortunately, there are several approaches which can be undertaken to tackle this issue. One such approach that has been identified since the 1970s is using non-polluting hydrogen as the main energy carrier, where the overall system was termed as the hydrogen economy by Bockris.1 Although there are many ways to produce hydrogen, doing so in an environmentally friendly manner is paramount for realising such an economy. Therefore, the generation of hydrogen via electrochemically splitting water into hydrogen and oxygen has received significant attention because the electrolyser can be powered by electricity generated from renewable energy sources. During electrolysis the hydrogen evolution reaction (HER) can only occur in an efficient manner when a suitable electrocatalyst is used.2 It is well established that the platinum group metals including Pt, Rh and Ir are the most active electrocatalysts for this reaction.3 Although alternative catalysts to these precious metals can achieve high efficiency and activity, sustaining this for prolonged periods is still quite a challenge,4–13 and therefore has attracted much attention.14–31 There are quite a number of low cost and earth abundant materials that have been investigated, including transition metal alloys,32–34 transition metal oxides and hydroxides,35–39 chalcogenides,40,41 carbides,42–49 and phosphides50–52 as well as entirely non-metallic catalysts.53,54In particular, cobalt based compounds such as sulfides,55,56 nanocomposites of CoS2 using reduced graphene oxide (RGO) and carbon nanotubes (CNT),37 amorphous CoSx composed of oxide and sulphide clusters,57 phosphides,49,58–60 phosphosulphides,61 and selenide complexes like CoS2xSe2(1−x) (ref. 62) have been identified as robust electrocatalysts for the HER. For synthesizing these HER catalysts most researchers have adopted wet chemical methods, vapour deposition,63 annealing64 or hydrothermal synthesis followed by temperature programmed reduction (TPR).65 However, electrochemically deposited nanomaterials have been shown to also perform as effective HER catalysts. The advantage of this approach is that it easy to perform, scalable, does not require expensive equipment and can be undertaken under ambient conditions.66 It also has a number of freedom parameters to tune the composition, morphology and density of active sites which is another major advantage.67–73 Recent theoretical work by Kornienko et al. suggested that amorphous CoSx where oxygen is incorporated into the material is also a candidate for the HER.57 Shanmugam et al. have reported that electrodeposited nickel iron sulphides on nickel foam74 and hydrothermally grown NiCo2S4 nanowires on nickel foam75 show bifunctional activity for the HER and the OER.
In addition there has been significant interest in developing materials that are not only active for the HER but also the oxygen evolution reaction (OER). In this area the majority of cobalt based materials reported are the oxides, hydroxides or oxy-hydroxides rather than sulphide based moieties. Cai et al. have demonstrated that oxygen incorporated into cobalt sulphide nanocubes are active for the OER, although the method of synthesis was quite involved using several chemical steps and high temperature annealing.76 However this material was not tested for the HER and to date no cobalt sulfide based materials have been reported that are active for both HER and OER. In this work we address this and use a simple and rapid electrochemical approach to deposit amorphous cobalt sulphide materials that contain oxygen, which are active for both HER and OER under alkaline conditions.
Experimental
Chemicals
Cobalt(II) nitrate hydrated (Chem-Supply) and thiourea (Sigma-Aldrich) were used as received without any further purification. Sulfuric acid (96%) was purchased from EMD chemicals. For each experiment and other washing purposes Milli-Q water (resistivity of 18.2 MΩ cm) from a Millipore Milli-Q system was used. Analytical grade chemicals and Milli-Q water were used for preparing all electrolyte solutions.Preparation of the cobalt sulphide film on glassy carbon and ITO
All the experiments were conducted using a conventional three electrode system. While depositing on glassy carbon, the working electrode was glassy carbon (area was 0.071 cm2, Bioanalytical Systems, Inc.), platinum (Bioanalytical Systems, Inc.) was the counter electrode and Ag|AgCl (3 M KCl, Bioanalytical Systems, Inc.) was the reference electrode. Some electrodeposition experiments were also performed on indium doped tin oxide (ITO) films (Delta Technologies 4–10 Ω sq−1) and were cut into 1 cm × 1 cm pieces. All the cyclic voltammetry and chronoamperometry experiments were conducted using a BioLogic VSP workstation operated by EC-lab software (version 10.44). Before every experiment the exposed area of the GC working electrode was wet polished with 0.3 μm-sized alumina powder on a micro cloth and was rinsed with Milli-Q water. Before performing any electrochemical experiment the solutions were purged with nitrogen gas. Different pH levels of the electrolyte solution were adjusted and then measured by a Metrohm 826 pH meter. The electrodeposition experiments were carried out by cyclic voltammetry and chronoamperometry techniques. After each deposition the films were washed with Milli-Q water and dried with pure nitrogen gas to remove any electrolyte solution from the surface. For all the electrochemical data the potential was converted to the RHE scale via the following formula, ERHE = EAg/AgCl + 0.059 × pH + 0.197 V. The current density reported in this work was normalized to the geometric surface area of the underlying electrode.Surface characterisation
X-ray photoelectron spectroscopy data were collected using an Omicron Multiscan Lab Ultra-high vacuum scanning tunnelling microscope (UHV-STM) where a 125 mm hemispherical electron energy analyser was incorporated. Non-monochromatic Mg Kα (1253.6 eV) X-ray source (DAR 400, Omicron Nanotechnology) was used for XPS experiments and the incident angle was 65° to the surface of the sample. The analyser passed energy of 50 eV with steps of 0.5 eV and the dwell time was 200 ms. High-resolution scans with a narrow region for Co 2p, C 1s and O 1s were taken at 20 eV pass energy, 0.1 eV steps and with a 200 ms dwell time. Besides a wide scan of low binding energy region was performed from 250 eV to 0 eV swept at high resolution. The base pressure in the analysis chamber was 1.0 × 10⁻⁹ Torr. But the pressure was 1.0 × 10⁻⁸ Torr while the measurement was done. Atomic compositions of the surface were calculated using the CasaXPS version 2.3.15 software and a linear baseline with Kratos library Relative Sensitivity Factors (RSFs). EDX was performed on a FEI Quanta 200 Environmental SEM at an operating voltage of 20 kV. Around 100 nm thick samples were prepared by the electrodeposition method. X-ray diffraction (XRD) patterns of the sample were collected using a Philips PANalytical X'pert Pro diffractometer. CuKα radiation (λ = 1.5418 Å) and a fixed power source (40 kV and 40 mA) were used. Images were captured using a Helium Ion Microscope (HIM) ORION NanoFab while the chamber pressure was 2 × 10⁻⁷ Torr, the gun pressure of gas field ion source (GFISGun) was 5 × 10⁻¹⁰ Torr and the column pressure (GFISColumn) was 9 × 10⁻⁹ Torr.Computational details
Density functional theory (DFT) as implemented in the Vienna Ab initio Simulation Package (VASP) code were employed to perform the calculations.77,78 We used the generalized gradient approximation79 in the form of the Perdew−Burke−Ernzerhof functional80 to describe exchange–correlation interactions. Blöchl's all-electron, frozen-core projector augmented wave (PAW) method81 was used to represent nuclei and core electrons. In all calculations, the van der Waals interaction was described by using the empirical correction in Grimme's scheme, i.e., DFT + D3.82 The electron wave functions were expanded using the plane waves with a cut off energy of 500 eV. The geometries were optimized until the energy and the force were converged to 0.001 eV Å−1 and 10−6 eV, respectively. For the k-point sampling, we used a single Γ point mesh 1 × 1 × 1 in reciprocal space during geometry optimization.The calculation of hydrogen binding free energy
The free energy of the adsorption atomic hydrogen (ΔG0H*) is calculated as:| ΔG0H* = ΔEH + ΔEZPE − TΔSH | (1) |
| ΔEH = EH* − E* − 1/2EH2 | (2) |
 | (3) |
 is the zero-point energy of H2 in the gas phase.
 is the entropy of H2 gas at the standard condition.84 The ΔSH can be obtained by:
 | (4) |
The calculated vibrational frequency for H2 gas is 4390 cm−1, the vibrational frequency of H adsorbed on CoS2 are 2523 cm−1, 662 cm−1, and 381 cm−1. Therefore the overall corrections are taken as:
| ΔG0H* = ΔEH + 0.25 eV | (5) |
Results and discussion
The electrodeposition of cobalt species from Co(NO3)2 in the absence and presence of thiourea at different solution pH is shown in Fig. 1. In the absence of thiourea a large cathodic process is observed on the forward sweep at all pH values which is followed by current crossover in the reverse sweep. This is highly indicative of a nucleation growth process occurring and a deposit being formed on the electrode surface.85 The reactions involved can be outlined by the following equations:86,87| 2H2O + 2e− → H2 + 2OH− | (6) |
| 2Co2+(aq) + 2e− → Co(OH)2(ads) | (7) |
| Co(OH)2(ads) + 2e− → Co(s) + 2OH− | (8) |
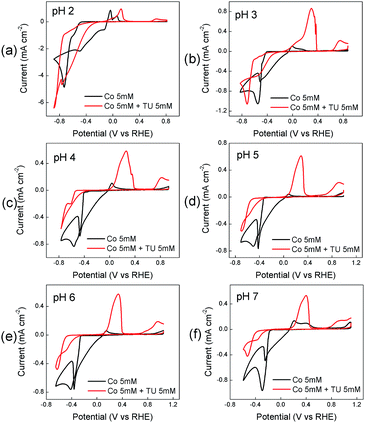 | ||
| Fig. 1 Effect of TU on the cyclic voltammetric response recorded at a GC electrode in solutions containing 0.005 M Co(II) only and 0.005 M Co(II) + 0.005 M thiourea at different pH values. | ||
A small anodic process is observed on the reverse sweep which can be attributed to the reverse of eqn (7). The position of this peak varies slightly with the pH of the electrolyte. In the presence of thiourea (TU) a significant change occurs in the cyclic voltammetric response. The magnitude of the cathodic process decreases at all pH values and is shifted to more negative potentials. This can be attributed to the formation of CoSx via the following processes:88
| CS(NH2)2 + 2OH− → S2− + OC(NH2)2 + H2O | (9) |
| Co2+ + S2− → CoSx(ads) | (10) |
The electrochemically generated hydroxide ions from the reduction of water have been reported to react with thiourea to liberate sulphide ions which complex with Co2+ ions in solution to form CoSx which precipitates onto the electrode surface. However a recent study has concluded that in fact metal sulphides are synthesised via the formation of a (NH2)2CSs–M2+–OHh− complex which decomposes into the relevant metal sulphide via the following process:89
| M2+ + CS(NH2)2 + 2OH− ⇄ M(OH)2CS(NH2)2 → MS + H2NCN + 2H2O | (11) |
On the reverse sweep a prominent oxidation peak can be seen in the presence of TU and is attributed to the oxidation of thiourea to formamide disulphide via:88
 | (12) |
After this process a smaller peak is observed towards the end of the sweep at all pH values and is attributed to the oxidation of CoSx on the electrode surface90 (this process is absent when TU is not present in the solution). Overall the behaviour over a pH range from 3–7 is quite similar showing distinct processes for TU oxidation to FD and the oxidation of CoSx at higher potential values. At pH 2 both of these processes are suppressed and indicates that thiourea is less susceptible to oxidation and also that the formation of CoSx is more inhibited.
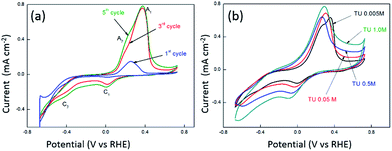
It is well established that the potential waveform used to electrodeposit materials has a significant impact on morphology and electrocatalytic activity. Therefore chronoamperometry and repetitive potential cycling were chosen as methods to electrodeposit CoSx films. Fig. S1† shows current–time transients for the electrodeposition of CoSx at different pH values and Fig. S2† shows the subsequent anodic stripping voltammograms for the deposit on the electrode surface. This is consistent with the data shown in Fig. 1 where a significant oxidation process for CoSx oxidation occurred from 0.70 V over a pH range of 4–6. If the TU concentration was increased up to 0.5 M then the amount of CoSx formation increased, as evidence by the increased oxidation process at ca. 0.80 V at all pH values (Fig. S3†). The presence of CoSx was confirmed by EDS and XPS analysis as discussed later. It was also found that at pH values of 6–7 a precipitate of Co(OH)2 formed slowly in solution and therefore was not investigated further in electrodeposition reactions. Repetitive potential cycling has been used in many studies to create highly textured surfaces which have increased surface area and electrocatalytic activity for a variety of reactions. This was shown to be good method to synthesise nickel iron sulphides which were active for both HER and OER.74 Therefore a similar approach was undertaken here and shown in Fig. 2a are repetitive cyclic voltammograms recorded at an ITO electrode in the presence of 5 mM Co2+ and 5 mM TU where the pH was not adjusted and measured to be 5.6. The anodic potential limit was decreased to avoid any CoSx oxidation and allow the build-up of the deposit on the electrode surface. The cathodic potential limit was also curtailed to avoid the formation of any cobalt metal on the electrode surface. On the first cycle (initiated at positive potential) the same behaviour as seen in Fig. 1 (pH 5 or 6) is observed whereby a cathodic process is observed at ca. −0.40 V (C2) due to the formation of CoSx. On the anodic scan a large peak A1 is observed due to the oxidation of TU to FD. Upon cycling and taking the 3rd cycle as an example a new peak C1 appears which is due to the reduction of FD back to TU (note its absence of the 1st cycle as TU was not oxidised). The magnitude of process C2 also increases in the 3rd cycle illustrating the growth of the CoSx film. This growth in process C2 can also be observed in the 5th cycle. The effect of TU concentration is shown in Fig. 2b where the 15th cycle is shown. It can be seen that the magnitude of the C2 process increases with TU concentration indicating the formation of a greater amount of CoSx on the electrode surface.
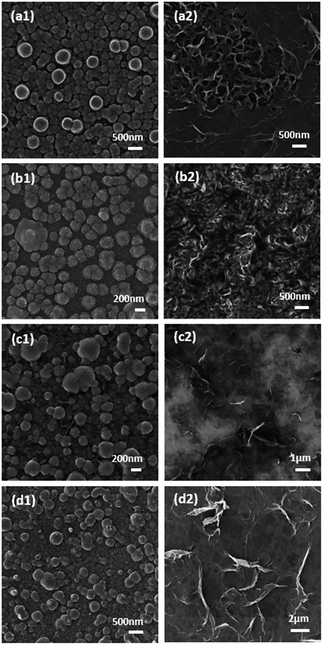
The morphology, composition and their effect on electrocatalytic performance for the HER was investigated for samples electrodeposited on a GC electrode using chronoamperometry (10 min deposition time) and repetitive cycling (15 cycles at 15 mV s−1, Fig. S4†) at pH values of 3 and 5.6 at a constant Co2+ concentration of 5 mM and TU ranging from 5 mM to 1 M. With the CA technique the surface morphologies are quite different with the change of solution pH. At pH 3 for all TU concentrations the structures are more globular like (Fig. 3a1–d1) whereas they have a distinct layered surface when the electroplating solution pH is 5.6 (Fig. 3a2–d2) which is highly indicative of the formation of cobalt sulfide.91 The layered structure is observed for all concentrations of TU that were used, however the density of the film increases with TU concentration.
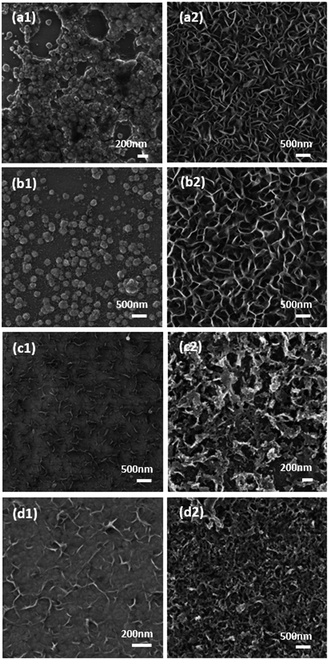
When a repetitive cycling protocol was used it can be seen that the formation of layered materials is favoured under nearly all conditions (Fig. 4). The only exception is when a low TU concentration of 5 mM is used at pH 3 where more globule like structures are seen like in the case of chronoamperometric deposition (Fig. 4a1). When the concentration of TU was increased to 0.05 M (Fig. 4b1) small layered deposits can be seen surrounding the main globule like deposits. At the higher TU concentrations the whole surface is dominated by layered structures. At pH 5.6 there is no evidence of globule like deposits and the thickness of the individual flake like deposits increases substantially with TU concentration until a thick and densely packed film is formed when 1 M TU was used (Fig. 4d2). Interestingly, it was found that all the samples synthesized through either chronoamperometry or repetitive cycling were XRD amorphous. A representative XRD pattern for the sample shown in Fig. 4c2 is presented in Fig. S5† where no diffraction peaks were observed. The presence of Co, S and O was confirmed by EDX analysis.
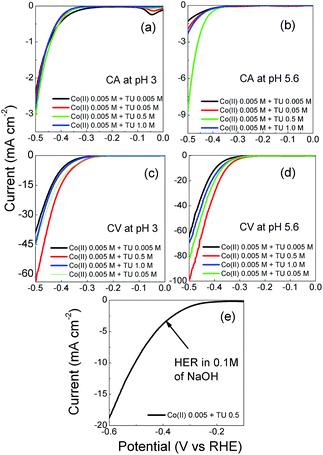
The freshly electrodeposited CoSx films were initially investigated as HER catalysts in acidic solution to identify the best material. Fig. 5a and b shows linear polarization curves recorded at the samples discussed in Fig. 3 and 4. It is immediately clear that the samples produced via constant potential deposition are not particularly active for the HER. From Fig. 5, it is evident that the samples prepared by the cyclic voltammetric protocol were much more active than those prepared by chronoamperometry and can be attributed to the significantly different deposit created on the electrode surface. The formation of this layered type material is highly critical to good HER performance. The best sample was prepared using 0.5 M TU at a pH of 5.6 (Fig. 5d). The onset potential is −0.22 V which is comparable to previous work reported for hollow cobalt sulphide nanomaterials.92 However a lower Tafel slope of 72 mV dec−1 was determined for our catalyst compared to 97 mV dec−1 in the aforementioned work. This suggests a Volmer–Tafel mechanism where the Volmer step is the rate limiting step.93 However, Tafel slopes in this case are only used as a guide to indicate the possible rate determining step. Care must be taken in interpreting such values as calculations are based on strict assumptions that do not always hold, hence the wide variation in Tafel slopes that are quoted for metal sulphide materials. The closest Tafel slope reported for cobalt sulphide materials that matches our work is by Sun et al. who reported a value of 72 mV dec−1 for highly crystalline cubic cattierite CoS2 produced via a hydrothermal method.94 It is therefore interesting to note that an amorphous material can demonstrate comparable behaviour to well defined crystalline materials for the HER. We also investigated this sample for the HER in alkaline solution (Fig. 5e) where it was found that it also maintained activity under these conditions. A Tafel slope of 142 mV dec−1 was determined which is also consistent with crystalline materials.94 In addition this material also performed well at neutral pH conditions and showed long term stability over a 24 h period (Fig. S6†) which is a significant improvement over previous work where amorphous CoSx films were unstable in neutral conditions and required annealing and electrochemical polarisation to ensure stability.56
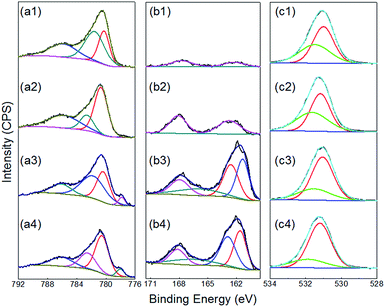
To gain further insights as to why the samples produced by repetitive cycling are more active than those formed under constant potential conditions an XPS study was conducted. Illustrated in Fig. 6a are the Co 2p spectra for samples prepared with different amounts of TU in solution using the repetitive cycling method. Significantly, the Co 2p peaks in Fig. 6a indicate that the films produced with this method are not a pure CoSx film but also contain other oxygenated species like CoO or Co(OH)2 which appear over the range of 779 to 783 eV.95–101 The peak at around 786 eV can be characterized as the shake-up satellite peak of CoO or Co(OH)2.102 At TU concentrations of 0.5 and 1.0 M another new peak can be observed at 778 eV which has been attributed to the formation of Co–S bonds.76,103 Fig. 5b represents the S 2p core level spectra where the peaks from 160 to 165 eV can be attributed to the surface absorption of oxygen with sulfur and therefore doping of the CoSx film with oxygen.76 It can be seen from the relative intensities of the S 2p peaks that the intensity of the signal for the Co–S bands increases compared with the surfaced absorbed oxygen with sulfur peak as the TU concentration increases. This is consistent with the Co 2p spectra, which shows a clear increase in the Co–S peak at 778 eV. Though the high resolution spectrum of O 1s bands are often complex and difficult to interpret,104 in this study the peaks were fitted as shown in Fig. 6c. The peak at around 531 eV (from the as deposited film) in the spectrum indicates the presence of hydroxides and oxides of Co,104 with a slight shift to lower binding energy upon the incorporation of more sulfur in the films.
The composition of all samples was then determined by XPS and is shown in Table 1. A clear trend can be seen in that the concentration of sulfur increases when more TU is added to the electrolyte for both constant potential and repetitive cycling deposition processes, whereby more sulfur is incorporated for the latter approach and is consistent with the electrochemical data. The optimum HER performance was observed for the sample deposited from 5 mM Co2+ with 0.5 M TU using repetitive potential cycling (Fig. 5d). This sample has a Co![[thin space (1/6-em)]](https://www.rsc.org/images/entities/char_2009.gif) :
:![[thin space (1/6-em)]](https://www.rsc.org/images/entities/char_2009.gif) S ratio of 1.56, increasing or decreasing this ratio did not improve performance. Interestingly, when a similar ratio was produced via the chronoamperometric approach the HER performance was quite poor and may be related to the morphology of the film. In Fig. 3c2 it is apparent that this film is very dense compared to the more open and porous structure created using the repetitive cycling protocol (Fig. 4c2) thereby facilitating access to the active sites of the catalyst.
S ratio of 1.56, increasing or decreasing this ratio did not improve performance. Interestingly, when a similar ratio was produced via the chronoamperometric approach the HER performance was quite poor and may be related to the morphology of the film. In Fig. 3c2 it is apparent that this film is very dense compared to the more open and porous structure created using the repetitive cycling protocol (Fig. 4c2) thereby facilitating access to the active sites of the catalyst.
| Process | Bath composition | Atomic % | Ratios | |
|---|---|---|---|---|
| Co | S | Co/S | ||
| CA | Co 0.005 M + TU 0.005 M | 100 | 0 | — |
| Co 0.005 M + TU 0.05 M | 99.68 | 0.32 | 311.5 | |
| Co 0.5 M + TU 0.5 M | 73.84 | 26.16 | 2.82 | |
| Co 1.0 M + TU 1.0 M | 61.42 | 38.58 | 1.59 | |
| CV | Co 0.005 M + TU 0.005 M | 98.72 | 1.28 | 77.12 |
| Co 0.005 M + TU 0.05 M | 83.04 | 16.96 | 4.89 | |
| Co 0.5 M + TU 0.5 M | 60.94 | 39.06 | 1.56 | |
| Co 1.0 M + TU 1.0 M | 55.51 | 44.49 | 1.25 | |
In order to further understand the experimentally-observed highly efficient HER performance of CoSx compounds, we calculated the hydrogen binding free energy on the CoSx catalyst as shown in Fig. 7 based on density function theory (DFT). The overall HER can be described as three steps, the initial state H+ + e−, the intermediate adsorbed H* and the final product 1/2H2.105 Hydrogen should not bind catalyst too strong and too weak and the ideal value for ΔGH is close to zero. Clearly the value of ΔGH for CoSx was quite negative (Fig. 7), which represent a very strong interaction between adsorbed H and CoSx. Therefore, it is expected that pristine CoSx exhibits poor HER reaction kinetics. However, when one S atom was removed from the Co atom, i.e. the S–Co coordination number is reduced, the hydrogen binding free energy (ΔGH) on nearly every S atom can be reduced to 0.03 eV, which is comparable to that of the state-of-the-art Pt106 (ΔGH = −0.03 eV) and MoS2 (ref. 63) (ΔGH = 0.08 eV) catalyst. Our calculations explain the experimentally-observed HER activity when the number of coordinated S-atoms around Co atom is reduced in an amorphous CoSx compound.
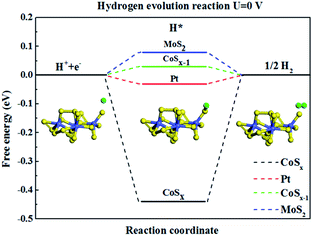 | ||
| Fig. 7 The calculated free-energy diagram of HER under standard conditions for CoSx cluster catalysts, and the referenced Pt and MoS2. | ||
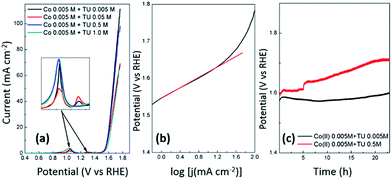
The ability of an electrocatalyst to be functional for both the HER and the OER is highly advantageous and therefore we also tested our material for the OER under alkaline conditions. Fig. 8a shows the OER at each sample produced by cyclic voltammetry at pH 5.6 using different TU concentrations. It illustrates that the samples are quite comparable in the potential (1.60 V) that is required to generate a current density of 10 mA cm−2. For the sample prepared with 0.5 M TU that was active for HER in alkaline solution (Fig. 5d) a Tafel slope of 67 mV dec−1 was determined (Fig. 8b). This is consistent with previous work on oxygen containing CoSx nanocubes which gave the same Tafel slope in 1.0 M KOH and achieved the same current density at 1.52 V. The enhanced activity for the OER was predicted by DFT calculations to be due to the presence of oxygen and dangling Co–S bonds.76 The main advantage with the approach undertaken here compared to this previous study is that the synthesis can be done rapidly and in one step under ambient conditions where good adherence to the underlying support is achieved. In addition electrochemical deposition lends itself to scalability and the ability to be deposited with good adherence on large high surface area electrodes suitable for commercial electrolysis applications. These results also demonstrate that the samples containing higher sulfur content (using 0.5 M TU) perform equally well to the samples with little sulfur content (0.005 M TU) which are essentially cobalt oxide/hydroxide materials which have been documented previously as being active for the OER.107–112 Prior to the OER several redox peaks can be seen which are attributed to the oxidation of cobalt into +3 and +4 oxidation states where the latter has been postulated to be the active oxidation state of Co for the OER.108 The stability of these catalysts containing low and high S contents was then tested over a 24 h period where it can be seen that the sample with a higher sulfur content resulted in a very gradual loss in performance for 18 h after which it stabilised. This is contrary to the sample with a lower sulfur content which maintained good stability over 24 h.
SEM analysis of the sample prepared with 0.5 M TU after the OER is shown in Fig. S7† which shows two distinct regions which are different to the original starting material (Fig. 4c2). The flake like deposits have been replaced with more nodule like material as well as patches of interconnected plate like materials which are highly indicative of Co3O4.113 This is supported by XPS analysis (Fig. S8†) which shows the emergence of a peak at 529 eV for the O 1s core level spectrum and suppression of the shake up satellite peak at 788 eV in the S 2p spectrum. The presence of sulfur is still evident, however the intensity of the signal is lower indicating the loss of sulfur from the sample and conversion into a material dominated by surface oxygen as evidenced by the XPS data.
Due to these changes the sample was also investigated after the HER and XPS analysis of the sample after the reaction in alkaline solution shows that the composition of the material is unchanged which is also reflected in the SEM images (Fig. S9†) that indicate no change in the morphology. This is significantly different to the OER under oxidative conditions where there is conversion of the CoSx material into an oxide material such as Co3O4 during the course of the reaction which is also an effective catalyst for this reaction. This phenomenon has been highlighted recently by Jin114 who described that metal chalcogenides, nitrides and phosphides may in fact only be precursors to the active material that participates in the OER. Once these materials are oxidised they are converted into the respective metal oxides/hydroxide which is also evident in this study. Indeed, recent work has utilised metal chalcogenides/phosphides as a scaffold to produce oxide/hydroxide OER active catalysts on the surface of the original materials which have demonstrated good OER performance.115–117 Therefore it is important for studies on metal sulphides that the catalyst is characterised post reaction to see if the composition and morphology of the catalyst is maintained rather than changed into a different form that is also active for the reaction of interest.
Conclusions
The electrodeposition of amorphous CoSx electrocatalysts containing oxygen could be readily achieved by using a repetitive potential cycling method to ensure high sulfur contents once an appropriate pH of 5–6 was utilised. The optimum Co![[thin space (1/6-em)]](https://www.rsc.org/images/entities/char_2009.gif) :
:![[thin space (1/6-em)]](https://www.rsc.org/images/entities/char_2009.gif) S ratio found for electrocatalytic activity was 1.56
S ratio found for electrocatalytic activity was 1.56![[thin space (1/6-em)]](https://www.rsc.org/images/entities/char_2009.gif) :
:![[thin space (1/6-em)]](https://www.rsc.org/images/entities/char_2009.gif) 1. This material showed a dual functionality and was active for the HER in acidic, neutral and alkaline media as well as the OER under alkaline conditions once oxidised prior to the reaction which is the key component to ensure good OER performance. DFT calculations confirmed that an amorphous material is appropriate for good HER activity as a reduced S–Co coordination number was found to be better for the optimal adsorption of H. The ease of preparation and activity of this material for both the HER and OER under alkaline conditions is promising for overall electrochemical water splitting.
1. This material showed a dual functionality and was active for the HER in acidic, neutral and alkaline media as well as the OER under alkaline conditions once oxidised prior to the reaction which is the key component to ensure good OER performance. DFT calculations confirmed that an amorphous material is appropriate for good HER activity as a reduced S–Co coordination number was found to be better for the optimal adsorption of H. The ease of preparation and activity of this material for both the HER and OER under alkaline conditions is promising for overall electrochemical water splitting.
Conflicts of interest
There are no conflicts to declare.Acknowledgements
The XPS and helium ion microscope data reported in this paper were obtained at the Central Analytical Research Facility operated by the Institute for Future Environments (QUT). Access to CARF is supported by generous funding from the Science and Engineering Faculty (QUT).Notes and references
- J. O. M. Bockris, Science, 1972, 176, 1323 CAS.
- H. Vrubel and X. Hu, ACS Catal., 2013, 3, 2002–2011 CrossRef CAS.
- P. C. Vesborg, B. Seger and I. Chorkendorff, J. Phys. Chem. Lett., 2015, 6, 951–957 CrossRef CAS PubMed.
- B. J. Fisher and R. Eisenberg, J. Am. Chem. Soc., 1980, 102, 7361–7363 CrossRef CAS.
- V. Houlding, T. Geiger, U. Kölle and M. Grätzel, Chem. Commun., 1982, 681–683 RSC.
- U. Koelle and S. Paul, Inorg. Chem., 1986, 25, 2689–2694 CrossRef CAS.
- J. P. Collin, A. Jouaiti and J. P. Sauvage, Inorg. Chem., 1988, 27, 1986–1990 CrossRef CAS.
- P. V. Bernhardt and L. A. Jones, Inorg. Chem., 1999, 38, 5086–5090 CrossRef CAS PubMed.
- R. Mejia-Rodriguez, D. Chong, J. H. Reibenspies, M. P. Soriaga and M. Y. Darensbourg, J. Am. Chem. Soc., 2004, 126, 12004–12014 CrossRef CAS PubMed.
- A. Begum, G. Moula and S. Sarkar, Chem.–Eur. J., 2010, 16, 12324–12327 CrossRef CAS PubMed.
- Y. Z. Voloshin, A. V. Dolganov, O. A. Varzatskii and Y. N. Bubnov, Chem. Commun., 2011, 47, 7737–7739 RSC.
- W. M. Singh, T. Baine, S. Kudo, S. Tian, X. A. N. Ma, H. Zhou, N. J. DeYonker, T. C. Pham, J. C. Bollinger and D. L. Baker, Angew. Chem., Int. Ed., 2012, 51, 5941–5944 CrossRef CAS PubMed.
- F. Quentel, G. Passard and F. Gloaguen, Energy Environ. Sci., 2012, 5, 7757–7761 CAS.
- D. J. Evans and C. J. Pickett, Chem. Soc. Rev., 2003, 32, 268–275 RSC.
- J. W. Tye, M. B. Hall and M. Y. Darensbourg, Proc. Natl. Acad. Sci. U. S. A., 2005, 102, 16911–16912 CrossRef CAS PubMed.
- B. E. Barton, M. T. Olsen and T. B. Rauchfuss, Curr. Opin. Biotechnol., 2010, 21, 292–297 CrossRef CAS PubMed.
- J. L. Dempsey, B. S. Brunschwig, J. R. Winkler and H. B. Gray, Acc. Chem. Res., 2009, 42, 1995–2004 CrossRef CAS PubMed.
- M. Rakowski Dubois and D. L. Dubois, Acc. Chem. Res., 2009, 42, 1974–1982 CrossRef CAS PubMed.
- F. Gloaguen and T. B. Rauchfuss, Chem. Soc. Rev., 2009, 38, 100–108 RSC.
- V. Artero, M. Chavarot-Kerlidou and M. Fontecave, Angew. Chem., Int. Ed., 2011, 50, 7238–7266 CrossRef CAS PubMed.
- M. Wang, L. Chen and L. Sun, Energy Environ. Sci., 2012, 5, 6763–6778 CAS.
- J. L. Inglis, B. J. MacLean, M. T. Pryce and J. G. Vos, Coord. Chem. Rev., 2012, 256, 2571–2600 CrossRef CAS.
- P. Du and R. Eisenberg, Energy Environ. Sci., 2012, 5, 6012–6021 CAS.
- A. Le Goff, V. Artero, B. Jousselme, P. D. Tran, N. Guillet, R. Métayé, A. Fihri, S. Palacin and M. Fontecave, Science, 2009, 326, 1384–1387 CrossRef CAS PubMed.
- M. L. Helm, M. P. Stewart, R. M. Bullock, M. R. DuBois and D. L. DuBois, Science, 2011, 333, 863–866 CrossRef CAS PubMed.
- F. Wang, W. G. Wang, X. J. Wang, H. Y. Wang, C. H. Tung and L. Z. Wu, Angew. Chem., Int. Ed., 2011, 50, 3193–3197 CrossRef CAS PubMed.
- Z. Han, F. Qiu, R. Eisenberg, P. L. Holland and T. D. Krauss, Science, 2012, 338, 1321–1324 CrossRef CAS PubMed.
- C. C. McCrory, C. Uyeda and J. C. Peters, J. Am. Chem. Soc., 2012, 134, 3164–3170 CrossRef CAS PubMed.
- E. Anxolabéhère-Mallart, C. Costentin, M. Fournier, S. Nowak, M. Robert and J.-M. Savéant, J. Am. Chem. Soc., 2012, 134, 6104–6107 CrossRef PubMed.
- S. C. Marinescu, J. R. Winkler and H. B. Gray, Proc. Natl. Acad. Sci. U. S. A., 2012, 109, 15127–15131 CrossRef CAS PubMed.
- E. S. Andreiadis, P.-A. Jacques, P. D. Tran, A. Leyris, M. Chavarot-Kerlidou, B. Jousselme, M. Matheron, J. Pécaut, S. Palacin and M. Fontecave, Nat. Chem., 2013, 5, 48–53 CrossRef CAS PubMed.
- Q. Lu, G. S. Hutchings, W. Yu, Y. Zhou, R. V. Forest, R. Tao, J. Rosen, B. T. Yonemoto, Z. Cao and H. Zheng, Nat. Commun., 2015, 6, 6567 CrossRef CAS PubMed.
- X. Wang, R. Su, H. Aslan, J. Kibsgaard, S. Wendt, L. Meng, M. Dong, Y. Huang and F. Besenbacher, Nano Energy, 2015, 12, 9–18 CrossRef CAS.
- J. R. McKone, B. F. Sadtler, C. A. Werlang, N. S. Lewis and H. B. Gray, ACS Catal., 2013, 3, 166–169 CrossRef CAS.
- J. Luo, J.-H. Im, M. T. Mayer, M. Schreier, M. K. Nazeeruddin, N.-G. Park, S. D. Tilley, H. J. Fan and M. Grätzel, Science, 2014, 345, 1593–1596 CrossRef CAS PubMed.
- M. Gong, W. Zhou, M.-C. Tsai, J. Zhou, M. Guan, M.-C. Lin, B. Zhang, Y. Hu, D.-Y. Wang and J. Yang, Nat. Commun., 2014, 5, 4695 CrossRef CAS PubMed.
- S. Peng, L. Li, X. Han, W. Sun, M. Srinivasan, S. G. Mhaisalkar, F. Cheng, Q. Yan, J. Chen and S. Ramakrishna, Angew. Chem., 2014, 126, 12802–12807 CrossRef.
- R. Wu, J. Zhang, Y. Shi, D. Liu and B. Zhang, J. Am. Chem. Soc., 2015, 137, 6983–6986 CrossRef CAS PubMed.
- H. Wang, H.-W. Lee, Y. Deng, Z. Lu, P.-C. Hsu, Y. Liu, D. Lin and Y. Cui, Nat. Commun., 2015, 6, 7261 CrossRef CAS PubMed.
- M.-R. Gao, Y.-F. Xu, J. Jiang and S.-H. Yu, Chem. Soc. Rev., 2013, 42, 2986–3017 RSC.
- Y. Shi, H. Li and L.-J. Li, Chem. Soc. Rev., 2015, 44, 2744–2756 RSC.
- H. B. Wu, B. Y. Xia, L. Yu, X.-Y. Yu and X. W. D. Lou, Nat. Commun., 2015, 6, 6512 CrossRef CAS PubMed.
- R. Michalsky, Y.-J. Zhang and A. A. Peterson, ACS Catal., 2014, 4, 1274–1278 CrossRef CAS.
- Y. Zhao, K. Kamiya, K. Hashimoto and S. Nakanishi, J. Am. Chem. Soc., 2014, 137, 110–113 CrossRef PubMed.
- W. Cui, N. Cheng, Q. Liu, C. Ge, A. M. Asiri and X. Sun, ACS Catal., 2014, 4, 2658–2661 CrossRef CAS.
- J. Zhu, K. Sakaushi, G. Clavel, M. Shalom, M. Antonietti and T.-P. Fellinger, J. Am. Chem. Soc., 2015, 137, 5480–5485 CrossRef CAS PubMed.
- X. Fan, H. Zhou and X. Guo, ACS Nano, 2015, 9, 5125–5134 CrossRef CAS PubMed.
- W.-F. Chen, C.-H. Wang, K. Sasaki, N. Marinkovic, W. Xu, J. Muckerman, Y. Zhu and R. Adzic, Energy Environ. Sci., 2013, 6, 943–951 CAS.
- E. J. Popczun, C. G. Read, C. W. Roske, N. S. Lewis and R. E. Schaak, Angew. Chem., 2014, 126, 5531–5534 CrossRef.
- S. Carenco, D. Portehault, C. Boissiere, N. Mezailles and C. Sanchez, Chem. Rev., 2013, 113, 7981–8065 CrossRef CAS PubMed.
- C. G. Morales-Guio, L.-A. Stern and X. Hu, Chem. Soc. Rev., 2014, 43, 6555–6569 RSC.
- Y. Jiao, Y. Zheng, M. Jaroniec and S. Z. Qiao, Chem. Soc. Rev., 2015, 44, 2060–2086 RSC.
- J. Duan, S. Chen, M. Jaroniec and S. Z. Qiao, ACS Nano, 2015, 9, 931–940 CrossRef CAS PubMed.
- Y. Zheng, Y. Jiao, Y. Zhu, L. H. Li, Y. Han, Y. Chen, A. Du, M. Jaroniec and S. Z. Qiao, Nat. Commun., 2014, 5, 3783 Search PubMed.
- C.-Y. Lin, D. Mersch, D. A. Jefferson and E. Reisner, Chem. Sci., 2014, 5, 4906–4913 RSC.
- Y. Sun, C. Liu, D. C. Grauer, J. Yano, J. R. Long, P. Yang and C. J. Chang, J. Am. Chem. Soc., 2013, 135, 17699–17702 CrossRef CAS PubMed.
- N. Kornienko, J. Resasco, N. Becknell, C.-M. Jiang, Y.-S. Liu, K. Nie, X. Sun, J. Guo, S. R. Leone and P. Yang, J. Am. Chem. Soc., 2015, 137, 7448–7455 CrossRef CAS PubMed.
- P. Liu and J. A. Rodriguez, J. Am. Chem. Soc., 2005, 127, 14871–14878 CrossRef CAS PubMed.
- J. Li, X. Zhou, Z. Xia, Z. Zhang, J. Li, Y. Ma and Y. Qu, J. Mater. Chem. A, 2015, 3, 13066–13071 CAS.
- Y. Pan, Y. Lin, Y. Chen, Y. Liu and C. Liu, J. Mater. Chem. A, 2016, 4, 4745–4754 CAS.
- M. Cabán-Acevedo, M. L. Stone, J. Schmidt, J. G. Thomas, Q. Ding, H.-C. Chang, M.-L. Tsai, J.-H. He and S. Jin, Nat. Mater., 2015, 14, 1245–1251 CrossRef PubMed.
- K. Liu, F. Wang, K. Xu, T. A. Shifa, Z. Cheng, X. Zhan and J. He, Nanoscale, 2016, 8, 4699–4704 RSC.
- B. Hinnemann, P. G. Moses, J. Bonde, K. P. Jørgensen, J. H. Nielsen, S. Horch, I. Chorkendorff and J. K. Nørskov, J. Am. Chem. Soc., 2005, 127, 5308–5309 CrossRef CAS PubMed.
- P. Liu, J. Zhu, J. Zhang, P. Xi, K. Tao, D. Gao and D. Xue, ACS Energy Lett., 2017, 2, 745–752 CrossRef CAS.
- D. Wang, X. Zhang, D. Zhang, Y. Shen and Z. Wu, Appl. Catal., A, 2016, 511, 11–15 CrossRef CAS.
- T. Liu, Y. Liang, Q. Liu, X. Sun, Y. He and A. M. Asiri, Electrochem. Commun., 2015, 60, 92–96 CrossRef CAS.
- S. Patra, C. Andriamiadamanana, M. Tulodziecki, C. Davoisne, P.-L. Taberna and F. Sauvage, Sci. Rep., 2016, 6, 21588 CrossRef CAS PubMed.
- P. Montoya, T. Marín, A. Echavarría and J. Calderón, Int. J. Electrochem. Sci., 2013, 8, 12566–12579 CAS.
- A. P. O'Mullane, Nanoscale, 2014, 6, 4012–4026 RSC.
- B. J. Plowman, A. P. O'Mullane and S. K. Bhargava, Faraday Discuss., 2011, 152, 43–62 RSC.
- B. J. Plowman, S. K. Bhargava and A. P. O'Mullane, Analyst, 2011, 136, 5107–5119 RSC.
- I.-W. Sun and J.-K. Chang, in Springer Handbook of Electrochemical Energy, ed. C. Breitkopf and K. Swider-Lyons, Springer Berlin Heidelberg, Berlin, Heidelberg, 2017, DOI:10.1007/978-3-662-46657-5_26, pp. 835–895.
- T. M. Braun and D. T. Schwartz, Electrochem. Soc. Interface, 2016, 25, 69–73 CrossRef.
- P. Ganesan, A. Sivanantham and S. Shanmugam, J. Mater. Chem. A, 2016, 4, 16394–16402 CAS.
- A. Sivanantham, P. Ganesan and S. Shanmugam, Adv. Funct. Mater., 2016, 26, 4661–4672 CrossRef CAS.
- P. Cai, J. Huang, J. Chen and Z. Wen, Angew. Chem., Int. Ed., 2017, 56, 4858–4861 CrossRef CAS PubMed.
- G. Kresse and J. Furthmüller, Comput. Mater. Sci., 1996, 6, 15–50 CrossRef CAS.
- P. Vogt, P. De Padova, C. Quaresima, J. Avila, E. Frantzeskakis, M. C. Asensio, A. Resta, B. Ealet and G. Le Lay, Phys. Rev. Lett., 2012, 108, 155501 CrossRef PubMed.
- J. P. Perdew, K. Burke and M. Ernzerhof, Phys. Rev. Lett., 1996, 77, 3865 CrossRef CAS PubMed.
- J. P. Perdew, M. Ernzerhof and K. Burke, J. Chem. Phys., 1996, 105, 9982–9985 CrossRef CAS.
- P. E. Blöchl, Phys. Rev. B, 1994, 50, 17953 CrossRef.
- S. Grimme, J. Comput. Chem., 2006, 27, 1787–1799 CrossRef CAS PubMed.
- C. Tsai, F. Abild-Pedersen and J. K. Nørskov, Nano Lett., 2014, 14, 1381–1387 CrossRef CAS PubMed.
- A. A. Smirnova, Zool. Zh., 2011, 90, 803–810 Search PubMed.
- A. R. Harris, A. K. Neufeld, A. P. O'Mullane, A. M. Bond and R. J. S. Morrison, J. Electrochem. Soc., 2005, 152, C577 CrossRef CAS.
- J. Santos, R. Matos, F. Trivinho-Strixino and E. Pereira, Electrochim. Acta, 2007, 53, 644–649 CrossRef CAS.
- S. Jiang, Y. Chen, J. You, T. Chen and A. Tseung, J. Electrochem. Soc., 1990, 137, 3374–3380 CrossRef CAS.
- A. Irshad and N. Munichandraiah, ACS Appl. Mater. Interfaces, 2017, 9, 19746–19755 CAS.
- J. A. García-Valenzuela, Comments Inorg. Chem., 2017, 37, 99–115 CrossRef.
- M. Nicol and V. Tjandrawan, Hydrometallurgy, 2014, 150, 34–40 CrossRef CAS.
- J. Shi, X. Li, G. He, L. Zhang and M. Li, J. Mater. Chem. A, 2015, 3, 20619–20626 CAS.
- C. K. Ranaweera, Z. Wang, E. Alqurashi, P. K. Kahol, P. R. Dvornic, B. K. Gupta, K. Ramasamy, A. D. Mohite, G. Gupta and R. K. Gupta, J. Mater. Chem. A, 2016, 4, 9014–9018 CAS.
- X. Zou and Y. Zhang, Chem. Soc. Rev., 2015, 44, 5148–5180 RSC.
- H. Zhang, Y. Li, G. Zhang, P. Wan, T. Xu, X. Wu and X. Sun, Electrochim. Acta, 2014, 148, 170–174 CrossRef CAS.
- J. Chastain, R. C. King and J. Moulder, Handbook of X-ray photoelectron spectroscopy: a reference book of standard spectra for identification and interpretation of XPS data, Physical Electronics, Eden Prairie, MN, 1995 Search PubMed.
- N. McIntyre and M. Cook, Anal. Chem., 1975, 47, 2208–2213 CrossRef CAS.
- T. Jit, K. Beng, J. Kenneth and P. Sherwood, J. Am. Chem. Soc., 1991, 113, 855 CrossRef.
- M. Wang, A. M. Anghel, B. Marsan, N.-L. Cevey Ha, N. Pootrakulchote, S. M. Zakeeruddin and M. Grätzel, J. Am. Chem. Soc., 2009, 131, 15976–15977 CrossRef CAS PubMed.
- J.-Y. Lin, J.-H. Liao and S.-W. Chou, Electrochim. Acta, 2011, 56, 8818–8826 CrossRef CAS.
- B. J. Tan, K. J. Klabunde and P. M. Sherwood, J. Am. Chem. Soc., 1991, 113, 855–861 CrossRef CAS.
- A. M. de Jong, V. De Beer, J. R. van Veen and J. Niemantsverdriet, J. Phys. Chem., 1996, 100, 17722–17724 CrossRef CAS.
- K. Kim, Phys. Rev. B, 1975, 11, 2177 CrossRef CAS.
- H. Li, Y. Gao, Y. Shao, Y. Su and X. Wang, Nano Lett., 2015, 15, 6689–6695 CrossRef CAS PubMed.
- J. Yang, H. Liu, W. N. Martens and R. L. Frost, J. Phys. Chem. C, 2009, 114, 111–119 Search PubMed.
- J. K. Nørskov, T. Bligaard, J. Rossmeisl and C. H. Christensen, Nat. Chem., 2009, 1, 37–46 CrossRef PubMed.
- J. K. Nørskov, T. Bligaard, A. Logadottir, J. Kitchin, J. G. Chen, S. Pandelov and U. Stimming, J. Electrochem. Soc., 2005, 152, J23–J26 CrossRef.
- B. H. R. Suryanto, X. Lu, H. M. Chan and C. Zhao, RSC Adv., 2013, 3, 20936–20942 RSC.
- B. S. Yeo and A. T. Bell, J. Am. Chem. Soc., 2011, 133, 5587–5593 CrossRef CAS PubMed.
- M. E. G. Lyons and M. P. Brandon, J. Electroanal. Chem., 2010, 641, 119–130 CrossRef CAS.
- M. A. Sayeed, T. Herd and A. P. O'Mullane, J. Mater. Chem. A, 2016, 4, 991–999 CAS.
- X. Zhou, Z. Xia, Z. Tian, Y. Ma and Y. Qu, J. Mater. Chem. A, 2015, 3, 8107–8114 CAS.
- Y. Zhao, S. Chen, B. Sun, D. Su, X. Huang, H. Liu, Y. Yan, K. Sun and G. Wang, Sci. Rep., 2015, 5, 7629 CrossRef CAS PubMed.
- N. Zhang, Y. Fan, H. Fan, H. Shao, J. Wang, J. Zhang and C. Cao, ECS Electrochem. Lett., 2012, 1, H8–H10 CrossRef CAS.
- S. Jin, ACS Energy Lett., 2017, 2, 1937–1938 CrossRef.
- X. Xu, F. Song and X. Hu, Nat. Commun., 2016, 7, 12324 CrossRef CAS PubMed.
- W. Chen, H. Wang, Y. Li, Y. Liu, J. Sun, S. Lee, J.-S. Lee and Y. Cui, ACS Cent. Sci., 2015, 1, 244–251 CrossRef CAS PubMed.
- H. Liang, A. N. Gandi, C. Xia, M. N. Hedhili, D. H. Anjum, U. Schwingenschlögl and H. N. Alshareef, ACS Energy Lett., 2017, 2, 1035–1042 CrossRef.
Footnote |
| † Electronic supplementary information (ESI) available. See DOI: 10.1039/c7ra10394h |
| This journal is © The Royal Society of Chemistry 2017 |

