 Open Access Article
Creative Commons Attribution 3.0 Unported Licence
Synthesis and characterisation of SrY2−xCexO4 as environmentally friendly reddish-brown pigments
Ryohei Oka,
Yusuke Shobu,
Fumiya Aoyama,
Takashi Tsukimori and
Toshiyuki Masui *
*
Department of Chemistry and Biotechnology, Graduate School of Engineering, Tottori University, 4-101, Koyama-cho Minami, Tottori 680-8552, Japan. E-mail: masui@chem.tottori-u.ac.jp; Fax: +81-857-31-5264; Tel: +81-857-31-5264
First published on 4th December 2017
Abstract
Reddish-brown SrY2−xCexO4 (0 ≤ x ≤ 1.2) solid solutions were synthesized by a citrate sol–gel method as novel environmentally friendly inorganic pigments. The powders obtained were characterized by X-ray powder diffraction (XRD), UV-vis diffuse reflectance spectra and CIE L*a*b*Ch° chromatic coordinate measurements. All SrY2−xCexO4 (0 ≤ x ≤ 1.2) samples were obtained in a single-phase form and the lattice volume increased on increasing the Ce3+ concentration. The reddish-brown pigments exhibited optical absorption due to the 4f–5d allowed transition of Ce3+. The absorption bands observed in the wavelength region of 400 and 550 nm were due to the Ce3+ ions in the ideal octahedral Y3+ site and those in the longer wavelength region above 600 nm were attributed to the transition of Ce3+ in the distorted octahedral Y3+ site. The samples gradually became reddish on increasing the Ce3+ content. The most reddish colour was obtained in SrYCeO4 (a* = +21.8).
Introduction
Inorganic pigments are typically applied to ceramic tiles, inks and paints, due to their high hiding power, weather resistance and thermal stability. However, the use of the conventional pigments containing toxic elements, such as Cd, Pb, Hg, Cr, Co, and Sb, has been forbidden or restricted, because they have adverse effects on the human body and the environment. Therefore, a number of non-toxic inorganic pigments have been reported by several researchers in order to replace the toxic pigments with the environmentally-friendly or less-toxic ones.1–17 In particular, development of novel red pigments has been required and several studies have been reported.18–27 Among them, it has been reported that Ca1−xLaxTaO2−xN1+x and Ce2S3 showed bright red colour.18,19 But, unfortunately, harmful NOx and SOx are generated when these nitride and sulphide pigments are incinerated. Therefore, oxides are desirable as materials for environmentally friendly pigments.Because of this situation, we focused on a trivalent cerium (Ce3+) ion as a red colouring source. As an example of a popular Ce3+-containing material, Ce3+-doped yttrium aluminium garnet, (Y, Ce)3Al5O12 (YAG:Ce3+), has been well known as a yellow-emitting phosphor widely used in white light emitting diodes. YAG:Ce3+ absorbs the visible lights in the wavelength region of 410 to 500 nm,28–30 which is attributed to the 4f–5d allowed transition. The absorption wavelength due to the Ce3+ ions depends on the host crystal structure, because the energy level of the 5d orbital of Ce3+ is strongly affected by the crystal field strength around the Ce3+ ions. In the case of a phosphor, the amount of Ce3+ is about 1 mol% to prevent concentration quenching, but it is considered that colouring of the sample can be seen by further increasing the Ce3+ concentration. Furthermore, it is expected that strong reddish colour will be obtained if Ce3+ is doped at a high concentration in the Y3+ site in the lattice with a stronger crystal field.
In this study, we selected SrY2O4 as a host material, because this compound is composed of non-toxic elements. SrY2O4 belongs to the CaFe2O4-related structure, and it crystallizes into an orthogonal structure with space group Pnma. Four formula units for a total of 28 atoms are contained in the SrY2O4 structure. All of the constituent atoms occupy 4c sites according to the Wyckoff notation.31 The Sr2+ and Y3+ ions are coordinated by eight and six O2− ions, respectively. Y3+ occupies two non-equivalent sites Cs symmetry, where one Y(1) site is nearly a regular octahedron but the other Y(2) one is much distorted.32 Since it has been reported that high calcination temperature is necessary for the synthesis of SrY2O4 by a solid-state reaction,33,34 SrY2−xCexO4 (0 ≤ x ≤ 1.2) pigments were synthesized using a citrate sol–gel method. The optical and colour properties of the samples were evaluated as novel environmentally friendly inorganic reddish-brown pigments.
Experimental
Materials and methods
The SrY2−xCexO4 (0 ≤ x ≤ 1.2) pigments were synthesized using a citrate sol–gel method. Sr(NO3)2 (Wako Pure Chemical Industries Ltd., 99.9%), Y(NO3)3·6H2O (Kishida Chemical Co. Ltd., 99.9%) and Ce(NO3)3·6H2O (Kishida Chemical Co. Ltd., 98.0%) were weighed so as to obtain the objective compositions and dissolved in deionized water to adjust the Sr and (Y + Ce) concentrations to 0.3 and 0.6 mol L−1, respectively. After the solution was stirred homogeneously, citric acid was added as a chelating agent to complex the cations into the solution in the mole ratio 2![[thin space (1/6-em)]](https://www.rsc.org/images/entities/char_2009.gif) :
:![[thin space (1/6-em)]](https://www.rsc.org/images/entities/char_2009.gif) 1 with respect to the total cations (Sr, Y and Ce). The mixed solution was stirred at 80 °C until a gel was obtained, and then, the gel was dried at 120 °C for 24 h in an oven. The dried gel was calcined in an aluminium silicate (mullite) crucible at 500 °C for 6 h in air. After the calcination, the sample was heated again at 1300 °C for 6 h in a flow of 5% H2–95% N2 gas. Before characterisation, the sample was ground in an agate mortar.
1 with respect to the total cations (Sr, Y and Ce). The mixed solution was stirred at 80 °C until a gel was obtained, and then, the gel was dried at 120 °C for 24 h in an oven. The dried gel was calcined in an aluminium silicate (mullite) crucible at 500 °C for 6 h in air. After the calcination, the sample was heated again at 1300 °C for 6 h in a flow of 5% H2–95% N2 gas. Before characterisation, the sample was ground in an agate mortar.
Characterisation
The samples synthesized were characterised by X-ray powder diffraction (XRD; Rigaku, Ultima IV) with Cu-Kα radiation, operated with voltage and current settings of 40 kV and 40 mA, respectively. The sampling width and the scan speed were 0.02° and 6° min−1. The lattice parameters and volumes were calculated from the XRD peak angles, which were refined using α-Al2O3 as a standard and using the CellCalc Ver. 2.20 software. Rietveld refinement of the obtained XRD patterns was performed using the RIETAN-FP software package to determine the precise crystal structure and the occupancy of the Y(1) and the Y(2) sites for the SrY2−xCeO4 (x = 0, 0.2, 1.0) samples.35 From the Rietveld refinement, the following final R-factors were obtained: Rwp (R-weighted pattern), Rp (R-pattern), Re (R-expected), S (goodness-of-fit indicator), and RF (R-structure factor).The morphology of the SrYCeO4 particles was investigated by using field-emission-type scanning electron microscopy (FE-SEM; JEOL, JSM-6701F). The optical reflectance spectra were measured with a UV-vis spectrometer (Shimadzu, UV-2550 with an integrating sphere attachment) with barium sulphate as a reference. The colour properties of the samples were evaluated in terms of the CIE L*a*b*Ch° system using a chromometer (Konika-Minolta, CR-300). The L* parameter indicates the brightness or darkness of a colour relative to a neutral grey scale, and the a* (the red-green axis) and b* (the yellow-blue axis) parameters express the colour qualitatively. Chroma parameter (C) represents the colour saturation of the pigments and is calculated according to the following formula: C = [(a*)2 + (b*)2]1/2. The parameter h° ranges from 0 to 360°, and is calculated with the formula, h° = tan−1(b*/a*). X-ray photoelectron spectra measurements (XPS; ULVAC-PHI, PHI5000 VersaProbe II) using Mg-Kα radiation were carried out to investigate the oxidation state of the cerium ion on the surface of the as-synthesized and the calcined SrYCeO4 samples.
Results and discussion
X-ray powder diffraction and SEM image
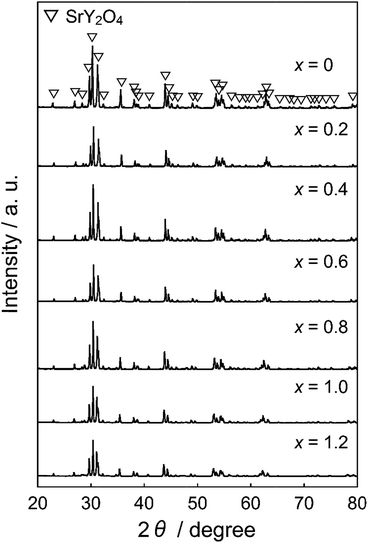
Fig. 1 shows the XRD patterns of the synthesized SrY2−xCexO4 (0 ≤ x ≤ 1.2) pigments. All SrY2−xCexO4 (0 ≤ x ≤ 1.2) samples were obtained in a single-phase form, and no diffraction peaks of impurities or other phases were observed in the patterns. The XRD peaks shifted to lower angle direction with increasing the Ce3+. The lattice volumes of all samples were calculated from the XRD peak angles, and the results are summarized in Table 1. The cell volume increased with increasing the Ce3+ concentration. These results indicate that Y3+ (ionic radius: 0.104 nm)36 ions in the host lattice were partially substituted by larger Ce3+ (0.115 nm)36 ions to form solid solutions.| x | Lattice volume/nm3 |
|---|---|
| 0 | 0.410 |
| 0.2 | 0.411 |
| 0.4 | 0.413 |
| 0.6 | 0.414 |
| 0.8 | 0.418 |
| 1.0 | 0.420 |
| 1.2 | 0.422 |
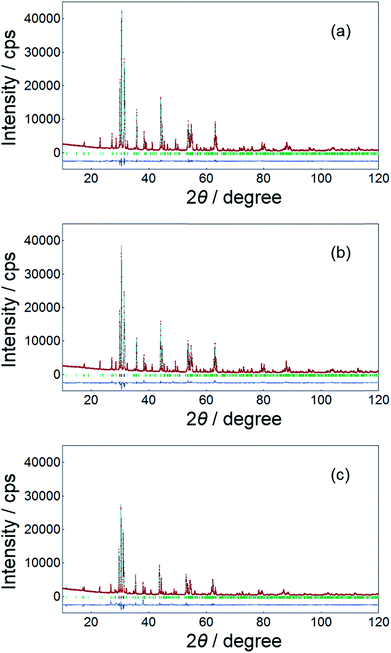
The Rietveld analysis of the XRD data of the SrY2−xCeO4 (x = 0, 0.2, and 1.0) samples was carried out to determine the site occupancy of the Y(1) and the Y(2) sites. The Rietveld refinement profiles of the samples are shown in Fig. 2, and the detailed crystallographic data and structure refinement parameters are summarized in Tables 2 and 3, respectively. Fig. 3 shows the crystal structure of SrY2O4 illustrated using the VESTA program based on the crystallographic data from the Rietveld refinement.37 As seen in Table 2, the low R-factors were obtained for all the SrY2−xCexO4 (x = 0, 0.2, and 1.0) samples. The Rietveld refinements revealed that the Ce3+ concentrations at the Y(1) site gradually increased from 16 to 64 mol%, while that in the Y(2) site increased from 4 to 36 mol% as x increased from 0.2 to 1, as seen in Table 3. Therefore, in the SrY2−xCexO4 structure, Ce3+ ions occupied both Y(1) and Y(2) sites. Although each Y site is coordinated by six oxide anions, one Y(1) site is located in the ideal octahedral coordination environment and the other Y(2) site is significantly distorted, as shown in Fig. 3. This difference of structural distortion of two non-equivalent Y sites affects the Ce3+ occupancy. In fact, the occupancy ratio, Ce2/Ce1, was 0.25 for SrY1.8Ce0.2O4 (x = 0.2), while it was 0.56 for SrYCeO4 (x = 1). These results indicate that the Ce3+ ions were preferentially located in the energetically favoured ideal octahedral Y(1) site when the Ce3+ concentration was low, and suggest that the distorted Y(2) site were also begun to be occupied when the Ce3+ concentration was increased and the solubility in the Y(1) sites were saturated.
| x = 0 | x = 0.2 | x = 1 | |
|---|---|---|---|
| a Crystal symmetry: orthorhombic, space group: Pnma, number of formula units per unit cell: Z = 4. | |||
| Cell data | |||
| a (nm) | 1.007815(7) | 1.008700(5) | 1.01202(1) |
| b (nm) | 0.340805(2) | 0.341514(2) | 0.345788(4) |
| c (nm) | 1.191426(8) | 1.193350(7) | 1.20445(1) |
| V (nm3) | 0.409217(5) | 0.411091(4) | 0.421491(8) |
![[thin space (1/6-em)]](https://www.rsc.org/images/entities/char_2009.gif) |
|||
| R factor | |||
| Rwp | 3.398 | 4.785 | 6.478 |
| Rp | 2.536 | 3.474 | 4.370 |
| Re | 2.662 | 2.716 | 3.119 |
| S | 1.277 | 1.761 | 2.163 |
| RF | 1.456 | 3.781 | 3.701 |
| SrY2O4 (x = 0)b | |||||
|---|---|---|---|---|---|
| Atom | Occupancy | x | y | z | Uiso (nm2) |
| a All atoms are placed at general 4c positions.b At refinement of SrY2O4, isotropic atomic displacement parameters (Uiso) of four oxygen atoms were constrained to be equal.c Because of the disordering of Y and Ce atoms, the fractional coordinate and Uiso were constraint to the same values, respectively. In order to refine the occupation ratio of Ce atoms, Uiso parameters of Sr, Y and O atoms were fixed to the respective values of each atoms at non-doped SrY2O4. | |||||
| Sr | 1 | 0.24722(9) | 1/4 | 0.64940(9) | 0.000087(2) |
| Y1 | 1 | 0.0775(1) | 1/4 | 0.38967(7) | 0.000067(3) |
| Y2 | 1 | 0.5762(1) | 1/4 | 0.61230(7) | 0.000086(3) |
| O1 | 1 | 0.2861(5) | 1/4 | 0.3235(4) | 0.0001303 |
| O2 | 1 | 0.3729(5) | 1/4 | 0.0193(5) | 0.0001303 |
| O3 | 1 | 0.4852(5) | 1/4 | 0.7820(4) | 0.0001303 |
| O4 | 1 | 0.07423(6) | 1/4 | 0.0767(4) | 0.0001303 |
| SrY1.8Ce0.2O4 (x = 0.2)c | ||||
|---|---|---|---|---|
| Atom | Occupancy | x | y | z |
| Sr | 1 | 0.2483(1) | 1/4 | 0.64917(1) |
| Y1 | 0.84(1) | 0.0772(1) | 1/4 | 0.3891(1) |
| Y2 | 0.96 | 0.5780(2) | 1/4 | 0.6125(1) |
| Ce1 | 0.16 | 0.0772 | 1/4 | 0.3891 |
| Ce2 | 0.04 | 0.5780 | 1/4 | 0.6125 |
| O1 | 1 | 0.2871(8) | 1/4 | 0.3236(7) |
| O2 | 1 | 0.3742(7) | 1/4 | 0.0188(7) |
| O3 | 1 | 0.4822(8) | 1/4 | 0.7832(6) |
| O4 | 1 | 0.078(1) | 1/4 | 0.0770(6) |
| SrYCeO4 (x = 1)c | ||||
|---|---|---|---|---|
| Atom | Occupancy | x | y | z |
| Sr | 1 | 0.2509(3) | 1/4 | 0.6482(2) |
| Y1 | 0.36(1) | 0.0746(2) | 1/4 | 0.3880(2) |
| Y2 | 0.64 | 0.5844(3) | 1/4 | 0.6118(2) |
| Ce1 | 0.64 | 0.0746 | 1/4 | 0.0746 |
| Ce2 | 0.36 | 0.5844 | 1/4 | 0.5844 |
| O1 | 1 | 0.278(2) | 1/4 | 0.319(1) |
| O2 | 1 | 0.374(1) | 1/4 | 0.012(2) |
| O3 | 1 | 0.487(1) | 1/4 | 0.787(1) |
| O4 | 1 | 0.086(2) | 1/4 | 0.079(1) |
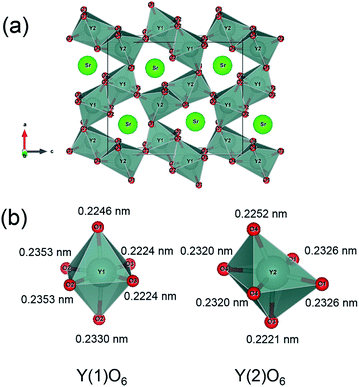 | ||
| Fig. 3 Crystal structure obtained by the Rietveld analysis for SrY2O4 (a), and the octahedral coordination environment of Y(1)O6 and Y(2)O6 in SrY2O4 (b). | ||
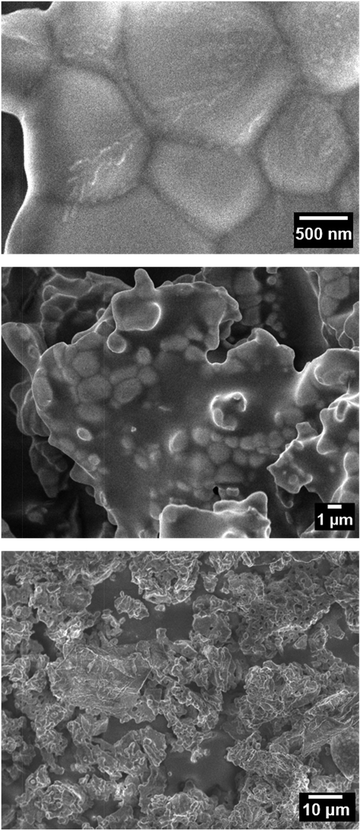
Fig. 4 shows the FE-SEM images of the SrYCeO4 (x = 1) sample at different magnifications. Since it was synthesized at a high temperature of 1300 °C, the primary particles melted to form large secondary particles.
Reflectance spectra
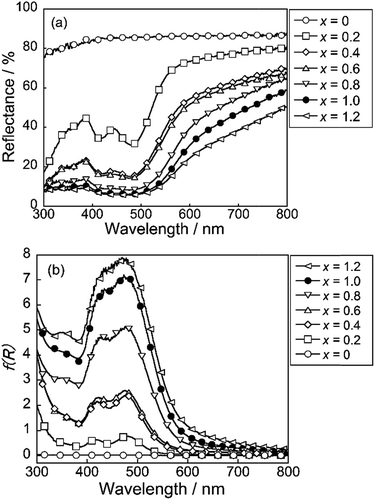
The UV-vis reflectance and absorption spectra of SrY2−xCexO4 (0 ≤ x ≤ 1.2) are depicted in Fig. 5. The absorbance spectra were represented by the Kubelka–Munk function, f(R) = (1 − R)2/2R, where R is reflectance.38 The non-doped SrY2O4 sample showed high reflectance in the visible light region of 400 to 750 nm. In the case of the Ce3+-doped SrY2−xCexO4 (0.2 ≤ x ≤ 1.2) samples, on the other hand, optical absorption were observed due to the O2p–Ce4f charge transfer transition at a wavelength of 380 nm or shorter as well as the 4f–5d allowed transition of Ce3+ in the wavelength range from violet to green (400–550 nm).28–30,39 As the concentration of Ce3+ increased, the absorption due to the 4f–5d transition appeared more intensely. In addition, the reflectance at 600 nm and longer wavelengths also decreased when the Ce3+ concentration became high.These results are considered to be due to the existence of two non-equivalent octahedral Y sites of different coordination environments in the crystal structure of SrY2O4. As mentioned above, Y(1) site is located in the ideal octahedral coordination environment and the other Y(2) site is significantly distorted,31 as illustrated in Fig. 3. The band structure models of the ideal Y(1) and the distorted Y(2) sites in the SrY2−xCexO4 (0 ≤ x ≤ 1.2) samples are illustrated schematically in Fig. 6. The valence band (VB) and the conduction band (CB) consist of O2p and Y3d orbitals, respectively. When the Ce3+ ions are doped into the SrY2O4 lattice, the 4f and 5d energy levels of Ce3+ are introduced between VB (O2p orbital) and CB (Y3d orbital). Since the crystal field energy around the Ce3+ ions in the distorted Y(2) site is stronger than that in the ideal Y(1) site, the 5d orbital energy splitting of Ce3+ in the Y(2) site is also larger than that in the Y(1) site. As already discussed, the Ce3+ preferentially occupies the ideal Y(1) in the low Ce3+ concentration sample, and the Y(2) occupancy was increased with increasing the Ce3+ concentration.
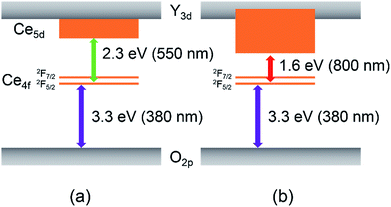 | ||
| Fig. 6 Band structure models of the ideal octahedral Y(1) site (a) and the distorted Y(2) site (b) in the SrY2−xCexO4 (0 ≤ x ≤ 1.2) pigments. | ||
Accordingly, the optical absorption at 600 nm and longer wavelengths was observed in the samples with high Ce3+ concentration.
Chromatic properties
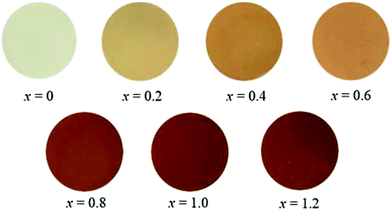
The chromatic parameters of the synthesized SrY2−xCexO4 (0 ≤ x ≤ 1.2) pigments are summarized in Table 4. The photographs of these pigments are also displayed in Fig. 7. The L* values increased as the amount of Ce3+ decreased. The a* and b* values increased in a positive direction. As already discussed above regarding the results in Fig. 3, these relationships can be attributed to the difference of coordination environment around the Ce3+ ions. When the Ce3+ concentration is relatively low, the Ce3+ ions are preferentially located in the ideal octahedral Y(1) site. Since the crystal field of Ce3+ in the Y(1) site is relative small, the 4f–5d allowed transition of Ce3+ in this site is observed at the wavelengths in the region of violet to blue green (400–550 nm). As a result, the samples are yellow, which is complementary colour of blue. On the other hand, the samples containing Ce3+ at high concentrations additionally absorbed light at wavelengths of 600 nm and above, corresponding to the 4f–5d allowed transition of Ce3+ in the distorted octahedral Y(2) site. Accordingly, the samples gradually became reddish with increasing the Ce3+ content. Among the SrY2−xCexO4 samples synthesized in this study, SrYCeO4 is the most reddish (a* = +21.8).| x | L* | a* | b* | C | h° |
|---|---|---|---|---|---|
| 0 | 98.2 | −0.24 | +1.69 | 1.71 | 98.1 |
| 0.2 | 83.3 | +1.78 | +36.3 | 36.3 | 87.2 |
| 0.4 | 68.6 | +10.2 | +45.3 | 46.4 | 77.3 |
| 0.6 | 68.4 | +10.5 | +43.3 | 44.6 | 76.4 |
| 0.8 | 57.3 | +20.4 | +44.1 | 48.6 | 65.2 |
| 1.0 | 49.1 | +21.8 | +42.2 | 47.5 | 62.7 |
| 1.2 | 42.8 | +19.7 | +36.5 | 41.5 | 61.6 |
Thermal and chemical stability tests
The thermal and chemical stabilities of the SrYCeO4 pigment were evaluated using the powder sample. To evaluate the thermal stability, this sample was heated in a mullite crucible at 300 °C and 500 °C for 3 h under an air atmosphere and cooled to room temperature. The acid/base resistance of the SrYCeO4 pigment was tested in 4% acetic acid and 4% ammonium bicarbonate solutions, and the pigment was dispersed into the acid/base solutions. After leaving them at room temperature for 1 h, the sample was washed with deionized water and ethanol, and then dried at room temperature.The colour of the samples after the thermal and chemical stability tests were evaluated using the colorimeter. The colour coordinate data are summarized in Table 5. Unfortunately, the heat resistance of this sample was low, and the colour degradation was observed after heating the present SrYCeO4 pigment at 300 °C and above in air. On the other hand, the SrYCeO4 pigment has chemical stability. The colour was almost unchanged after the leaching test in the acetic acid and ammonium bicarbonate solutions.
| Pigment | L* | a* | b* | C | h° |
|---|---|---|---|---|---|
| As synthesized | 49.1 | +21.8 | +42.2 | 47.5 | 62.7 |
| 300 °C in air | 94.5 | −0.33 | +3.12 | 3.14 | 96.0 |
| 500 °C in air | 95.4 | −0.94 | +3.41 | 3.54 | 105 |
| 4% CH3COOH | 49.3 | +17.5 | +41.1 | 44.7 | 66.9 |
| 4% NH4HCO3 | 46.7 | +18.7 | +40.6 | 44.7 | 65.3 |
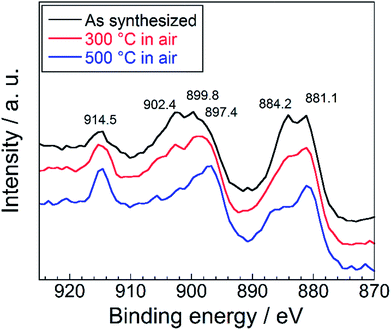
In order to investigate the reason for the color degradation after the heating in air, oxidation state of the cerium ions of the SrYCeO4 samples was identified by the XPS measurement before and after the heat resistance tests. The Ce (3d3/2) and Ce (3d5/2) XPS obtained from the SrYCeO4 sample before and after the heat resistance tests are shown in Fig. 8. In addition to the binding energy peaks for Ce3+ at 884.2 (V′) and 902.4 (U′) eV, four peaks corresponding to Ce4+ species on the surface of the non-treatment sample were observed at 881.1 (V), 897.4 (V′′′), 899.8 (U) and 914.5 (U′′′) eV.40,41 The labels U and V refer to the Ce (3d3/2) and Ce (3d5/2) spin–orbit components. The intensities of two peaks assigned to Ce3+ decreased with increasing the calcination temperature, in comparison with those of the as-synthesized sample. Therefore, the colour degradation will be caused by the oxidation of Ce3+ to Ce4+.
Conclusions
SrY2−xCexO4 (0 ≤ x ≤ 1.2) were synthesized using a citrate sol–gel method as environmentally friendly inorganic reddish-brown pigments. The samples exhibited optical absorption due to the 4f–5d allowed transition of Ce3+ at wavelengths from 410 to 500 nm and at 600 nm and longer. The former is attributed to the 4f–5d transition of Ce3+ in the ideal octahedral Y(1) site, and the latter is due to that in the distorted octahedral Y(2) site. Since the Ce3+ ions were preferentially dissolved into the energetically favoured Y(1) site, the colour of the samples gradually changed from yellow to reddish brown with increasing the Ce3+ concentration. The most reddish colour was observed for SrYCeO4 (a* = +21.8). Since this compound is consisted with non-toxic elements, it is expected to be an environmentally friendly inorganic reddish-brown pigment.Conflicts of interest
There are no conflicts to declare.Acknowledgements
This work was partially supported by JSPS KAKENHI Grant Number 15K05643. The authors thank Dr Hirokazu Izumi (Hyogo Prefectural Institute of Technology) for his assistance with X-ray photoelectron spectroscopy measurements.References
- K. Těšitelová and P. Šulcová, J. Therm. Anal. Calorim., 2016, 125, 1047 CrossRef.
- T. Tsukimori, R. Oka and T. Masui, Dyes Pigm., 2017, 139, 808 CrossRef CAS.
- K. Kusumoto, J. Ceram. Soc. Jpn., 2016, 124, 926 CrossRef CAS.
- T. Masui, T. Honda, Wendusu and N. Imanaka, Dyes Pigm., 2013, 99, 636 CrossRef CAS.
- B. Bae, Wendusu, S. Tamura and N. Imanaka, Ceram. Int., 2016, 42, 15104 CrossRef CAS.
- Wendusu, T. Honda, T. Masui and N. Imanaka, Chem. Lett., 2013, 42, 1562 CrossRef CAS.
- J. Grins and G. Svensson, Mater. Res. Bull., 1994, 29, 801 CrossRef.
- S. Furukawa, T. Masui and N. Imanaka, J. Alloys Compd., 2006, 418, 255 CrossRef CAS.
- S. Furukawa, T. Masui and N. Imanaka, J. Alloys Compd., 2008, 451, 640 CrossRef CAS.
- M. Martos, B. Julián-López, E. Cordoncillo and P. Escribano, J. Am. Ceram. Soc., 2009, 92, 2987 CrossRef CAS.
- S. P. Radhika, K. J. Sreeram and B. U. Nair, ACS Sustainable Chem. Eng., 2014, 2, 1251 CrossRef CAS.
- M. Llusar, E. García, M. T. García, C. Gargori, J. A. Badenes and G. Monrós, Dyes Pigm., 2015, 122, 368 CrossRef CAS.
- G. George, Dyes Pigm., 2015, 122, 81 CrossRef.
- A. K. V. Raj, P. P. Rao, S. Sameera, V. James and S. Divya, Chem. Lett., 2014, 43, 985 CrossRef CAS.
- A. K. V. Raj, P. P. Rao, S. Divya and T. R. Ajuthara, Powder Technol., 2017, 311, 52 CrossRef CAS.
- V. D. Luz, M. Prades, H. Beltrán and E. Cordoncillo, J. Eur. Ceram. Soc., 2013, 33, 3359 CrossRef.
- N. Pailhé, M. Gaudon and A. Demourgues, Mater. Res. Bull., 2009, 44, 1771 CrossRef.
- M. Jansen and H. P. Letschert, Nature, 2000, 404, 27 CrossRef PubMed.
- P. Maestro and D. Huguenin, J. Alloys Compd., 1995, 225, 520 CrossRef CAS.
- Wendusu, A. Shiraishi, N. Takeuchi, T. Masui and N. Imanaka, RSC Adv., 2015, 5, 44886 RSC.
- E. Guenther and M. Jansen, Mater. Res. Bull., 2001, 36, 1399 CrossRef CAS.
- H. Saal, M. Binnewies, M. Schrader, A. Börger, K. Becker, V. A. Tikhomirov and K. Jug, Chem.–Eur. J., 2009, 15, 6408 CrossRef CAS PubMed.
- Wendusu, T. Yoshida, T. Masui and N. Imanaka, J. Adv. Ceram., 2015, 4, 39 CrossRef CAS.
- L. S. Kumari, P. P. Rao, S. Sameera and P. Koshy, Ceram. Int., 2012, 38, 4009 CrossRef CAS.
- S. W. Kim, T. Hasegawa, M. Watanabe, K. Sugimoto, Y. Saito, K. Uematsu, K. Toda and M. Sato, Dyes Pigm., 2017, 136, 219 CrossRef CAS.
- S. Radhika, K. J. Sreeram and B. U. Nair, J. Chem. Sci., 2014, 126, 65 CrossRef CAS.
- M. Jovaní, A. Sanz, H. Beltrán-Mir and E. Cordoncillo, Dyes Pigm., 2016, 133, 33 CrossRef.
- V. Bachmann, C. Ronda and A. Meijerink, Chem. Mater., 2009, 21, 2077 CrossRef CAS.
- P. Schlotter, R. Schmidt and J. Schneider, Appl. Phys. A, 1997, 64, 417 CrossRef CAS.
- Y. Pan, M. Wu and Q. Su, Mater. Sci. Eng., B, 2004, 106, 251 CrossRef.
- V. H. Müller-Buschbaum, Z. Anorg. Allg. Chem., 1968, 358, 138 CrossRef.
- Z. Fu, S. Zhou, Y. Yu and S. Zhang, J. Phys. Chem. B, 2005, 109, 23320 CrossRef CAS PubMed.
- V. Manivannan, H. A. Comanzo, A. A. Setlur, A. M. Srivastava, P. A. Schmidt and U. Happek, J. Lumin., 2003, 102, 635 CrossRef.
- V. Dubey, J. Kaur, R. Tiwari, Y. Parganiha, R. Srivastava and K. V. R. Murthy, International Journal of Luminescence and Applications, 2015, 5, 211 Search PubMed.
- F. Izumi and K. Momma, Solid State Phenom., 2007, 130, 15 CrossRef CAS.
- R. D. Shannon, Acta Crystallogr., Sect. A: Cryst. Phys., Diffr., Theor. Gen. Crystallogr., 1976, 32, 751 CrossRef.
- K. Momma and F. Izumi, J. Appl. Crystallogr., 2011, 44, 1272 CrossRef CAS.
- P. Kubelka and F. Munk, Z. Tech. Phys., 1931, 12, 593 Search PubMed.
- F. Goubin, X. Rocquefelte, M. Whangbo, Y. Montardi, R. Brec and S. Jobic, Chem. Mater., 2004, 16, 662 CrossRef CAS.
- D. R. Mullius, S. H. Overbury and D. R. Huntley, Surf. Sci., 1998, 409, 307 CrossRef.
- J. P. Holgado, G. Muneura, J. P. Espinos and A. R. González-Elipe, Appl. Surf. Sci., 2000, 158, 164 CrossRef CAS.
| This journal is © The Royal Society of Chemistry 2017 |

