DOI:
10.1039/C7RA10160K
(Paper)
RSC Adv., 2017,
7, 56365-56374
Improvement in the hydrogen storage performance of the as-milled Sm–Mg alloys using MoS2 nano-particle catalysts
Received
12th September 2017
, Accepted 22nd November 2017
First published on 19th December 2017
Abstract
The effects of the addition of MoS2 catalyst on the microstructure and hydrogen storage behavior of the as-milled Sm5Mg41 alloys were investigated in this study. The Sm5Mg41 + x wt% MoS2 (x = 0, 5, and 10) alloys were prepared by milling MoS2 powders (particle size ≤ 40 nm) and the mechanically ground as-cast Sm5Mg41 alloy powders (particle size ≤ 75 μm) in an argon atmosphere for 5 h. The results demonstrate that the as-milled alloys are composed of Sm5Mg41 and SmMg3 phases and milling refines the crystal grains. The MgH2 and Sm3H7 phases appear after hydrogenation, while the Mg and Sm3H7 phases are formed after dehydrogenation. MoS2 nano-particles are embedded in the alloy surface, which is nanostructured with some crystal defects, such as dislocations, grain boundaries, and twins. These microstructures are advantageous in reducing the total potential barrier that the hydrogen absorption or desorption reaction must overcome, thus improving the hydrogen storage kinetics of the alloys. The dehydriding activation energies of the alloys are 122.28, 68.25, and 59.91 kJ mol−1 H2 for x = 0, 5, and 10, respectively. The catalyzed alloys begin to release hydrogen at ∼241.9 °C, which is 26.4 °C lower than the temperature required for non-catalyzed alloys. The hydrogenation enthalpies of the alloys are −81.72, −78.31, and −78.18 kJ mol−1 H2 for x = 0, 5, and 10, respectively. Therefore, the addition of a MoS2 catalyst significantly improves the hydrogen storage kinetics of Mg-based alloys.
Introduction
Hydrogen has extensive applications, including those in aviation, aerospace, metallurgy, and petrochemical industries. It would be successfully applied in commercial vehicles as one of the clean energy resources. The state-of-the-art sustainable H2 production technologies have developed rapidly and H2 fuel has widespread applications.1–9 However, there are some bottlenecks in achieving the practical, efficient, safe, and cheap hydrogen storage systems.
Magnesium-based alloys are one of the most promising hydrogen storage alloys and have been studied extensively because of their high hydrogen storage capacity and low-cost.10,11 However, they face some disadvantages in terms of their high dehydrogenation temperatures, slow dehydrogenation kinetics, and high reactivity with air and oxygen.12,13 The key focus of the current research on such materials is on lowering their dehydrogenation temperature, improving their dehydrogenation kinetics, and prolonging their life cycle. Alloying, nanocrystallization, and catalyst addition are some of the helpful methods for obtaining the low-cost hydrogen storage materials with favorable thermodynamics and kinetics.14,15
Most of the current studies on the magnesium-based alloys for hydrogen storage focus on two main mechanisms for the dehydrogenation of MgH2. The first mechanism is a “nucleation and growth” model of Mg in bulky particles.16 Mg nucleates inside MgH2 (including a spot of residual Mg) and grows with the diffusion of the H atoms. H2 is synthesized when the H atoms diffuse to the surface of MgH2, which indicates the end of the decomposition of MgH2. The second model follows a “shrinking core” mechanism,17 in which Mg nucleates initially on the surfaces of the MgH2 nano-particles and then grows into the core of the material. Based on the diffusion of the H atoms through the newly formed Mg layer and the formation of the H2 molecules, the decomposition of MgH2 is accomplished. In both models, the diffusion rate of the H atoms is the controlling parameter. The diffusion rate of the H atoms in Mg (4 × 10⁻¹³) is almost three orders of magnitude higher than that in MgH2 (1.5 × 10⁻¹⁶).18,19 Thus, microstructure nanocrystallization is an effective tool to enhance the kinetics of dehydrogenation. Au et al.20 fabricated MgH2 nano-particles using carbon aerogels of large surface areas with pore sizes of 6–20 nm and demonstrated hydrogen release at 140 °C. This temperature is much lower than that of other Mg-based hydrogen storage alloys. Moreover, this hydrogen storage material reached 80% of the maximum absorption capacity in just 15 min at 300 °C.
Using catalysts/additives to destabilize hydrides of high hydrogen storage density, e.g., MgH2 with 7.6 wt% H and a desorption temperature as high as 300–400 °C, is one of the most important strategies to improve the thermodynamics and kinetics of the hydrogen storage materials.21–23 Cui et al.24 pointed out that the Ti-based multivalent catalysts can improve the kinetics of the hydrogen storage materials. During the hydrogenation process, a diatomic Ti ion donates an electron to the hydrogen atom on the Mg surface and converts it into a hydrogen ion, while converting itself into a trivalent Ti ion. The hydrogen ion unites with a Mg atom and forms a weak Mg–H bond, resulting in a reduction in the energy barrier for hydrogenation and dehydrogenation. Lin et al.25 reported a symbiotic CeH2.73/CeO2 catalyst to enhance the hydrogen storage capacity of MgH2 and demonstrated that a spontaneous hydrogen release effect in the interface region of the symbiotic CeO2/CeH2.73 nano-particle played a role as an efficient “hydrogen pump”. Shahi et al.26 milled an intermetallic hydride, ZrFe2Hx, with MgH2 to synthesize the MgH2–ZrFe2Hx nanocomposites and found that ZrFe2Hx led to a decrease in the dehydrogenation temperature from 410 °C to 290 °C. Furthermore, it significantly improved the hydrogenation kinetics, as observed by the lowered activation energy of ∼61 kJ mol−1 H2. El-Eskandarany et al.27 used the reactive ball milling (RBM) method to prepare MgH2/5Ni/5Nb2O5 nanocomposite powders, which exhibited an excellent hydriding/dehydriding performance, as evidenced by the short time required to absorb (41 s) and desorb (121 s) 5 wt% H2 at 250 °C. Although numerous new achievements have been reported, further efforts are urgently necessary to enhance the hydrogen storage performance of the Mg-based alloys.
To design a hydrogen storage material with the fast kinetics and a low desorption temperature, the investigations on the effects of the addition of Mo-containing catalysts to MgH2 have been initiated.28,29 It has also been reported that the catalysis of the S ions can improve the hydrogen storage kinetics of MgH2.29 In our previous study, we showed that an activated Sm–Mg alloy,30,31 containing rare earth (RE) hydride nano-particles and high-density boundaries, can act as a potential Mg-based hydride. The hydrogen storage kinetics of the alloy can be enhanced because the nano-particles exert a catalytic action and the high-density boundaries can provide a number of channels for hydrogen diffusion. Therefore, the effects of adding MoS2 nano-particle catalysts32–35 on the microstructure and gaseous hydrogen storage behavior of the as-cast Sm5Mg41 alloys are studied in the current investigation.
Experimental
The as-cast Sm5Mg41 alloys composed of the major phase Sm5Mg41 (93.367 wt%) and the secondary phase SmMg3 (6.633 wt%) were manufactured according to the procedure reported in our previous work.30 The MoS2-catalyzed Sm5Mg41 alloys were prepared by milling MoS2 nano-particles (particle size ≤ 40 nm, Beijing Dk nano S&T Ltd.) along with the mechanically ground as-cast alloy powders (particle size ≤ 75 μm) at weight fractions of 0%, 5%, and 10% in an argon atmosphere for 5 h. The weight ratio of the powder mixture to Cr–Ni stainless steel balls was 1![[thin space (1/6-em)]](https://www.rsc.org/images/entities/char_2009.gif) :40 and each tank revolved around its own axis at a constant speed of 350 rpm. In fact, the mass of the precursor was 5.00 g in every tank, but only 4.55 g can be collected as the final product because the material was stuck on the balls and the inner wall of the tank. The elemental compositions of the milled powders were analyzed by inductively coupled plasma atomic emission spectrometry (ICP-AES). The phase compositions and microstructures of the alloys were characterized using an X-ray diffractometer (XRD) and a field emission transmission electron microscope (FETEM, Tecnai G2 F30, operated at 200 kV) equipped with an energy dispersive X-ray spectrometer (EDS) and a selected area electron diffractometer (SAED). The sample (0.5 g) was loaded into a cylindrical reactor for analyzing the pressure–composition isotherms (P–C-I) and the hydrogen absorption/desorption kinetics, which were measured by a PCT Automatic Measuring System (PCT-4SDWIN, Suzuki Shokan Co. Ltd.) in a furnace controlled at an accuracy of ±1 °C. Before measurement, each sample was subjected to five abovementioned hydriding/dehydriding cycles with the hydrogenation reaction occurring at 340 °C and 3 MPa and the dehydrogenation reaction occurring at 340 °C and 1 × 10⁻⁴ MPa. The P–C-I curves were recorded at 320, 340, 360, and 380 °C in a hydrogen pressure range from 0.05 MPa to 3 MPa. The hydrogen absorption analysis was conducted at a pressure of 3 MPa and the temperatures of 270, 300, 360, and 380 °C, while the desorption analysis was conducted at a pressure of 1 × 10⁻⁴ MPa and the temperatures of 300, 320, 340, and 360 °C. The non-isothermal dehydrogenation performance of the alloys was investigated by thermogravimetry (TG, TGA, Q600) at a heating rate of 5 °C min−1 in an argon atmosphere (99.99% purity, 36 mL min−1 flow rate).
:40 and each tank revolved around its own axis at a constant speed of 350 rpm. In fact, the mass of the precursor was 5.00 g in every tank, but only 4.55 g can be collected as the final product because the material was stuck on the balls and the inner wall of the tank. The elemental compositions of the milled powders were analyzed by inductively coupled plasma atomic emission spectrometry (ICP-AES). The phase compositions and microstructures of the alloys were characterized using an X-ray diffractometer (XRD) and a field emission transmission electron microscope (FETEM, Tecnai G2 F30, operated at 200 kV) equipped with an energy dispersive X-ray spectrometer (EDS) and a selected area electron diffractometer (SAED). The sample (0.5 g) was loaded into a cylindrical reactor for analyzing the pressure–composition isotherms (P–C-I) and the hydrogen absorption/desorption kinetics, which were measured by a PCT Automatic Measuring System (PCT-4SDWIN, Suzuki Shokan Co. Ltd.) in a furnace controlled at an accuracy of ±1 °C. Before measurement, each sample was subjected to five abovementioned hydriding/dehydriding cycles with the hydrogenation reaction occurring at 340 °C and 3 MPa and the dehydrogenation reaction occurring at 340 °C and 1 × 10⁻⁴ MPa. The P–C-I curves were recorded at 320, 340, 360, and 380 °C in a hydrogen pressure range from 0.05 MPa to 3 MPa. The hydrogen absorption analysis was conducted at a pressure of 3 MPa and the temperatures of 270, 300, 360, and 380 °C, while the desorption analysis was conducted at a pressure of 1 × 10⁻⁴ MPa and the temperatures of 300, 320, 340, and 360 °C. The non-isothermal dehydrogenation performance of the alloys was investigated by thermogravimetry (TG, TGA, Q600) at a heating rate of 5 °C min−1 in an argon atmosphere (99.99% purity, 36 mL min−1 flow rate).
Results and discussion
Composition, structure, and hydriding/dehydriding mechanism
The actual compositions of the Sm5Mg41 + x wt% MoS2 (x = 0, 5, and 10) alloys were measured by ICP-AES to be Sm5Mg41 + x wt% MoS2 (x = 0, 5, and 10), indicating that there was no contamination by Fe or other impurities; the compositions of the samples are listed in Table 1.
Table 1 The actual compositions of the Sm5Mg41 + x wt% MoS2 (x = 0, 5, 10) alloys measured by ICP
| Sm5Mg41 + x wt% MoS2 |
Sm (wt%) |
Mg (wt%) |
Mo (wt%) |
Fe (wt%) |
| x = 0 |
42.99 ± 0.21 |
57.02 ± 0.29 |
0.00 |
0 |
| x = 5 |
40.84 ± 0.20 |
54.16 ± 0.27 |
3.00 ± 0.02 |
0 |
| x = 10 |
38.69 ± 0.19 |
51.31 ± 0.26 |
5.99 ± 0.03 |
0 |
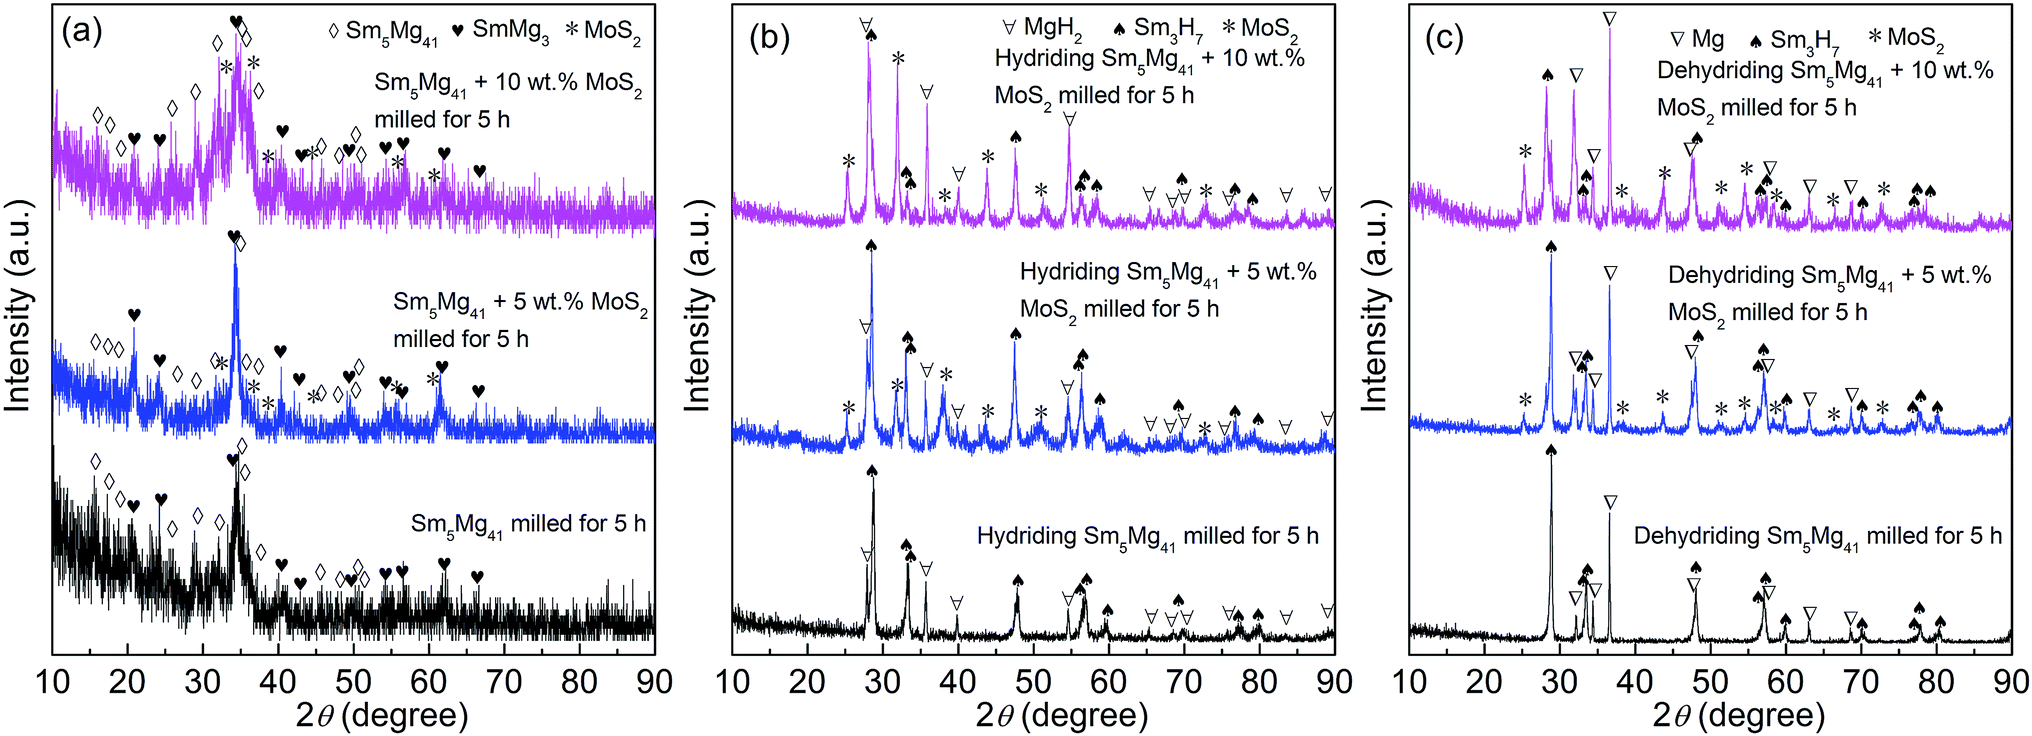
The XRD patterns of the milled Sm5Mg41 + x wt% MoS2 (x = 0, 5, and 10) alloys before and after the hydrogen absorption and desorption are depicted in Fig. 1. ICDD identification of the XRD patterns reveals that the milled alloys contain Sm5Mg41 as the major phase and SmMg3 as the secondary phase before the hydrogen absorption. It is worth noting that milling causes a significant broadening of the diffraction peaks, implying the grain refining by ball milling. Moreover, this broadening phenomenon is reinforced by the addition of a MoS2 catalyst, which always exists in all of the catalyzed alloys due to its higher stability, suggesting that the addition of the MoS2 catalyst facilitates the grain refinement and the production of a nanocrystalline microstructure. It can be observed from Fig. 1(b) that three phases, MoS2, Sm3H7, and MgH2, are present in the hydrogenated catalyzed alloys and there are evident crystallization reactions taking place, as reflected by the sharp peaks. The MoS2, Sm3H7, and Mg phases can be also found in the dehydrogenated catalyzed alloys (see Fig. 1(c)), suggesting the high thermal stabilities for the Sm3H7 hydride and the MoS2 catalyst phases during the hydriding/dehydriding cycle. Based on the XRD results, a hydride formation pathway is suggested: Sm5Mg41 + SmMg3 + H2 → Sm3H7 + MgH2 ↔ Sm3H7 + Mg + H2.
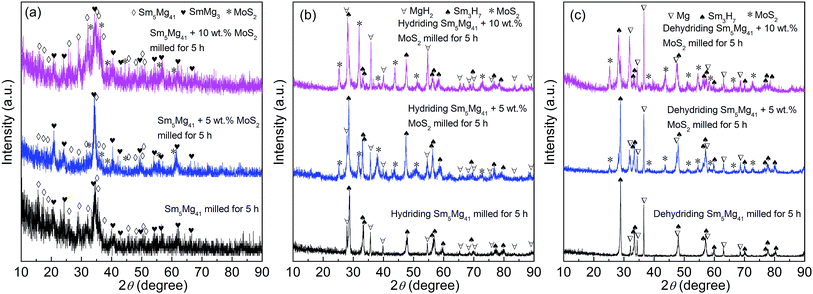 |
| | Fig. 1 XRD patterns of the Sm5Mg41 + x wt% MoS2 (x = 0, 5, and 10) alloys milled for 5 h: (a) before hydriding; (b) after hydriding; (c) after dehydriding. | |
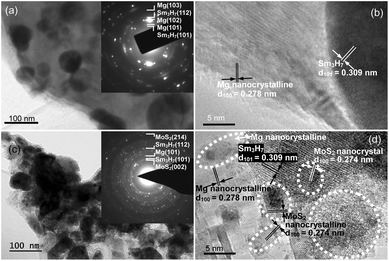
Fig. 2 shows the bright field TEM images, SAED rings, and HRTEM images of the milled (5 h) Sm5Mg41 + x wt% MoS2 (x = 0 and 5) alloys before the hydrogen absorption. Based on the crystallographic electron diffraction calibration results (see the insets in Fig. 2(a) and (c)), it could be confirmed that the alloys contain the SmMg3 and Sm5Mg41 phases with an added MoS2 phase in the catalyzed alloys. These results are consistent with the XRD observations. A focus zone was randomly chosen to determine the microstructure of the alloys as shown in Fig. 2(b) and (d). As observed in the HRTEM images, the internal microstructure of the alloys contains the Sm5Mg41 nanocrystals with a 0.515 nm interplanar spacing in the (002) direction, the SmMg3 nanocrystals with a 0.262 nm interplanar spacing in the (220) direction, and numerous structural defects, including nanocrystallites, lattice dislocations, grain boundaries, and micro-twins. The MoS2 nanocrystals with an interplanar spacing of 0.277 nm in the (200) direction were observed to be embedded in the surfaces of the catalyzed alloys.
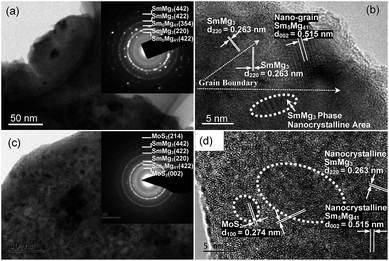 |
| | Fig. 2 SAED and TEM micrographs of the non-catalyzed (a and b) and the 5 wt% MoS2 catalyzed (c and d) Sm5Mg41 alloys before the hydrogen absorption. | |
Fig. 3 and 4 depict the bright field TEM images, SAED rings, and HRTEM images of the fully hydrogenated Sm5Mg41 + x wt% MoS2 (x = 0 and 5) alloys before and after the hydrogen desorption, respectively. The Sm3H7 nano-particles surrounded by a MgH2 matrix-phase can be clearly observed in the hydrogenated alloy. This observation is also supported by the SAED pattern shown in the inset in Fig. 3(a). Moreover, a MoS2 phase is present in the catalyzed alloys (see Fig. 3(c)). A MgH2 polycrystalline phase and some crystal defects such as dislocations, grain boundaries, and twins are clearly observed in the dehydrogenated alloys (see Fig. 3(b) and (d)). It can be seen from Fig. 4(b) and (d) that after dehydrogenation, the Sm3H7 particles exhibit an almost integrated structure with an interplanar spacing of 0.309 nm in the (211) direction, while being surrounded by a Mg phase, in which some crystal defects including lattice dislocations, grain boundaries, and nanocrystals can be clearly observed. Moreover, the MoS2 nanocrystals embedded in the alloy surface can be clearly observed in the catalyzed alloys both before and after the hydrogen desorption.
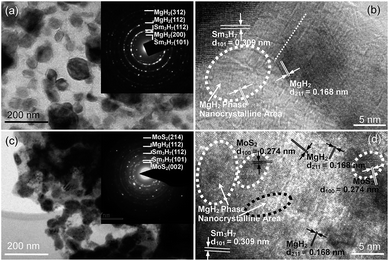 |
| | Fig. 3 SAED and TEM micrographs of the non-catalyzed (a and b) and the 5 wt% MoS2 catalyzed (c and d) Sm5Mg41 alloys after the hydrogen absorption. | |
 |
| | Fig. 4 SAED and TEM micrographs of the non-catalyzed (a and b) and the 5 wt% MoS2 catalyzed (c and d) Sm5Mg41 alloys after the hydrogen desorption. | |
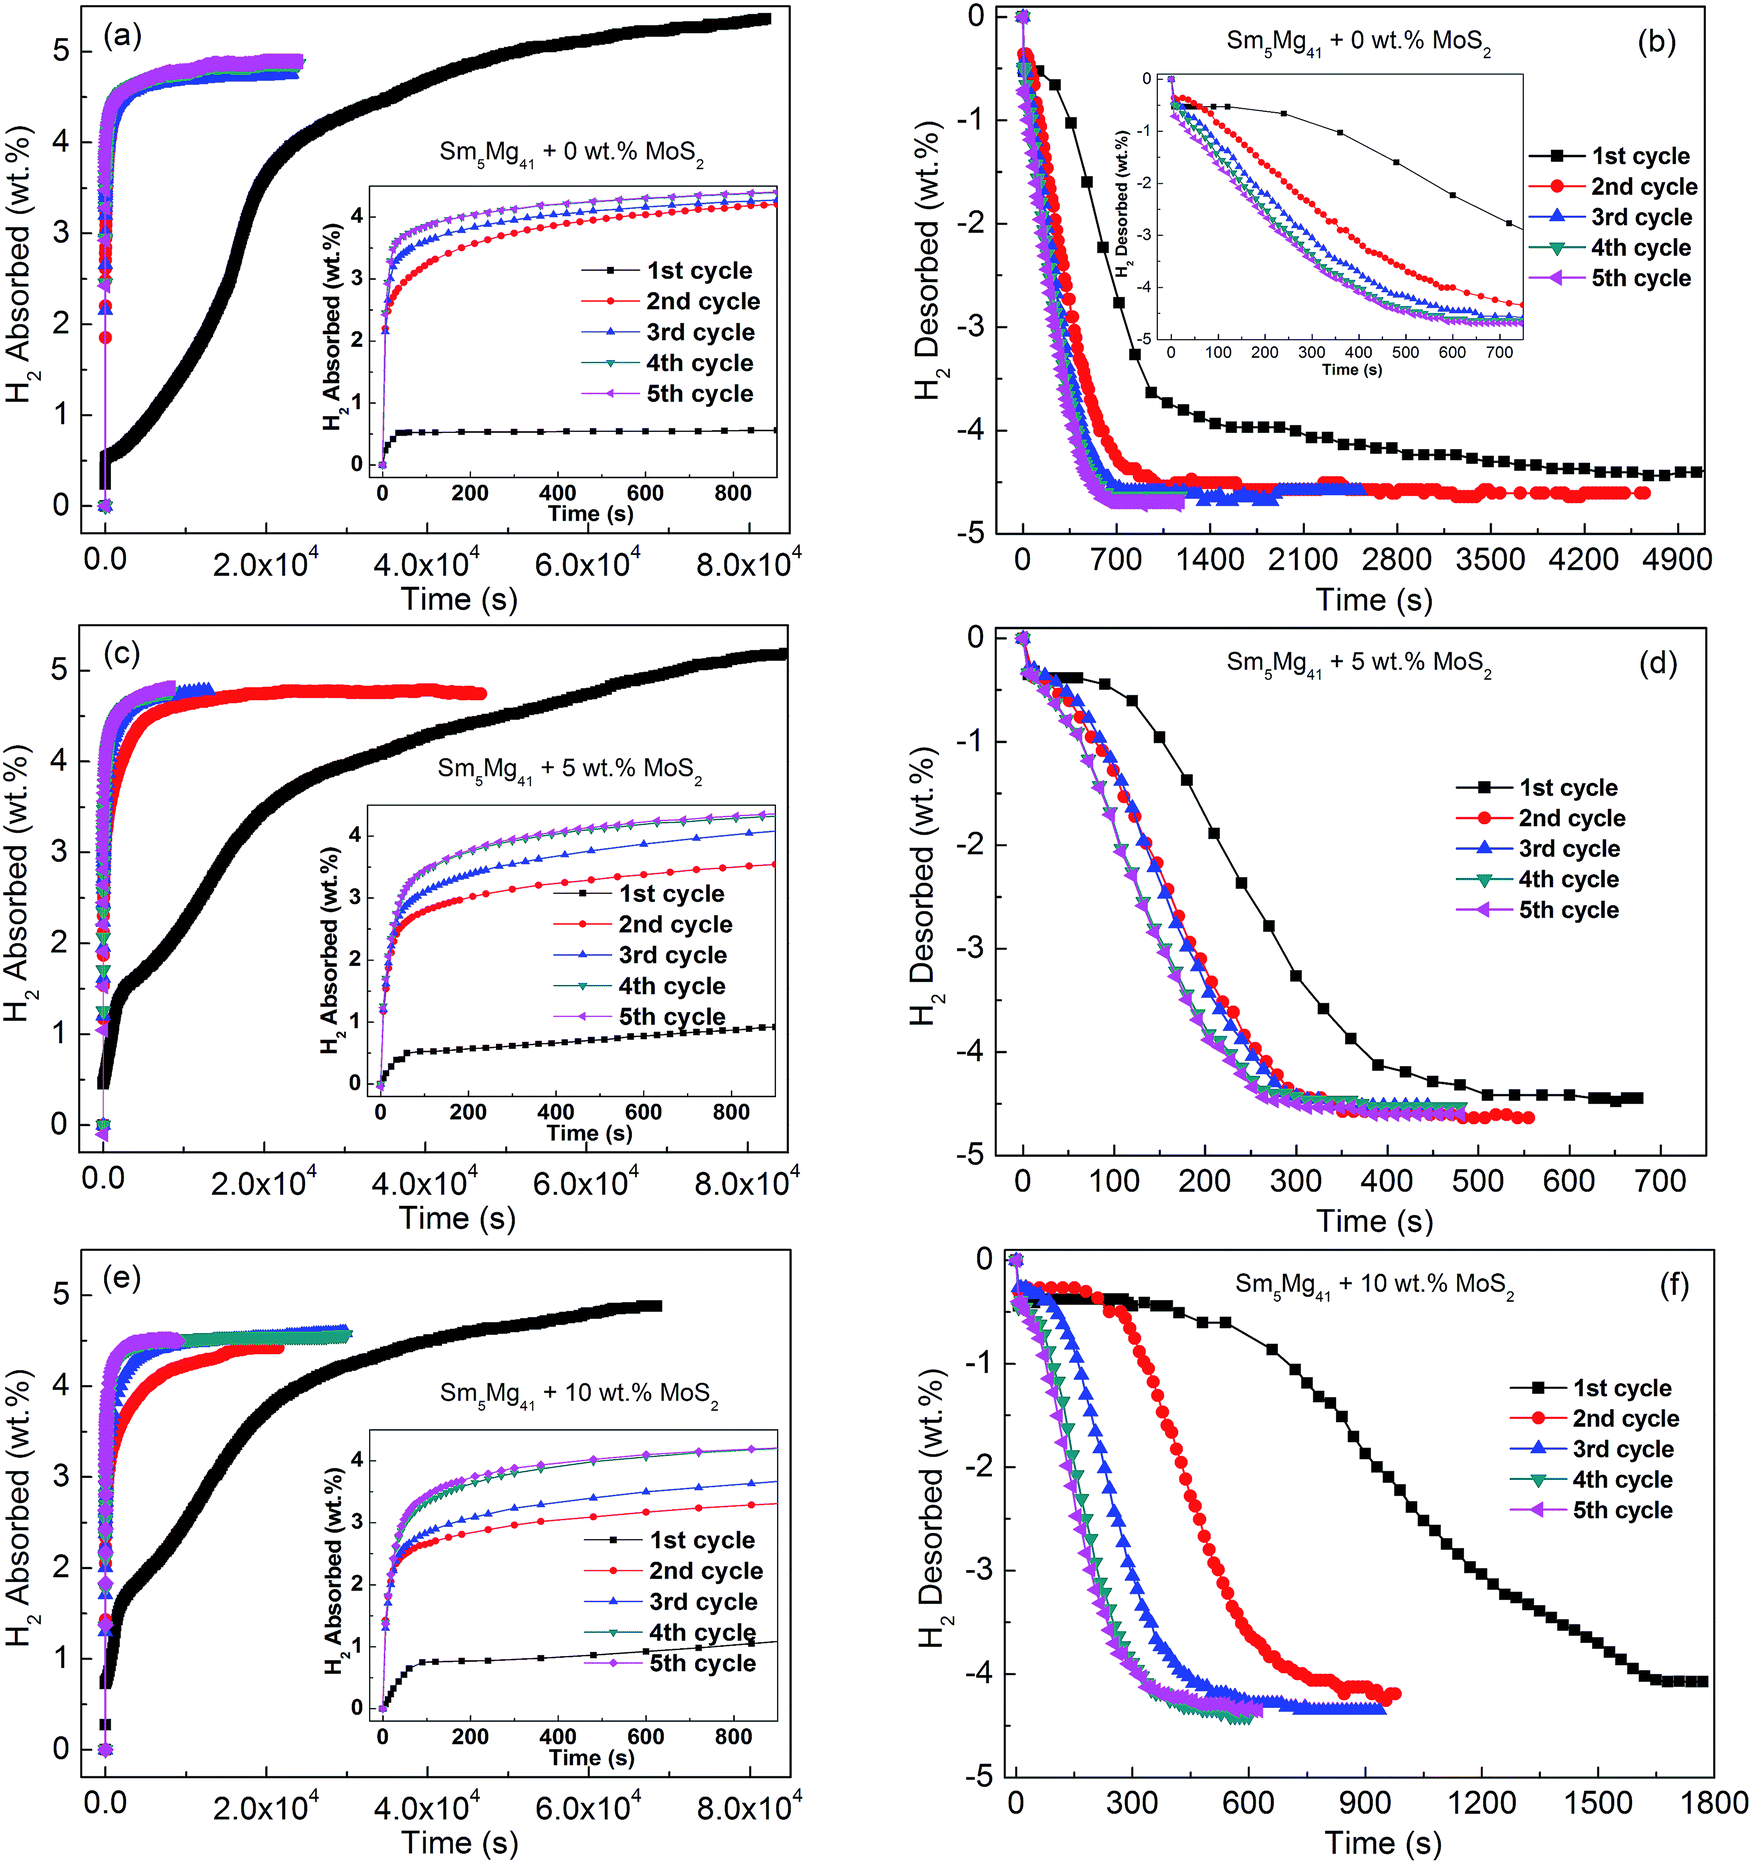
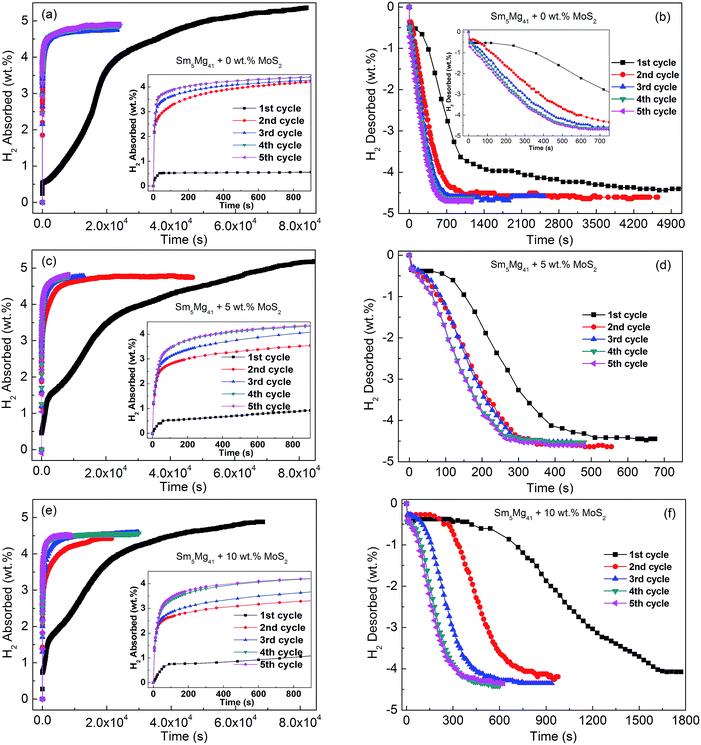
Fig. 5 displays the isothermal hydrogenation and dehydrogenation curves of the Sm5Mg41 + x wt% MoS2 (x = 0, 5, and 10) alloys activated by five hydriding and dehydriding cycles with the hydrogenation reaction occurring at 340 °C and 3 MPa and the dehydrogenation reaction occurring at 340 °C and 1 × 10⁻⁴ MPa. It can be observed that after more than 5 hydriding/dehydriding cycles, the hydrogen absorption/desorption capacities are about 5.01 wt%, 4.81 wt%, and 4.59 wt% for x = 0, 5, and 10, respectively, and the curves remain almost unchanged with a further increase in the number of cycles. Notably, the initial maximum hydrogen capacities are 5.36 wt%, 5.21 wt%, and 4.88 wt% for x = 0, 5, and 10, respectively, which are higher than their reversible hydrogen absorption/desorption capacities, indicating that there exist undecomposed hydrides of Sm3H7 in the Sm5Mg41 + x wt% MoS2 (x = 0, 5, and 10) alloys during the hydrogen absorption/desorption process. Moreover, the shortest initial hydriding time is exhibited by the x = 5 alloy, indicating that the addition of MoS2 markedly improves the initial hydriding progress of the alloy. However, the improvement is hindered when an excess catalyst is added because the surface of the alloy is covered by the catalyst. However, the addition of MoS2 by milling significantly enhances the reversible hydrogen absorption/desorption rate of the alloy after the initial hydriding cycle. Specifically, the time for complete hydrogen desorption of the Sm5Mg41 alloy at 340 °C is reduced from 4900 s to 400 s when MoS2 is added as a catalyst.
 |
| | Fig. 5 The isothermal hydrogen absorption and desorption curves of the Sm5Mg41 + x wt% MoS2 (x = 0, 5, and 10) alloys in the cycle activation with the hydrogenation reaction at 340 °C and 3 MPa and the hydrogenation reaction at 340 °C and 1 × 10⁻⁴ MPa: (a) and (b) x = 0; (c) and (d) x = 5; and (e) and (f) x = 10. | |
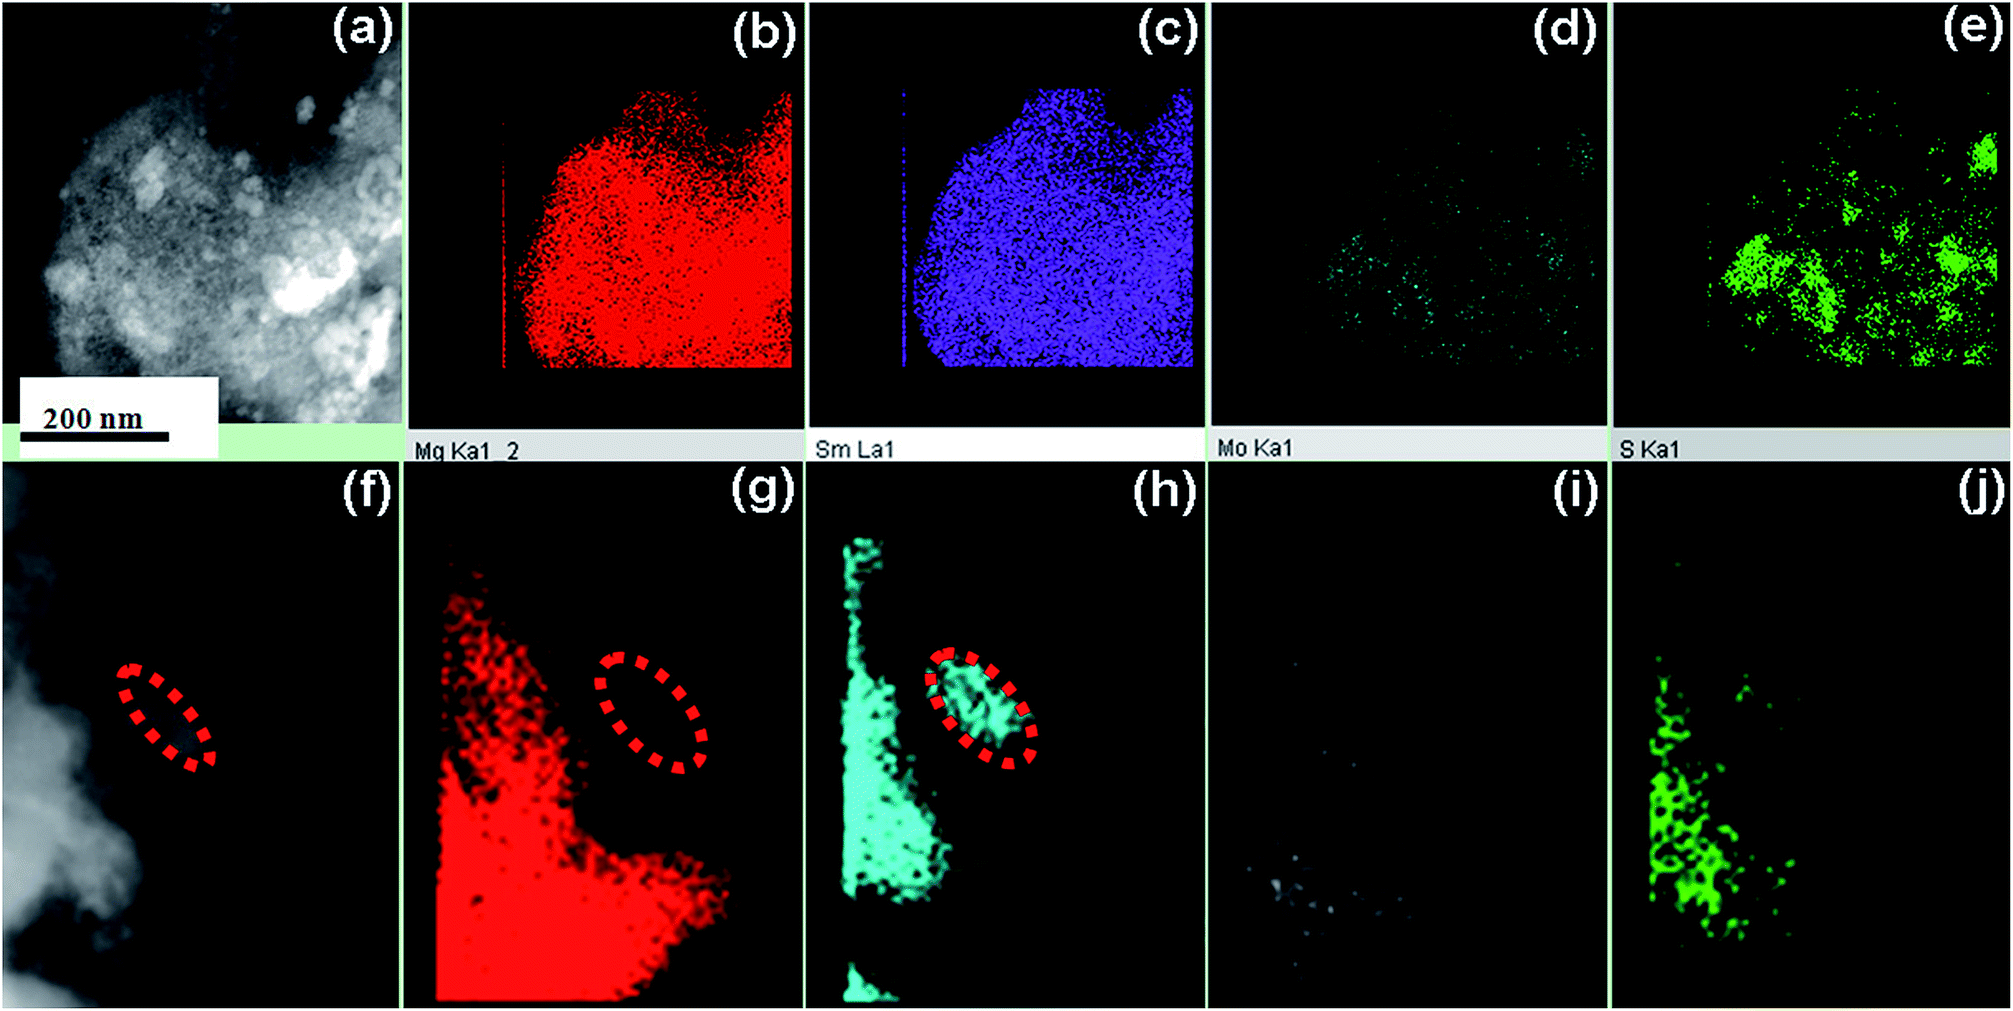
The FETEM analysis was conducted to investigate the changes in the microstructure and the phase distribution of the 5 wt% MoS2-catalyzed Sm5Mg41 alloy before and after the hydrogen absorption. Fig. 6 shows the bright field FETEM images and the EDS mapping results, in which the red, purple, cyan, and green points represent the distributions of Mg, Sm, Mo, and S elements, respectively. As shown in Fig. 6(b) and (c), the Mg and Sm elements have nearly the same distribution in the alloy before the hydrogen absorption. However, the Sm element separates from the Mg element after the hydrogen absorption (see Fig. 6(g) and (h)), indicating the atomic migration of Sm and Mg in the Mg-based Sm5Mg41 alloy during the first hydrogen absorption process. Moreover, Mo and S always exhibit nearly the same distribution in the alloy both before and after the hydrogen absorption. This finding shows that the first hydriding cycle induces an irreversible decomposition of the alloy with the formation of a Mg hydride and the corresponding Sm hydride according to the following mechanism: Sm5Mg41 + SmMg3 + H2 → Sm3H7 + MgH2. The nucleation and growth mechanism of the formed Sm3H7–MgH2 composites can be described as follows. The Mg-based Sm5Mg41 alloy initially transforms into Sm3H7 and Mg and then into the Sm3H7–MgH2 composites during the hydrogenation process.30 Moreover, the MoS2 phase is stable.
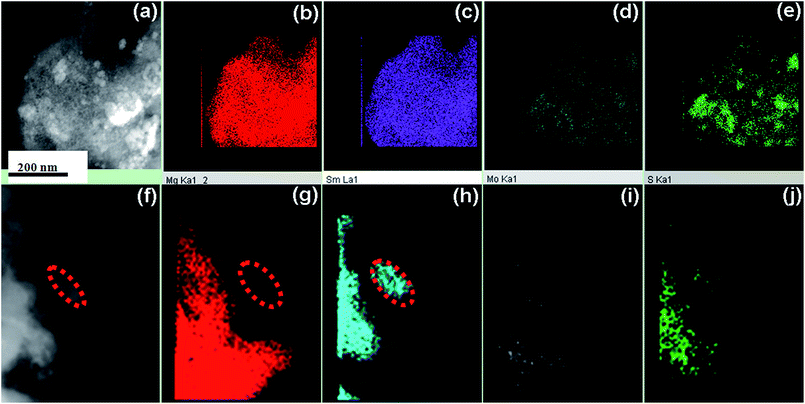 |
| | Fig. 6 FETEM micrographs and EDS mapping of the 5 wt% MoS2 catalyzed Sm5Mg41 alloys before the hydrogen absorption (a–e) and the hydrogenated sample after the hydrogen absorption (f–j). | |
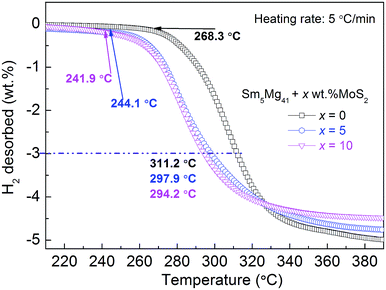
Hydrogen desorption temperature
To investigate the relationship between the H-desorption temperature and the hydrogen desorption capacity, the temperature programmed desorption curves of the hydrogenated Sm5Mg41 + x wt% MoS2 (x = 0, 5, and 10) alloys were constructed at a heating rate of 5 °C min−1 (Fig. 7). It can be observed that three non-isothermal dehydrogenation curves are similar in shape, but the initial temperatures of the hydrogen release are different, i.e., 268.3, 244.1, and 241.9 °C for x = 0, 5, and 10, respectively. There is a visible decrease of 16.4 °C in the initial dehydriding temperature. Moreover, the dehydriding temperatures of the alloys are 311.2, 297.9, and 294.2 °C for x = 0, 5, and 10, respectively, corresponding to 3 wt% of the hydrogen desorption capacity, while that of pure MgH2 is 428 °C.21 From the above description, it can be inferred that the dehydriding temperature decreased significantly due to the catalytic action of MoS2 and Sm3H7 nano-particles.
 |
| | Fig. 7 Temperature programmed desorption curve of the Sm5Mg41 + x wt% MoS2 (x = 0, 5, and 10) alloys after the hydrogen absorption at a heating rate of 5 °C min−1. | |
Hydrogen storage kinetics
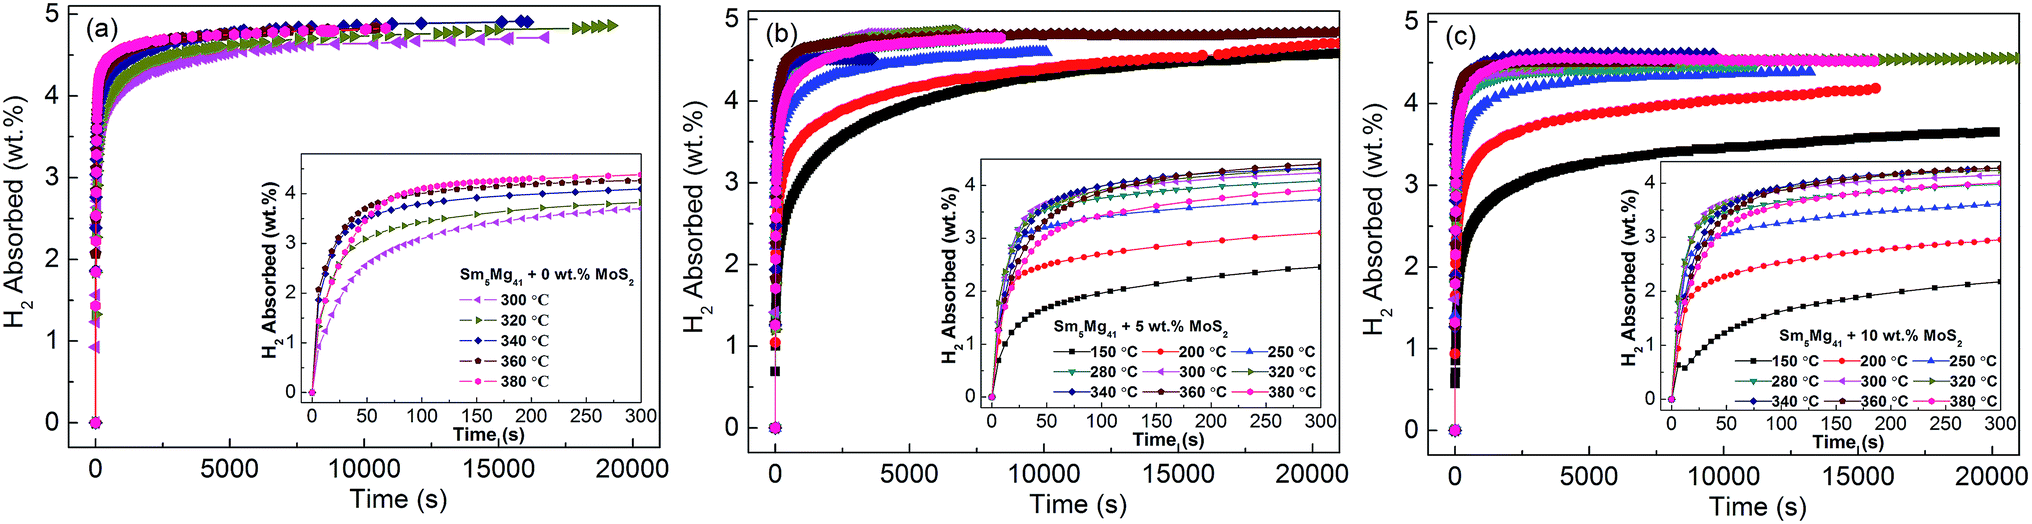
In order to understand the influence of the addition of MoS2 catalyst on the hydrogenation kinetics of the Sm5Mg41 alloys, the isothermal hydrogenation kinetic curves of the alloys were constructed at different temperatures (Fig. 8). It is evident that the catalyst can significantly decrease the temperature of the hydrogen absorption. The absorption temperature of the catalyzed Sm5Mg41 alloys with 5 wt% and 10 wt% MoS2 dramatically decreases to 150 °C. Moreover, the hydriding capacities of the experimental samples can reach the values of 3.0 wt% at 200 °C within 300 s. However, the maximum hydrogen absorption capacities are 5.01, 4.87, and 4.60 wt% for the non-catalyzed alloy, 5 wt%-added alloy, and 10 wt%-added alloy, respectively. The reduction in the maximum capacity is attributed to the inability of the catalyst to react with H2 and produce the hydrides. Thus, it can be deduced that the catalyst can markedly enhance the hydriding properties. The catalytic action can be explained as follows. The catalyst enhances the rate of diffusion of H2 and decreases the dissociation energy of H2 into the H atoms on the surfaces of the alloys.
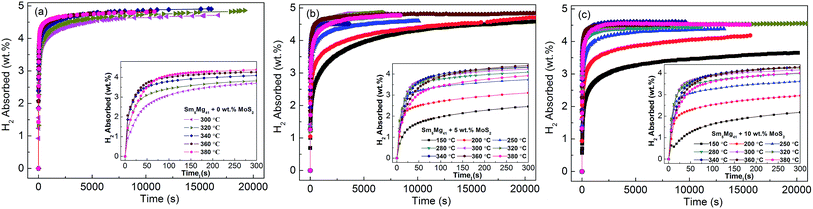 |
| | Fig. 8 Isothermal hydrogenation kinetic curves of the Sm5Mg41 + x wt% MoS2 (x = 0, 5, 10) alloys at different temperatures: (a) x = 0; (b) x = 5; and (c) x = 10. | |
Fig. 9 shows the hydrogen desorption curves of the as-milled Sm5Mg41 alloys with different MoS2 loadings at different temperatures. The dehydrogenation capacities of the alloys decrease with an increase in the MoS2 weight fraction because of its dead-weight. In other words, the maximum dehydrogenation capacities of the Sm5Mg41 + x wt% MoS2 (x = 0, 5, and 10) alloys at 360 °C are 4.88 wt%, 4.57 wt%, and 4.35 wt%, respectively, for x = 0, 5, and 10. These values are lower than their hydrogenation capacity values because the stored hydrogen cannot be desorbed fully in a closed test system. The times to desorb 3.5 wt% hydrogen at 300, 320, 340, 360, and 380 °C are 12180, 4530, 1704, 702, and 352 s, respectively, in the case of the non-catalyzed Sm5Mg41 alloy, 970, 552, 362, 244, and 184 s, respectively, in the case of the 5 wt% MoS2 added Sm5Mg41 alloy, and 1272, 621, 386, 261, and 199 s in the case of the 10 wt% MoS2 added Sm5Mg41 alloy. It can be observed from the comparison that the dehydriding rates decrease with a decrease in the temperature. Adding 5 wt% MoS2 markedly improves the dehydrogenation kinetics of the Sm5Mg41 alloy, but the improvement is hindered when an excess catalyst is added because of its dead-weight.
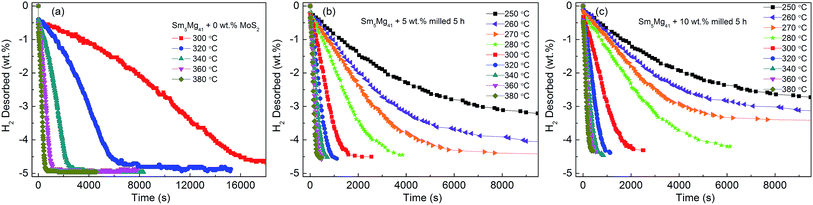 |
| | Fig. 9 Isothermal dehydrogenation kinetic curves of the Sm5Mg41 + x wt% MoS2 (x = 0, 5, and 10) alloys at different temperatures: (a) x = 0; (b) x = 5; and (c) x = 10. | |
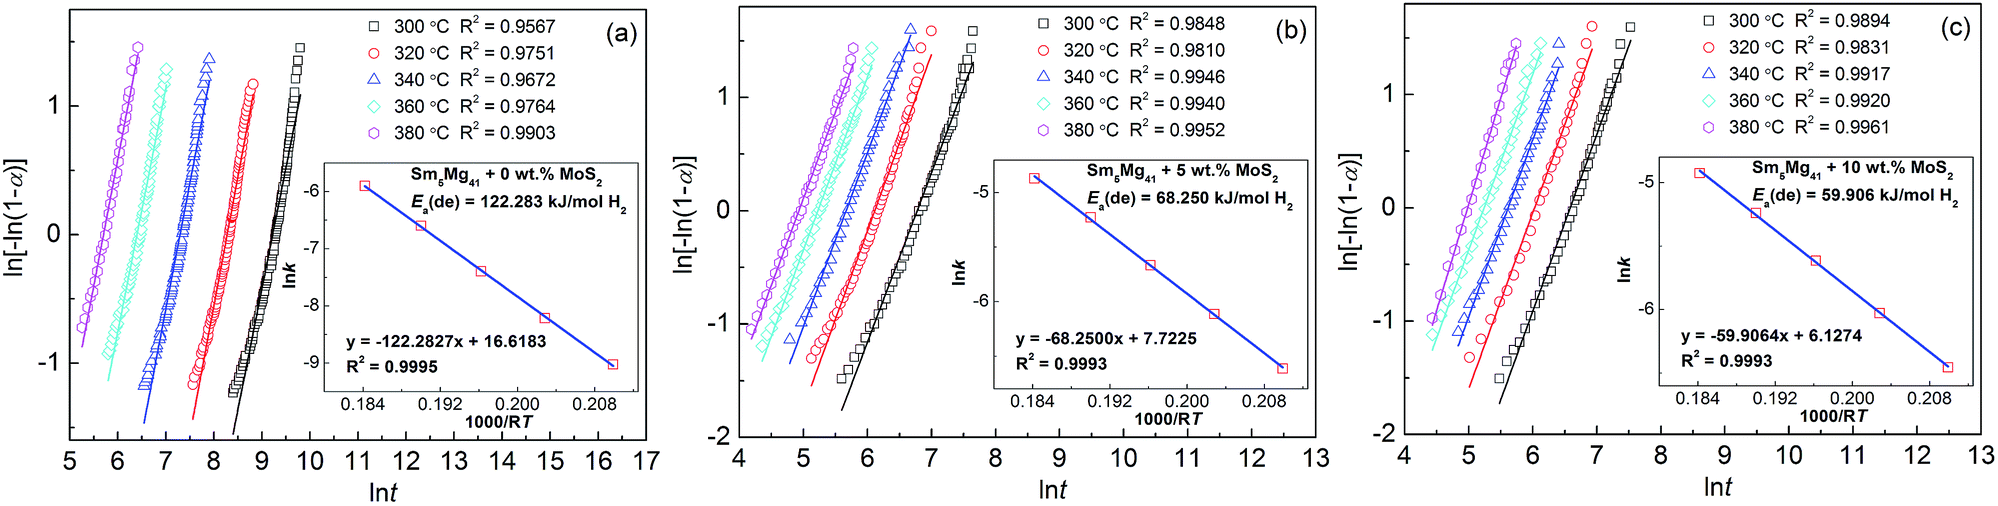
Hydrogen desorption activation energy is an important factor in describing the dehydrogenation kinetics of an alloy.36 In this study, we chose the Arrhenius method to describe the effect of the MoS2 addition on the dehydrogenation process. The dehydrogenation kinetics is primarily determined by the energy barrier, which needs to be overcome before MgH2 can release H2. The activation energy is defined as the total energy overcome during the dehydrogenation process. In the current study, the dehydrogenation process of Sm5Mg41 follows a nucleation and growth process. The Johnson–Mehl–Avrami (JMA) model is used to simulate this process as follows:
| | |
ln[−ln(1 − α)] = ηlnk + ηlnt
| (1) |
where
α is the phase fraction transformed at time
t, which can be identified using a normalized hydrogen wt% (range from 0 to 1),
η is the Avrami exponent, and
k is an effective kinetic parameter. Using the logarithmic form of
eqn (1), the JMA plots of ln[−ln(1 −
α)]
vs. ln
t can be drawn at the temperatures of 300, 320, 340, 360, and 380 °C at different MoS
2 contents, as shown in
Fig. 10. The fitting lines of the JMA plots are almost linear, which indicates that the dehydrogenation reaction exhibits an instantaneous nucleation followed by an interface-controlled three-dimensional growth process. The slope and intercept of the JMA plots represent the values of
η and
ηln
k, respectively, from which the value of the rate constant
k could be deduced. Using the Arrhenius method, the dehydrogenation activation energy
Ea(de) can be calculated as follows:
| | |
k = A exp[−Ea(de)/RT]
| (2) |
where
k is an effective kinetic parameter, as defined previously,
A is a temperature independent coefficient,
R is the universal gas constant (8.3145 J mol
−1 K
−1), and
T is the absolute temperature. Using the logarithmic transform of
eqn (2), the Arrhenius plots of ln
k vs. 1/
T can be drawn as shown in the inset in
Fig. 10. The fitting lines of all of the Arrhenius plots are almost linear. From the slopes of the fitting lines, the activation energies of the Sm
5Mg
41 alloys are calculated to be 122.28, 68.25, and 59.91 kJ mol
−1 H
2 for
x = 0, 5, and 10, respectively, which indicates that the activation energies of the Sm
5Mg
41 alloys decreased with an increase in the MoS
2 content. The nano-MoS
2 used as the catalysts markedly reduces the energy barrier and lowers the driving forces required for nucleation during the dehydrogenation reaction. In addition, the
Ea(de) value of the as-milled Sm
5Mg
41 alloy is much lower than that of pure milled MgH
2 (158.5 kJ mol
−1 H
2),
37 suggesting that Sm
3H
7 can catalyze the desorption reaction of MgH
2, and the similar results have been demonstrated in the Sm
5Mg
41 alloys.
30
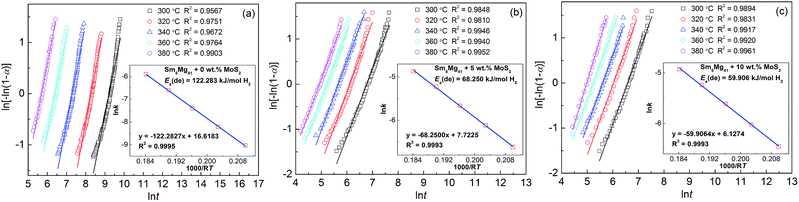 |
| | Fig. 10 JMA plots and Arrhenius plots for the dehydrogenation of the Sm5Mg41 + x wt% MoS2 (x = 0, 5, and 10) alloys: (a) x = 0; (b) x = 5; and (c) x = 10. | |
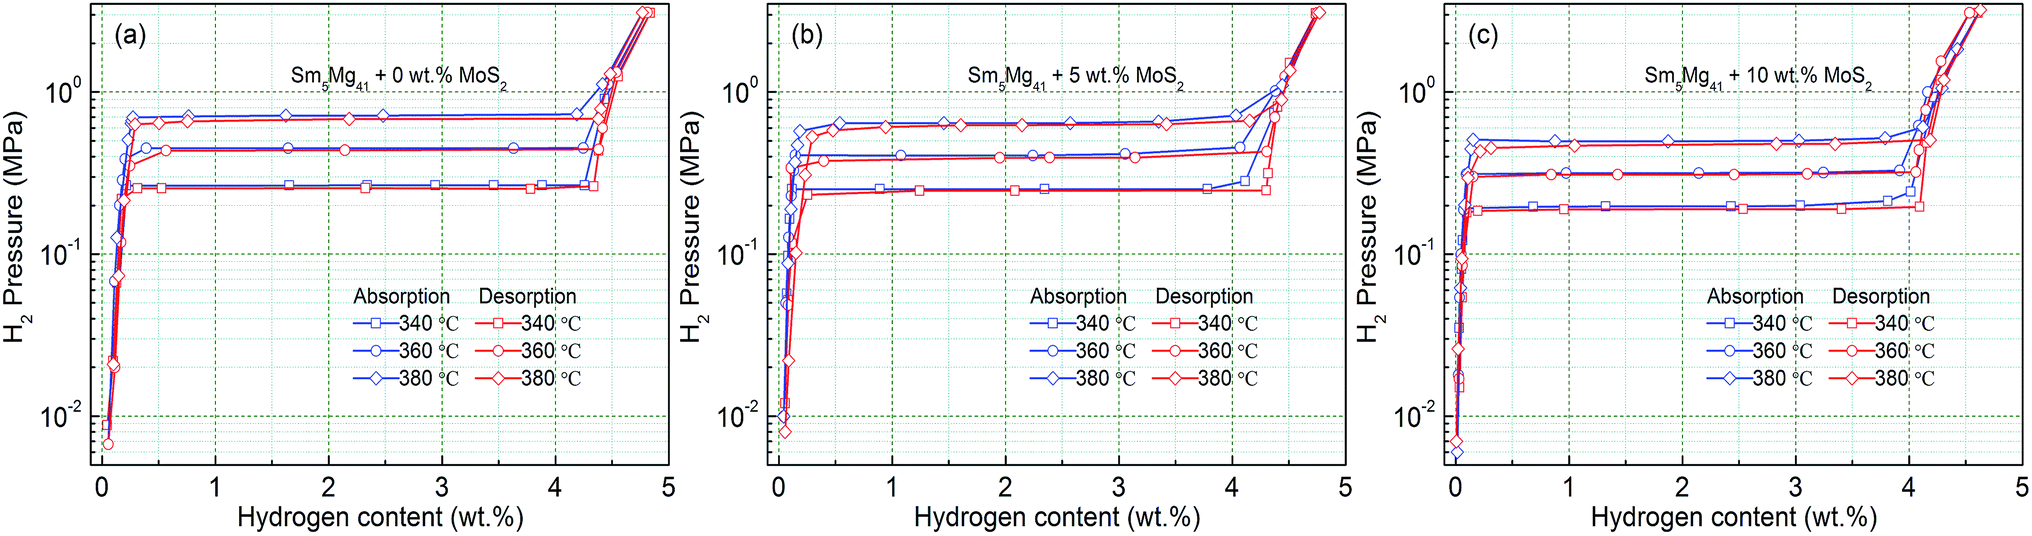
Hydrogen storage thermodynamics
In order to analyze the influence of the catalyst on the hydrogen storage thermodynamics of the Sm5Mg41 + x wt% MoS2 (x = 0, 5, and 10) alloys, the P–C-I curves were constructed at different temperatures. Fig. 11 shows that each curve has only one flat hydrogen equilibrium plateau. The thermodynamic data obtained from the P–C-I measurements are listed in Table 2. It can be found that the absorption/desorption pressure plateaus reduce with an increase in the MoS2 content, which attributes to Mo that can facilitate the dissociation of hydrogen.38
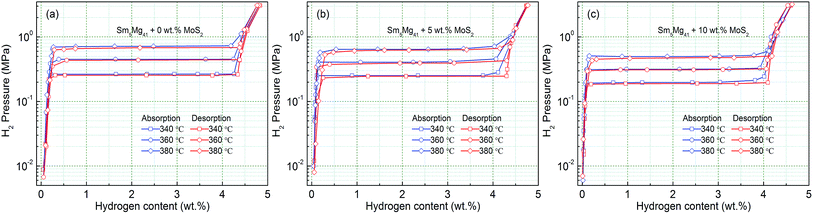 |
| | Fig. 11 P–C-I curves of the Sm5Mg41 + x wt% MoS2 (x = 0, 5, and 10) alloys measured at different temperatures: (a) x = 0; (b) x = 5; and (c) x = 10. | |
Table 2 Plateau pressures from the P–C-I curves at different temperatures and the calculated enthalpy and entropy for the hydrogen absorption and desorption process of the MoS2 catalyzed Sm5Mg41 alloys
| As-milled 5 h Sm5Mg41 alloys |
Plateau pressure (MPa) |
Thermodynamic parameters |
| 340 °C |
360 °C |
380 °C |
ΔH (kJ mol−1) |
ΔS (J K−1 mol−1) |
| Non-added |
Absorption |
0.266 |
0.451 |
0.716 |
−82.3868 |
−161.6095 |
| Desorption |
0.255 |
0.438 |
0.684 |
82.0241 |
160.7176 |
| Added 5 wt% MoS2 |
Absorption |
0.252 |
0.407 |
0.645 |
−78.1844 |
−135.1105 |
| Desorption |
0.246 |
0.394 |
0.625 |
77.5607 |
133.8804 |
| Added 10 wt% MoS2 |
Absorption |
0.197 |
0.317 |
0.497 |
−76.9900 |
−131.1250 |
| Desorption |
0.190 |
0.309 |
0.479 |
76.9502 |
130.7887 |
According to the absorption/desorption pressure plateaus, the thermodynamic parameters, viz., enthalpy change (ΔH) and entropy change (ΔS), can be estimated from the Van't Hoff equation30 as shown below:
| | |
ln[P(H2)/P0] = ΔH/(RT) − ΔS/R
| (3) |
where
P0 = 1 atm, and
R and
P(H
2) refer to the gas constant and the equilibrium plateau pressure, respectively. The Van't Hoff curves (ln[
P(H
2)/
P0]
vs. 1/
T) are illustrated in
Fig. 12. According to the slopes and intercepts of the fitting lines obtained from the experimental data, the thermodynamic parameters can be calculated (
Table 2). The changes in the hydrogenation enthalpies (Δ
Hab) are 82.39, 78.18, and 76.99 kJ mol
−1 H
2 for
x = 0, 5, and 10, respectively, while the corresponding changes in the dehydrogenation enthalpies (Δ
Hde) are −82.02, −77.56, and −76.95 kJ mol
−1 H
2. However, the Δ
Hde value of the experimental alloys is very close to that of pure Mg, namely, −76 to –78 kJ mol
−1,
39,40 which suggests that the addition of a MoS
2 catalyst could not change the thermodynamic properties in terms of the hydrogen storage in the Mg-based alloys.
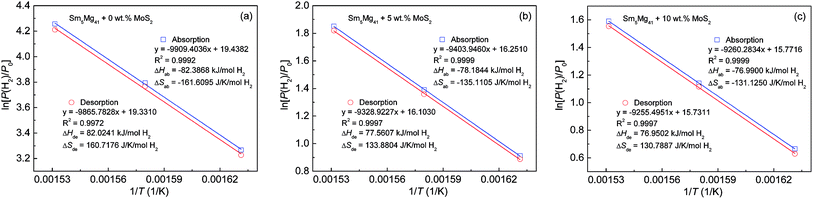 |
| | Fig. 12 Van't Hoff plots of the Sm5Mg41 + x wt% MoS2 (x = 0, 5, and 10) alloys measured at different temperatures: (a) x = 0; (b) x = 5; and (c) x = 10. | |
Conclusions
(1) The alloys are composed of the nanocrystal phases of Sm5Mg41, SmMg3, and MoS2. Mechanical milling and catalyst doping lead to a reduction in the particle sizes. These particles can store a strain energy, which contributes to an improvement in the hydrogen storage kinetics. The MoS2 phase is stable during the absorption/desorption cycling process. The MgH2 and Sm3H7 phases are formed after the hydrogen absorption, while the Mg and Sm3H7 phases are generated after the hydrogen desorption. The hydriding/dehydriding reaction mechanism is as follows: Sm5Mg41 + SmMg3 + H2 → Sm3H7 + MgH2 ↔ Sm3H7 + Mg + H2.
(2) The activation energies of dehydrogenation are estimated to be 122.283, 68.250, and 59.906 kJ mol−1 H2 at the MoS2 catalyst contents of 0, 5, and 10 wt%, respectively, which suggests that the nano-MoS2 reduces the energy barrier and lowers the driving forces required for nucleation during the dehydrogenation reaction.
(3) The catalyzed alloys begin to release hydrogen at ∼241.9 °C, which is ∼26.4 °C lower than that of the non-catalyzed alloy. The hydrogenation enthalpy of the 10 wt% MoS2-catalyzed alloy is determined to be ∼76.99 kJ mol−1 H2, which is very close to that of pure Mg, indicating that catalyst addition could not alter the thermodynamic properties in terms of the hydrogen storage in the Mg-based alloys.
Conflicts of interest
There are no conflicts to declare.
Acknowledgements
This work is financially supported by the National Natural Science Foundations of China (51761032, 51471054 and 51371094) and Natural Science Foundation of Inner Mongolia, China (2015MS0558).
References
- W. Li, X. F. Gao, D. H. Xiong, F. Wei, W. G. Song, J. Y. Xu and L. F. Liu, Adv. Energy Mater., 2017, 7, 1602579 CrossRef.
- W. Li, X. F. Gao, D. H. Xiong, F. Xia, J. Liu, W. G. Song, J. Y. Xu, S. M. Thalluri, M. F. Cerqueira, X. L. Fu and L. F. Liu, Chem. Sci., 2017, 8, 2952–2958 RSC.
- W. Li, D. H. Xiong, X. F. Gao, W. G. Song, F. Xia and L. F. Liu, Catal. Today, 2017, 287, 122–129 CrossRef CAS.
- W. Li, X. F. Gao, X. G. Wang, D. H. Xiong, P. P. Huang, W. G. Song, X. Q. Bao and L. F. Liu, J. Power Sources, 2016, 330, 156–166 CrossRef CAS.
- W. Li, X. G. Wang, D. H. Xiong and L. F. Liu, Int. J. Hydrogen Energy, 2016, 41, 9344–9354 CrossRef CAS.
- X. G. Wang, W. Li, D. H. Xiong, D. Y. Petrovykh and L. F. Liu, Adv. Funct. Mater., 2016, 26, 4067–4077 CrossRef CAS.
- C. Y. Cao, C. Q. Chen, W. Li, W. G. Song and W. Ca, ChemSusChem, 2010, 3, 1241–1244 CrossRef CAS PubMed.
- F. Z. Song, W. Li and Y. J. Sun, Inorganics, 2017, 5, 40 CrossRef.
- X. G. Wang, W. Li, D. H. Xiong and L. F. Liu, J. Mater. Chem. A, 2016, 4, 5639–5646 CAS.
- D. L. Zhao and Y. H. Zhang, Rare Met., 2014, 33, 499–510 CrossRef CAS.
- M. Anik, F. Karanfil and N. Küçükdeveci, Int. J. Hydrogen Energy, 2012, 37, 299–308 CrossRef CAS.
- M. S. L. Hudson, K. Takahashi, A. Ramesh, S. Awasthi, A. K. Ghosh, P. Ravindran and O. N. Srivastava, Catal. Sci. Technol., 2016, 6, 261–268 Search PubMed.
- M. Lototskyy, J. M. Sibanyoni, R. V. Denys, M. Williams, B. G. Pollet and V. A. Yartys, Carbon, 2013, 57, 146–160 CrossRef CAS.
- N. V. Mushnikov, A. E. Ermakov, M. A. Uimin, V. S. Gaviko, P. B. Terent'ev, A. V. Skripov, A. P. Tankeev, A. V. Soloninin and A. L. Buzlukov, Phys. Met. Metallogr., 2006, 102, 421–431 CrossRef.
- M. Tanniru, H. Y. Tien and F. Ebrahimi, Scr. Mater., 2010, 63, 58–60 CrossRef CAS.
- M. Zhu, Y. Gao, X. Z. Che, Y. Q. Yang and C. Y. Chung, J. Alloys Compd., 2002, 330, 708–713 CrossRef.
- K. Nogita, Q. T. Xuan, T. Yamamoto, E. Tanaka, S. D. Mcdonald, C. M. Gourlay, K. Yasuda and S. Matsumura, Sci. Rep., 2015, 5, 8450 CrossRef CAS PubMed.
- J. Qu, Y. Wang, L. Xie, J. Zheng, Y. Liu and X. Li, J. Power Sources, 2009, 186, 515–520 CrossRef CAS.
- P. Spatz, H. A. Aebischer, A. Krozer and L. Schlapbach, Z. Phys. Chem., 1993, 181, 393–397 CrossRef CAS.
- Y. S. Au, M. K. Obbink, S. Srinivasan, P. C. M. M. Magusin, K. P. De Jong and P. E. De Jongh, Adv. Funct. Mater., 2014, 24, 3604–3611 CrossRef CAS.
- Rafi-ud-din, X. Qu, P. Li, Z. Lin, M. Ahmad, M. Z. Iqbal, M. Y. Rafique and M. H. Farooq, RSC Adv., 2012, 2, 4891–4903 RSC.
- N. Juahir, N. S. Mustafa, A. M. Sinin and M. Ismail, RSC Adv., 2015, 5, 60983–60989 RSC.
- H. Liu, C. Wu, H. Zhou, T. Chen, Y. Liu, X. Wang, D. Zhaohui, H. Ge, S. Li and M. Yan, RSC Adv., 2015, 5, 22091–22096 RSC.
- J. Cui, H. Wang, J. Liu, L. Ouyang, Q. Zhang, D. Sun, X. Yao and M. Zhu, J. Mater. Chem. A, 2013, 1, 5603–5611 CAS.
- H. J. Lin, J. J. Tang, Q. Yu, H. Wang, L. Z. Ouyang, Y. J. Zhao, J. W. Liu, W. H. Wang and M. Zhu, Nano Energy, 2014, 9, 80–87 CrossRef CAS.
- R. R. Shahi, A. Bhatanagar, S. K. Pandey, V. Shukla, T. P. Yadav, M. A. Shaz and O. N. Srivastava, Int. J. Hydrogen Energy, 2015, 40, 11506–11513 CrossRef CAS.
- M. S. El-Eskandarany, H. S. AlMatrouk and E. Shaban, Mater. Today, 2016, 3, 2735–2743 CrossRef.
- M. Tian and C. Shang, J. Chem. Sci. Tech., 2012, 1, 54–59 Search PubMed.
- Y. Jia, S. Han, W. Zhang, X. Zhao, P. Sun, Y. Liu, H. Shi and J. Wang, Int. J. Hydrogen Energy, 2013, 38, 2352–2356 CrossRef CAS.
- Z. Yuan, T. Yang, W. Bu, H. Shang, Y. Qi and Y. Zhang, Int. J. Hydrogen Energy, 2016, 41, 5994–6003 CrossRef CAS.
- Y. Zhang, W. Zhang, Z. M. Yuan, W. Bu, Y. Qi and S. Guo, Int. J. Hydrogen Energy, 2017, 42, 17157–17166 CrossRef CAS.
- X. D. Li, G. X. Wu, J. W. Chen, M. C. Li, W. Li, T. Y. Wang, B. Jiang, Y. He and L. Q. Mai, Appl. Surf. Sci., 2017, 392, 297–304 CrossRef CAS.
- W. Li, D. H. Chen, F. Xia, J. Z. Y. Tan, J. Song, W. G. Song and R. A. Caruso, Chem. Commun., 2016, 52, 4481–4484 RSC.
- X. D. Li, W. Li, M. C. Li, P. Cui, D. H. Chen, T. Gengenbach, L. H. Chu, H. Y. Liu and G. S. Song, J. Mater. Chem. A, 2015, 3, 2762–2769 CAS.
- D. H. Xiong, Q. Q. Zhang, W. Li, J. J. Li, X. L. Fu, M. F. Cerqueira, P. Alpuim and L. F. Liu, Nanoscale, 2017, 9, 2711–2717 RSC.
- M. Pourabdoli, S. Raygan, H. Abdizadeh and D. Uner, Int. J. Hydrogen Energy, 2013, 38, 11910–11919 CrossRef CAS.
- J. Mao, Z. Guo, X. Yu, H. Liu, Z. Wu and J. Ni, Int. J. Hydrogen Energy, 2010, 35, 4569–4575 CrossRef CAS.
- S. Srivastava and K. Panwar, Mater. Renew. Sustain. Energy, 2015, 4, 19–29 CrossRef.
- J. X. Zou, H. Guo, X. Q. Zeng, S. Zhou, X. Chen and W. J. Ding, Int. J. Hydrogen Energy, 2013, 38, 10912–10918 CrossRef.
- Y. Zhang, M. Ji, Z. Yuan, W. Bu, Y. Qi and S. Guo, RSC Adv., 2017, 7, 37689–37698 RSC.
|
| This journal is © The Royal Society of Chemistry 2017 |
Click here to see how this site uses Cookies. View our privacy policy here. 
 Open Access Article
 This Open Access Article is licensed under a Creative Commons Attribution-Non Commercial 3.0 Unported Licence
 *ab,
Wengang Bua,
Shihai Guoa and
Dongliang Zhaoa
*ab,
Wengang Bua,
Shihai Guoa and
Dongliang Zhaoa