 Open Access Article
Creative Commons Attribution 3.0 Unported Licence
Preparation of nitrogen-doped carbon dots with high quantum yield from Bombyx mori silk for Fe(III) ions detection†
Hui Liua,
Yue Zhanga,
Jia Hui Liua,
Peng Houa,
Jun Zhou *ab and
Cheng Zhi Huang
 *ac
*ac
aKey Laboratory of Luminescent and Real-Time Analytical Chemistry (Southwest University), Ministry of Education, College of Pharmaceutical Sciences, Southwest University, Chongqing 400716, China. E-mail: zhouj@swu.edu.cn; chengzhi@swu.edu.cn
bCollege of Computer and Information Science, Southwest University, Chongqing 400715, China
cChongqing Key Laboratory of Biomedical Analysis (Southwest University), Chongqing Science & Technology Commission, College of Chemistry and Chemical Engineering, Southwest University, Chongqing 400715, China
First published on 31st October 2017
Abstract
Nitrogen-doped carbon dots (CDs) have attracted increasing attention in the field of biochemistry and biosensors due to their high emission efficiency. Herein, Bombyx mori silk, natural fibres composed by two fibroin brins and conglutinated by sericin binder, has a high content of nitrogen, was used as raw material in the coupling of citric acid to prepare nitrogen-doped CDs using a facile one-step hydrothermal route. The as-prepared nitrogen-doped CDs are uniform with an average particle size of 5.6 nm, emit blue fluorescence with the quantum yield of 61.1%, and maintain photochemical stability in high salt concentrations and in most organic solvents. Binding experiments of the as-prepared CDs with metal ions show that the hydroxyl groups on their surface play very important role in the blue fluorescence emission, which can easily bind with Fe3+ as the consequence of fluorescence quenching, making a method for Fe3+ detection developed with high selectivity and sensitivity.
Introduction
Carbon dots (CDs) have attracted increasing attention since they were discovered as a new type of carbon nanomaterial.1,2 Compared to conventional organic dyes and semiconductor quantum dots,3–5 CDs show high photostability, good biocompatibility, low cytotoxicity, easy preparation, and low cost.5–8 There is a trend that CDs become the optimal alternative to conventional fluorescent materials since CDs have begun to find its uses in fluorescent sensing and imaging,8–12 drug delivery and release,13–15 and other fields.Up to now, new routes to prepared CDs with smart properties,16–20 strategies for surface functionalization,21–26 and applications for bioimaging and biosensing7,27,28 have been well reported. It is noticeable that the initial discovered CDs have the quantum yield of generally less than 10%.29,30 With the exploration of new synthetic methods and improved routes, raw materials selection, and CDs surface modification31 or doping,32,33 the photoluminescent efficiency of CDs could be significantly increased, making the applications of carbon dots expanded. Element doping, which can avoid complex modification processes, stands out from these strategies and can produce CDs with good emission fluorescence and special performance. For example, doping of nitrogen, since its sources are easy to access and the mechanism of action is related to the nitrogen-containing chromophore can passivate the active sites on the surface of the CDs,31 making the quantum yield substantially increased. Therefore, nitrogen doping is a very effective way to increase the quantum yield of CDs.34–37
Bombyx mori silk, a composite of natural proteins, has the nitrogen content as high as 18%.38 Using Bombyx mori silk as a raw material, nitrogen-doped CDs have been prepared through a hydrothermal route and used as a fluorescent probe in bioimaging.39 However, the as-developed CDs merely have a photoluminescence quantum yield of 13.9%, which are still low relative to those of semiconductor quantum dots. Furthermore, preparation of highly photoluminescent nitrogen-doped CDs by hydrothermal methods were reported in recent years.7,40 In addition, how to prepare CDs with high quantum yield and good biocompatibility, which has been scarcely studied in the literature. Therefore, the development of a facile, economic and green method to prepare CDs with high quantum yield and good biocompatibility using Bombyx mori silk remains challenging.
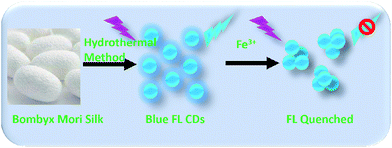
As Scheme 1 shown, we developed a facile and simple one step hydrothermal method to prepare blue fluorescent nitrogen-doped CDs with high quantum yield using Bombyx mori silk and citric acid. Citric acid was a carbon source to construct CDs, and silk was a nitrogen source and may serve as surface-passivating agent. In this work, the optical and chemical properties of as-prepared CDs were investigated by modern characterized techniques. The as-prepared CDs were homogeneous and had a certain crystal form that had an average particle size of 5.6 nm, and a quantum yield as high as 61.1% was achieved. Meanwhile, the surface of the CDs was rich in carboxyl and hydroxyl groups, which enabled good water solubility and stable fluorescence properties. Furthermore, the hydroxyl groups on the surface of the as-prepared CDs are highly specific to Fe3+, which induces fluorescence quenching of CDs, making the as-prepared CDs as a luminescent probe for selective and sensitive detection of Fe3+.
Experimental
Instruments and reagents
A polytetrafluoroethylene reactor and an electric drying oven were purchased from Jinan Henghua Technology Co., Ltd., China and Shanghai Yiheng Scientific Instrument Co., Ltd., China, respectively. A fluorescence spectrophotometer (F-2500, Hitachi, Japan) was used for detecting the excitation and emission spectra of CDs. A UV-visible-near infrared spectrophotometer (UV-3600, Shimadzu, Japan) was used to detect the absorption spectrum of the aqueous solution of CDs. A high-resolution transmission electron microscope (Tecnai G2 F20 S-TWIN, FEI, USA) was used to characterize the morphology, particle size, and lattice characteristics of the CDs with an accelerating voltage of 200 kV. A Dimension Icon ScanAsyst atomic force microscope was purchased from Brooks, USA. The hydrodynamic diameter and surface charge of the CDs were determined using a Zetasizer Nano instrument (Malvern Instruments, UK). Fourier transform infrared spectroscopy (FITR-8400S, Shimadzu), X-ray photoelectron spectroscopy (ESCALAB 250, Thermo, USA), and laser confocal Raman spectroscopy (LabRAM HR 800) were used to analyze the elements and functional groups of the CDs. A pH meter (PHS-3C, Chengdu Fangzhou Technology Development Co., China) was used to determine the acidity of the solutions. A vortex mixer (QL-9011, Jiangsu Linqibeier Instrument Manufacturing Co., Ltd.) was used to mix the solutions. A Canon 550 D digital camera was used to take photos.All of the solvents were analytical grade. Silk was provided by State Key Laboratory of Silkworm Genome Biology, Southwest University. N,N-Dimethylformamide (DMF) was purchased from Chengdu Kelong Reagent Co., Ltd. Polyacrylonitrile (PAN) was purchased from Sigma (Shanghai). Citric acid was purchased from Chuandong Chemical Reagent Co., Ltd. (Chongqing, China). The solutions used in the experiments were prepared using ultrapure water (18.2 MΩ).
Preparation and purification of nitrogen-doped CDs
0.16 g of silk, 0.16 g of citric acid, and 4 mL of double distilled water were mixed in a 25 mL beaker, and then transferred to a 25 mL Teflon-lined stainless steel reactor. All of the silk was ensured to immerse in the solution, and then the steel set was installed and heated at 200 °C for 3.5 h in a drying oven. After the reaction, the reactor was cooled to room temperature. The product was centrifuged at 11![[thin space (1/6-em)]](https://www.rsc.org/images/entities/char_2009.gif) 000 rpm for 15 min to wash away the incompletely reacted non-fluorescent substances, and the supernatant that contained the CDs was retained for further use. Subsequently, the remaining raw materials were removed via 12 h of dialysis with a dialysis bag that had a cutoff molecular weight of 500 D; the dialysate was replaced every 2 h. Finally, a solid powder was obtained after freezing and vacuum drying.
000 rpm for 15 min to wash away the incompletely reacted non-fluorescent substances, and the supernatant that contained the CDs was retained for further use. Subsequently, the remaining raw materials were removed via 12 h of dialysis with a dialysis bag that had a cutoff molecular weight of 500 D; the dialysate was replaced every 2 h. Finally, a solid powder was obtained after freezing and vacuum drying.
Calculation of the quantum yield
Determination of relative fluorescence quantum yield was as follows. According to the literature,29,41 quinine sulfate solution was used as the reference (quantum yield of 54%), and the emission spectra of the CDs with quinine sulfate at different concentrations (excited at 360 nm) and the corresponding absorption spectra were recorded. The absorbance values at 360 nm in the corresponding absorption spectra were then plotted in the X-direction, and the areas of the emission spectra were plotted in the Y-direction to calculate the slope of the curve. The quantum yield was then calculated according to the equation:| Φx = ΦST(mx/mST)(ηx2/ηST2) | (1-1) |
Detection of Fe3+ using nitrogen-doped CDs
0.25 mg of fluorescent CDs powder prepared under the optimum conditions was dispersed in 1 mL of HAc–NaAc buffer solution with pH 3.2 to prepare the fluorescent CDs solution with an actual concentration of 0.25 mg mL−1. Then 50 μL of 0.25 mg mL−1 CDs and 50 μL of Fe3+ solution at different concentrations were sequentially added to a 1.5 mL PE tube, and the final volume was adjusted to 500 μL by adding HAc–NaAc buffer with pH 3.2. The mixture was mixed with the vortex instrument and then left to stand for 10 min before the fluorescence determination. After the sample was evenly mixed, the fluorescence intensity was measured using an excitation wavelength of 360 nm, and the experiment was conducted three times in parallel.Results and discussion
Preparation and characterization of CDs
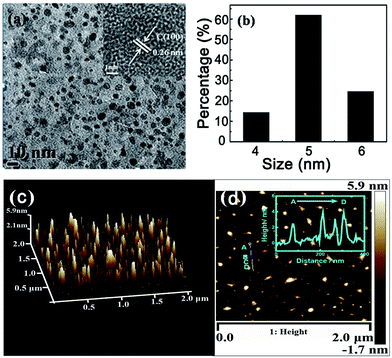
In this study, Bombyx mori silk and citric acid were used as the precursor to prepare nitrogen-doped CDs through one step hydrothermal route. Compared to the previously method to prepare CDs by using silk,39 we used citric acid as a carbon source to construct CDs42 and silk may serve as nitrogen sources39 and surface-passivating agent to achieve high quantum yield.40,43,44 The synthesized solid powder CDs dispersed in solution at an appropriate concentration was deposited on a copper grid and characterized using transmission electron microscopy (TEM) and atomic force microscopy (AFM), and the particle size and morphology of the CDs were analyzed using the results of these two methods. It can be seen from Fig. 1 that the resulting CDs were monodispersed spherical or nearly spherical shapes. The statistical chart in Fig. 1b, which was obtained from TEM image, showed that the sizes of the CDs were in the range of 4–6 nm with an average particle size of 5.6 nm and a narrow size distribution. In the HRTEM image (inset in Fig. 1a), it is observed that the CDs have a certain lattice structure, and the lattice space is 0.26 nm, which is consistent with the parameters reported in the literature. The AFM imaging results of the CDs in Fig. 1c further reveals the morphology of the CDs. Fig. 1d shows the 3D height distribution of the CDs. The height was evenly distributed and had a value of 4 ± 0.5 nm. In combination with the above TEM characterization, we can confirm that the CDs synthesized via this method were approximately spherical. In addition, the CDs were negatively charged (−12.4 eV) according to zeta potential measurements.Structural characterization of CDs
By analyzing the XPS spectrum of the CDs, the specific element composition can be obtained. Fig. 2a shows that the CDs mainly contained carbon, nitrogen, and oxygen. Among these elements, carbon had four different states, as shown in Fig. 2b. It can be seen from the C1s spectrum that the CDs had three distinct peaks at 284.6 eV, 286.7 eV, and 288.1 eV, corresponding to C–C, C–O–C, and –COOH, respectively; the peak at 285.7 eV corresponds to C–N. The nitrogen element can be classified into three categories: pyrrole-like nitrogen (C–N–C) at 399.7 eV, graphite nitrogen or N–H at 401.4 eV (Fig. 2c), and N–(C)3 at 402 eV. Three distinct peaks at 531.4 eV, 532.1 eV, and 532.8 eV can be observed in O1s spectrum of the CDs (Fig. 2d), which correspond to C–O, C![[double bond, length as m-dash]](https://www.rsc.org/images/entities/char_e001.gif) O, and C–OH/C–O–C groups.45
O, and C–OH/C–O–C groups.45
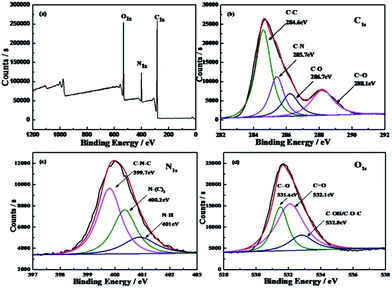 | ||
| Fig. 2 XPS survey scan of the as-prepared CDs. (a) Survey, high resolution N1s (b), C1s (c), and O1s (d) XPS spectra of CDs. | ||
The above analysis results are consistent with the results of the FT-IR spectrum (Fig. 3a) and clearly demonstrate that the surface of the CDs was rich in functional groups such as hydroxyl, carboxyl, and amino groups. These hydrophilic functional groups enhance the water solubility and stability of the CDs, which results in the CDs being highly dispersed and stabilized in aqueous solution.46
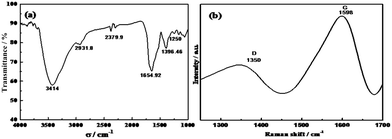 | ||
| Fig. 3 FT-IR and Raman spectrum of the as-prepared CDs. (a) FT-IR spectrum of CDs, (b) Raman spectrum of CDs. | ||
To comprehensively explore the surface functional groups of the synthesized CDs and their structural components, we also carried out infrared and Raman spectroscopy and X-ray photoelectron spectroscopy characterization, and the results are shown in Fig. 3. In the FT-IR spectrum (Fig. 3a), there are two significant absorption peaks at 1654.92 cm−1 and 1396.46 cm−1, and these are attributed to the stretching vibration of C![[double bond, length as m-dash]](https://www.rsc.org/images/entities/char_e001.gif) O and the stretching vibration of C–N, respectively. The absorption peak at 3414 cm−1 corresponds to the stretching vibration of C–O in –OH and unsaturated hydroxyl groups, and this clearly illustrates the presence of both carboxyl and hydroxyl groups on the surface of the synthesized CDs. In addition, the absorption peak at 2931.8 cm−1 corresponds to the C–H stretching vibration in alkanes.
O and the stretching vibration of C–N, respectively. The absorption peak at 3414 cm−1 corresponds to the stretching vibration of C–O in –OH and unsaturated hydroxyl groups, and this clearly illustrates the presence of both carboxyl and hydroxyl groups on the surface of the synthesized CDs. In addition, the absorption peak at 2931.8 cm−1 corresponds to the C–H stretching vibration in alkanes.
To characterize the Raman spectroscopy, we deposited the CDs on a gold base and irradiated them with a 532 nm laser, and the spectrum is shown in Fig. 3b. There is a wide weak D-band peak at 1350 cm−1, indicating that there were sp3 hybridized carbons. The G band is located at 1589 cm−1 and indicates that there were sp2 hybridized carbons, which is associated with the plane vibration and is consistent with the results reported in the literature.47 In the X-ray diffraction (XRD) pattern of the CDs (Fig. S1†), there is a clear broad peak around 24°, and this is the result of the disordered carbon atoms.46 The internal structure and composition of the CDs were analyzed using the above characterization methods, and it can be concluded that the CDs synthesized via this method were mainly composed of sp2 hybridized carbons and that a portion of sp3 hybridized carbons was present in the form of defects.
In this assay, Bombyx mori silk and citric acid were used as the carbon source, and Bombyx mori silk was used as the nitrogen source. Citric acid can self-assemble and form carbon core nanosheet structures by carbonization.42 Carbon core state show relative low quantum yields. Heteroatom-doping and surface passivation can enhance the quantum yields of CDs.48 In N-doped CDs, N atom enters carbon core and form pyrrolic structure (graphitic nitrogen), which effectively improves the quantum yields of N-doped CDs.49,50 Besides, the quantum yields of N-doped CDs increase as the N content increase.48,51 From the XPS data, we can see that the C content and N content are higher than previous reported CDs.39 It is suggested that there is more nanosheet in carbon core, resulting in more N atom could enter carbon core. Herein, quantum yields of as-prepared CDs are higher than previous CDs. The band at 1396.46 cm−1 corresponding to C–N became more obvious in the FT-IR spectra. It is indicated that N atom gradually substituted O atom during the carbonization process, leading to N content increase as XPS data. From the composition and structural of CDs studies, we can see that the N content and the C–N formation were critical to improve the quantum yields of CDs.
Spectral characteristics of CDs
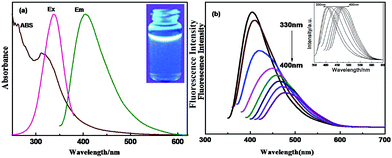
The UV-Vis absorption spectrum of the CDs is shown in Fig. 4a. The CDs exhibited a strong absorption in the UV region, and the absorption range extends to the tail of the visible region. A small shoulder peak caused by a π–π* transition was observed at 267 nm, indicating that the CDs contained functional groups such as carboxyl groups and other isolated pairs of electrons. There is a very broad absorption peak at 314 nm. The CDs showed a relatively symmetrical excitation and emission spectrum, the maximum excitation wavelength was 360 nm, and the maximum emission wavelength was 425 nm. Under a 365 nm UV lamp, the aqueous solution of CDs showed a blue fluorescence (inset figure in Fig. 4a).Meanwhile, the emission peak of the CDs changed with the excitation wavelength. When the excitation wavelength increased from 360 nm to 500 nm at 10 nm intervals, the emission peak red shifted accompanied by a decrease in the fluorescence intensity. This might be because of the different emission sites on the surface or because of the nonuniformity of the particle size (quantum size effect). The excellent luminescent properties of CDs should be closely related to the quantum yield. The quantum yield of the CDs was as high as 61.1% (Fig. S2†) at an excitation wavelength of 360 nm using quinine as a reference. Such a high quantum yield can be attributed to the successful nitrogen doping, showing that nitrogen doping is an effective way to improve the quantum yield of CDs.
Stability of the CDs
As shown in Fig. S3a,† the experimental results prove that the CDs have high photostability against photobleaching. When the aqueous solution of CDs was continuously irradiated with a 360 nm excitation laser for 30 min, there was almost no change in the fluorescence intensity, and no light blinking phenomenon occurred. Meanwhile, the CDs also exhibited good thermal stability and maintained their stability at different temperatures. Additionally, with an increase in temperature, the fluorescence intensity of the CDs was barely affected (Fig. S3b†). As shown in Fig. S3c,† the CDs were also stable in DMF, DMSO, ethanol, and other common organic solvents, and this is very important for the application of CDs in actual complex systems. Moreover, the CDs also showed a strong resistance to salt (Fig. S3d†). The fluorescence intensity of the CDs barely changed within the salt concentrations of 0 to 4 M, and even higher ionic strength did not cause aggregation. The good stabilities of the CDs shown above provide a good foundation for practical applications.Binding of the as-prepared CDs with metal ions
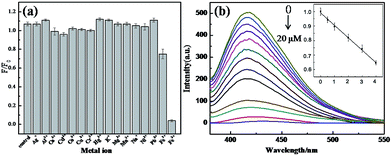
The as-prepared CDs have rich multifunctional groups, such as carboxyl and hydroxyl, which can easily bind with metal ions. In order to investigate the binding features of CDs, we examined the effects of different metal ions on the fluorescence of the CDs under the same conditions and studied the selectivity of the CDs for the metal ions. Fig. 5a shows the effects of 16 different metal ions, including Ag+, Al3+, Ca2+, Cd2+, Co2+, Cu2+, Cr3+, Hg2+, K+, Mg2+, Pb2+, and Fe3+, on the fluorescence intensity of the reaction system. The concentrations of the metal ions were 125 μM. F0 represents the fluorescence intensity of the solution of CDs without the addition of metal ions, and F represents the fluorescence intensity of the mixed solution after the addition of the metal ions. The experimental results indicate that the fluorescence of CDs could be specifically quenched by Fe3+. In contrast, other metal ions had little influence on the fluorescence intensity of the CDs. Although the fluorescence intensities of the CDs were slightly reduced in the presence of some metal ions, the degrees of reduction were all very weak.This binding mechanism, which the as-prepared CDs have specific binding ability with Fe3+, was most likely because of the presence of hydroxyl and carboxyl functional groups on the surface of the CDs. It is known that Fe3+ is able to coordinate with hydroxyl groups on edges of CDs and the binding constant of Fe3+ with hydroxyl is higher than other metal ions,52–54 so we supposed that Fe3+ binding with hydroxyl groups on the surface of CDs to form metal hydroxides or other complexes, resulting in the aggregation of CDs. It is well known, Fe3+ is easily hydrolyzed even in acidic solution.55,56 The aggregation of CDs, which resulted in fluorescence quenching, might be caused by the hydrolysis of Fe3+. In order to investigate the hydrolysis effect for the detection of Fe3+, the pH response of CDs was explored. As Fig. S4† shown, the CDs had high stability against pH variation in the range of 3–12. Moreover, as illustrated in Fig. S5 and S6,† Fe3+ hydrolysis has no obvious effect on sensing experiments in HAc–NaAc buffer with pH 3.2. To further investigate the sensing mechanism, we tested fluorescence lifetime of CDs before and after addition of Fe3+. As Fig. S7† shown, fluorescence lifetime of CDs had no obvious decreased upon addition of Fe3+. It was demonstrated that fluorescence quenching of CDs caused by the aggregation of CDs upon addition of Fe3+, instead of electron transfer or fluorescence resonance energy transfer. As Fig. S8† shown, the average size of the as-prepared CDs increased from 5.6 nm to 13.8 nm when Fe3+ ions have interacted with CDs. It was indicated that the aggregation of CDs have taken placed, resulting in fluorescence quenching of the CDs.
Detection of the concentration of Fe3+
It is noticeable that Fe3+ can induce the fluorescence quenching of CDs, which can be used to detect Fe3+. As Fig. 5b shown, the fluorescence intensity of the CDs decreased with increasing the concentration of Fe3+ when Fe3+ was added to the system. This was because of the interactions between Fe3+ and the hydroxyl groups on the surface of CDs as they were added to the system, which resulted in the aggregation of CDs and thus in the fluorescence quenching. In addition, for concentrations of Fe3+ in the range of 0.5–4 μM, when the Fe3+ concentration increased, the degree of fluorescence quenching increased, and there was a good linear relationship (inset figure in Fig. 5b). F0 represents the fluorescence intensity of the CDs without the addition of Fe3+, and F represents the fluorescence intensity of the mixture after the addition of Fe3+. The linear regression equation was F/F0 = 0.998 − 0.037c (regression coefficient R2 = 0.998), and the detection limit (3σ) was calculated to be 0.38 μM.Conclusions
In this work, Bombyx mori silk was selected as the raw material, and nitrogen-doped blue fluorescent CDs that had high quantum yield were synthesized using a one-step hydrothermal method. The method was mild, environmental friendly, and economical. The obtained CDs showed the characteristics of nitrogen doping and exhibited excellent optical properties and good stability. In addition, the CDs can maintain photostability in the presence of strong acid or base, high salt concentrations, and most organic solvents. Based on the interaction between Fe3+ and the hydroxyl groups on the surface of CDs, Fe3+ ions can induce fluorescence quenching of the CDs, thus making the CDs a luminescent probe for selective and sensitive detection of Fe3+ ions.Conflicts of interest
There are no conflicts to declare.Acknowledgements
This work was financially supported by the National Natural Science Foundation of China (NSFC, No. 21535006, No. 21705132), Chongqing Research Program of Basic Research and Frontier Technology (No. cstc2017jcyjAX0060), as well as the Fundamental Research Funds for the Central Universities (XDJK2017C065, XDJK2017B056).Notes and references
- X. Xu, R. Ray, Y. Gu, H. J. Ploehn, L. Gearheart, K. Raker and W. A. Scrivens, J. Am. Chem. Soc., 2004, 126, 12736–12737 CrossRef CAS PubMed.
- S. Y. Lim, W. Shen and Z. Gao, Chem. Soc. Rev., 2015, 44, 362–381 RSC.
- J. Zhou, Y. Yang and C. Y. Zhang, Chem. Rev., 2015, 115, 11669–11717 CrossRef CAS PubMed.
- Q. Xu, Y. Zhang, B. Tang and C. Y. Zhang, Anal. Chem., 2016, 88, 2051–2058 CrossRef CAS PubMed.
- U. Resch-Genger, M. Grabolle, S. Cavaliere-Jaricot, R. Nitschke and T. Nann, Nat. Methods, 2008, 5, 763–775 CrossRef CAS PubMed.
- S.-T. Yang, L. Cao, P. G. Luo, F. Lu, X. Wang, H. Wang, M. J. Meziani, Y. Liu, G. Qi and Y.-P. Sun, J. Am. Chem. Soc., 2009, 131, 11308–11309 CrossRef CAS PubMed.
- S. Zhu, Q. Meng, L. Wang, J. Zhang, Y. Song, H. Jin, K. Zhang, H. Sun, H. Wang and B. Yang, Angew. Chem., Int. Ed., 2013, 125, 4045–4049 CrossRef.
- G. Hong, S. Diao, A. L. Antaris and H. Dai, Chem. Rev., 2015, 115, 10816–10906 CrossRef CAS PubMed.
- C.-W. Lai, Y.-H. Hsiao, Y.-K. Peng and P.-T. Chou, J. Mater. Chem., 2012, 22, 14403–14409 RSC.
- S. Hamd-Ghadareh, A. Salimi, F. Fathi and S. Bahrami, Biosens. Bioelectron., 2017, 96, 308–316 CrossRef CAS PubMed.
- C. Lan, L. Zhang, B. Shi, D. Chen, L. Zhao and S. Zhao, J. Mater. Chem. B, 2017, 5, 5265–5271 RSC.
- A. Emam, S. A. Loutfy, A. A. Mostafa, H. Awad and M. B. Mohamed, RSC Adv., 2017, 7, 23502–23514 RSC.
- X. Huang, F. Zhang, L. Zhu, K. Y. Choi, N. Guo, J. Guo, K. Tackett, P. Anilkumar, G. Liu and Q. Quan, ACS Nano, 2013, 7, 5684–5693 CrossRef CAS PubMed.
- T. Feng, X. Ai, G. An, P. Yang and Y. Zhao, ACS Nano, 2016, 10, 4410–4420 CrossRef CAS PubMed.
- M. Zhang, N. Zhou, P. Yuan, Y. Su, M. Shao and C. Chi, RSC Adv., 2017, 7, 9284–9293 RSC.
- Z. X. Liu, B. B. Chen, M. L. Liu, H. Y. Zou and C. Z. Huang, Green Chem., 2017, 19, 1494–1498 RSC.
- S. Bhattacharyya, B. Konkena, K. Jayaramulu, W. Schuhmann and T. K. Maji, J. Mater. Chem. A, 2017, 5, 13573–13580 CAS.
- Q. Li, M. Zhou, Q. Yang, Q. Wu, J. Shi, A. Gong and M. Yang, Chem. Mater., 2016, 28, 8221–8227 CrossRef CAS.
- B. B. Chen, Z. X. Liu, W. C. Deng, L. Zhan, M. L. Liu and C. Z. Huang, Green Chem., 2016, 18, 5127–5132 RSC.
- M. M. Al Awak, P. Wang, S. Wang, Y. Tang, Y.-P. Sun and L. Yang, RSC Adv., 2017, 7, 30177–30184 RSC.
- M. Lin, H. Y. Zou, T. Yang, Z. X. Liu, H. Liu and C. Z. Huang, Nanoscale, 2016, 8, 2999–3007 RSC.
- T. Skaltsas, M. Goulielmaki, A. Pintzas, S. Pispas and N. Tagmatarchis, J. Mater. Chem. B, 2017, 5, 5397–5402 RSC.
- M. X. Gao, L. Yang, Y. Zheng, X. X. Yang, H. Y. Zou, J. Han, Z. X. Liu, Y. F. Li and C. Z. Huang, Chem.–Eur. J., 2017, 23, 2171–2178 CrossRef CAS PubMed.
- Y. H. Yuan, Z. X. Liu, R. S. Li, H. Y. Zou, M. Lin, H. Liu and C. Z. Huang, Nanoscale, 2016, 8, 6770–6776 RSC.
- M. Havrdova, K. Hola, J. Skopalik, K. Tomankova, M. Petr, K. Cepe, K. Polakova, J. Tucek, A. B. Bourlinos and R. Zboril, Carbon, 2016, 99, 238–248 CrossRef CAS.
- Z. Wang, P. Long, Y. Feng, C. Qin and W. Feng, RSC Adv., 2017, 7, 2810–2816 RSC.
- R. S. Li, P. F. Gao, H. Z. Zhang, L. L. Zheng, C. M. Li, J. Wang, Y. F. Li, F. Liu, N. Li and C. Z. Huang, Chem. Sci., 2017, 6829–6835 RSC.
- X. Gao, C. Ding, A. Zhu and Y. Tian, Anal. Chem., 2014, 86, 7071–7078 CrossRef CAS PubMed.
- J. Zhou, C. Booker, R. Li, X. Zhou, T.-K. Sham, X. Sun and Z. Ding, J. Am. Chem. Soc., 2007, 129, 744–745 CrossRef CAS PubMed.
- H. Liu, T. Ye and C. Mao, Angew. Chem., Int. Ed., 2007, 46, 6473–6475 CrossRef CAS PubMed.
- Y.-P. Sun, B. Zhou, Y. Lin, W. Wang, K. S. Fernando, P. Pathak, M. J. Meziani, B. A. Harruff, X. Wang and H. Wang, J. Am. Chem. Soc., 2006, 128, 7756–7757 CrossRef CAS PubMed.
- Y. Dong, R. Wang, H. Li, J. Shao, Y. Chi, X. Lin and G. Chen, Carbon, 2012, 50, 2810–2815 CrossRef CAS.
- J. Du, Y. Zhao, J. Chen, P. Zhang, L. Gao, M. Wang, C. Cao, W. Wen and C. Zhu, RSC Adv., 2017, 7, 33929–33936 RSC.
- S. Zhu, Q. Meng, L. Wang, J. Zhang, Y. Song, H. Jin, K. Zhang, H. Sun, H. Wang and B. Yang, Angew. Chem., Int. Ed., 2013, 52, 1–6 CrossRef.
- H. Tetsuka, R. Asahi, A. Nagoya, K. Okamoto, I. Tajima, R. Ohta and A. Okamoto, Adv. Mater., 2012, 24, 5333–5338 CrossRef CAS PubMed.
- B. Martindale, G. A. Hutton, C. A. Caputo, S. Prantl, R. Godin, J. R. Durrant and E. Reisner, Angew. Chem., Int. Ed., 2017, 56, 6459–6463 CrossRef CAS PubMed.
- Q. Xiao, Y. Liang, F. Zhu, S. Lu and S. Huang, Microchim. Acta, 2017, 184, 2429–2438 CrossRef CAS.
- N. C. Tansil, Y. Li, C. P. Teng, S. Zhang, K. Y. Win, X. Chen, X. Y. Liu and M.-Y. Han, Adv. Mater., 2011, 23, 1463–1466 CrossRef CAS PubMed.
- Z. L. Wu, P. Zhang, M. X. Gao, C. F. Liu, W. Wang, F. Leng and C. Z. Huang, J. Mater. Chem. B, 2013, 1, 2868–2873 RSC.
- Y. Choi, B. Kang, J. Lee, S. Kim, G. T. Kim, H. Kang, B. R. Lee, H. Kim, S.-H. Shim, G. Lee, O.-H. Kwon and B.-S. Kim, Chem. Mater., 2016, 28, 6840–6847 CrossRef CAS.
- D. Pan, J. Zhang, Z. Li, C. Wu, X. Yan and M. Wu, Chem. Commun., 2010, 46, 3681–3683 RSC.
- Y. Dong, J. Shao, C. Chen, H. Li, R. Wang, Y. Chi, X. Lin and G. Chen, Carbon, 2012, 50, 4738–4743 CrossRef CAS.
- L. Yang, W. Jiang, L. Qiu, X. Jiang, D. Zuo, D. Wang and L. Yang, Nanoscale, 2015, 7, 6104–6113 RSC.
- Y.-P. Sun, B. Zhou, Y. Lin, W. Wang, K. A. S. Fernando, P. Pathak, M. J. Meziani, B. A. Harruff, X. Wang, H. Wang, P. G. Luo, H. Yang, M. E. Kose, B. Chen, L. M. Veca and S.-Y. Xie, J. Am. Chem. Soc., 2006, 128, 7756–7757 CrossRef CAS PubMed.
- F. Zhang, X. Feng, Y. Zhang, L. Yan, Y. Yang and X. Liu, Nanoscale, 2016, 8, 8618–8632 RSC.
- S. Qu, X. Wang, Q. Lu, X. Liu and L. Wang, Angew. Chem., Int. Ed., 2012, 124, 12381–12384 CrossRef.
- D. Qu, M. Zheng, P. Du, Y. Zhou, L. Zhang, D. Li, H. Tan, Z. Zhao, Z. Xie and Z. Sun, Nanoscale, 2013, 5, 12272–12277 RSC.
- Y. Song, S. Zhu, S. Zhang, Y. Fu, L. Wang, X. Zhao and B. Yang, J. Mater. Chem. C, 2015, 3, 5976–5984 RSC.
- D. Qu, M. Zheng, L. Zhang, H. Zhao, Z. Xie, X. Jing, R. E. Haddad, H. Fan and Z. Sun, Sci. Rep., 2014, 4, 5294 CrossRef CAS PubMed.
- Y. Zhang, X. Liu, Y. Fan, X. Guo, L. Zhou, Y. Lv and J. Lin, Nanoscale, 2016, 8, 15281–15287 RSC.
- C. Sun, Y. Zhang, P. Wang, Y. Yang, Y. Wang, J. Xu, Y. Wang and W. W. Yu, Nanoscale Res. Lett., 2016, 11, 110 CrossRef PubMed.
- Q. Xu, P. Pu, J. Zhao, C. Dong, C. Gao, Y. Chen, J. Chen, Y. Liu and H. Zhou, J. Mater. Chem. A, 2015, 3, 542–546 CAS.
- K. Qu, J. Wang, J. Ren and X. Qu, Chem.–Eur. J., 2013, 19, 7243–7249 CrossRef CAS PubMed.
- J. Ju and W. Chen, Biosens. Bioelectron., 2014, 58, 219–225 CrossRef CAS PubMed.
- S. Musić, S. Krehula, S. Popović and Ž. Skoko, Mater. Lett., 2003, 57, 1096–1102 CrossRef.
- X. Hu, J. C. Yu, J. Gong, Q. Li and G. Li, Adv. Mater., 2007, 19, 2324–2329 CrossRef CAS.
Footnote |
| † Electronic supplementary information (ESI) available. See DOI: 10.1039/c7ra10130a |
| This journal is © The Royal Society of Chemistry 2017 |

