 Open Access Article
Creative Commons Attribution 3.0 Unported Licence
A one-step process for preparing a phenyl-modified g-C3N4 green phosphor with a high quantum yield†
Tianxiang Chen,
Chengcheng Chen,
Qiong Liu,
Zhengguo Zhang and
Xiaoming Fang *
*
Key Laboratory of Enhanced Heat Transfer and Energy Conservation, The Ministry of Education, School of Chemistry and Chemical Engineering, South China University of Technology, Guangzhou 510640, China. E-mail: cexmfang@scut.edu.cn; Fax: +86 20 87113870; Tel: +86 20 87112997
First published on 8th November 2017
Abstract
Herein a simple one-step process for preparing a g-C3N4-based green phosphor was presented, which just involved thermal polymerization of a single precursor, 2,4-diamino-6-phenyl-1,3,5-triazine, under an atmosphere of argon, to prepare phenyl-modified g-C3N4. The effects of the annealing temperature and time on the crystalline structure, chemical composition, morphology, optical absorption properties, and photoluminescence emission behavior of the obtained samples were investigated systematically. It was found that the phenyl-modified g-C3N4 prepared at 400 °C for 40 min exhibits strong green emission with a quantum yield of as high as 38.08%, comparable to those of the g-C3N4 nanoparticles and quantum dots obtained from the multi-step preparation and post-treatment processes. The emission spectrum of the phenyl-modified g-C3N4 sample can be fitted into four peaks centered at around 465, 490, 520 and 545 nm, suggesting that the phenyl-modified g-C3N4 phosphor possesses multi-fluorophores or luminescent species. The introduction of the phenyl groups leads to the decrease in band gap and thus the red shift in emission as compared with pristine g-C3N4. The simple preparation process along with high quantum yield make this phenyl-modified g-C3N4 green phosphor show great potential in practical applications.
1. Introduction
Graphitic carbon nitride (g-C3N4) is a metal-free polymeric semiconducting material, having the merits of a simple preparation process as well as good chemical stability.1–3 And it possesses a two-dimensional structure consisting of π-conjugated graphitic planes through the sp2 hybridization of carbon and nitrogen, and its electron structure is easy to tune via doping or modification.4,5 A relatively narrow band gap (∼2.7 eV) as well as suitable band positions make g-C3N4 a very promising visible light-driven photocatalyst for the photocatalytic production of hydrogen,6–8 degradation of pollutants9 and reduction of CO2,10 etc.Besides the aforementioned photocatalytic activity, the luminescent properties of g-C3N4 have attracted increasing research interest in recent years.11,12 Zhang et al.13 reported that ultrathin g-C3N4 nanosheets, obtained by the liquid exfoliation of bulk g-C3N4 prepared from melamine, exhibited a quantum yield of 19.6% and could be employed for bio-imaging. Moreover, they also prepared single-layered g-C3N4 quantum dots from bulk g-C3N4 through the sequential acid and NH3 treatments, followed by ultrasound, which can be applied in the two-photon fluorescence imaging of cellular nucleus.14 Zhou et al.15 found that, the quantum dots, prepared by the chemical cleavage of layered g-C3N4, exhibited a quantum yield of 46%, which could be used as a photoluminescent (PL) probe capable of detecting Fe3+. Guo et al.16 prepared a blue phosphor with a quantum yield of 11.8% through the treatment of pristine g-C3N4 with nitric acid and mixed it with copper-cysteamine to obtain a new white color composite; they found that the white LED fabricated using this white phosphor exhibited an excellent color rendering index of 94.3. Cui et al.17 prepared phenyl-modified g-C3N4 quantum dots by heating a complex of cyanuric acid and 2,4-diamino-6-phenyl-1,3,5-triazine in nitrogen atmosphere, followed by exfoliating the obtained yellow powder through simple ultrasonication in a water bath and the subsequent centrifugation to remove the residual big aggregates; they found that the obtained phenyl-modified g-C3N4 nanoparticles exhibited bright, tunable fluorescence, with a high quantum yield of 48.4% in aqueous colloidal suspensions. Xu et al.18 employed a supramolecular synthesized from cyanuric acid and 2,4-diamino-6-phenyl-1,3,5-triazine as the precursor, along with the doping with barbituric acid, to synthesize the g-C3N4 sample that exhibited a big redshift in PL emission extending to cyan region; but the solid phosphor showed a low quantum yield of 17.9%. All those researches suggest that the g-C3N4-based phosphors show promise for use in various fields including bioimaging, photoluminescent probing, white LEDs, and so on, and their quantum yields can be improved by transforming bulk g-C3N4 into quantum dot, nanoparticles and nanosheets through several strategies including liquid exfoliation, ultrasonication and chemical treatments, etc. However, those preparation as well as improvement routes suffer from multiple-step procedures, and only the suspensions containing g-C3N4 nanoparticles or quantum dots have achieved high quantum yields of more than 30%. Therefore, it is highly needed to explore a simple route for preparing g-C3N4-based solid phosphors with high quantum yields.
In the current work, a simple one-step process for preparing a g-C3N4-based green phosphor was presented, which just involved annealing single precursor, 2,4-diamino-6-phenyl-1,3,5-triazine, to prepare a phenyl-modified g-C3N4 (PhCN). The effects of the annealing temperature and time on the crystalline structure, chemical composition, morphology, optical absorption property and PL emission behavior of the obtained samples were investigated systematically, and thus the optimal process conditions for preparing the PhCN phosphor with a high quantum yield was obtained. Furthermore, the PL emission mechanism of the PhCN was elucidated. It is found that the PhCN phosphor prepared by annealing the precursor at 400 °C for 40 min exhibits strong green mission with a quantum yield of as high as 38.08%.
2. Experimental section
2.1. Materials synthesis
The raw material 2,4-diamino-6-phenyl-1,3,5-triazine were obtained from commercial sources and were used without further purification. 8 g of 2,4-diamino-6-phenyl-1,3,5-triazine (analytical grade) was put into a quartz boat, and then the boat was placed into the central region of a quartz tube furnace, followed by being heated to a designed temperature and kept for a certain time under an atmosphere of purity argon (99.999%). After cooling down, the product was grinded into fine powder to obtain a PhCN sample. In order to investigate the effect of the annealing temperature on the structure and properties of the products, several different PhCN samples were prepared by the annealing temperatures of 380, 400, 420, 450 and 480 °C, respectively, with the duration fixed at 120 min. Moreover, another series of samples were obtained at the annealing temperature of 400 °C for the times of 20, 40, 60, 120 and 240 min, respectively, with the purpose of investigating the impact of the annealing time.2.2. Characterizations
Power X-ray diffraction (XRD) patterns were acquired form a Bruker D8 Advance X-ray diffractometer with Cu Kα1 radiation (λ = 1.5418 Å). The infrared absorption spectra were obtained from a Vector 33 Fourier transform infrared (FT-IR) spectrometer. The element analysis (EA) results were obtained using a Vario EL cube Elementar. The morphologies and microstructures of the samples were observed using a Hitachi UHR FE-SEM 8220 scanning electron microscopy (SEM) instrument. Ultraviolet-visible (UV-vis) diffuse reflection spectra (DRS) were obtained in the wavelength range of 200–800 nm with a Hitachi U-3010 spectrophotometer.Photoluminescence (PL) spectra of the samples were obtained at room temperature using a Hitachi F-7000 Fluorescence spectra equipped with a solid sample holder, and all the excitation and emission slit was 5 nm and the PMT voltage was 200 V. Photoluminescence quantum yield was determined by Edinburgh Instrument FLS980 spectrometer at an excitation wavelength of λ = 365 nm with an integrating sphere. The temperature-dependent and time-resolved PL spectra of PhCN were obtained from a PTI steady-state & time-resolved fluorescence spectrofluorometer equipped with temperature-control components.
3. Results and discussion
3.1. Effect of annealing temperature
Fig. 1a shows XRD patterns of the precursor and the samples prepared at different annealing temperatures. It is obvious that the XRD patterns of the products are quite different from that of the precursor, indicating the occurrence of the thermal polymerization. And all the products exhibit the diffraction peak located at around 27°, which can be ascribed to the interlayer (002) diffraction of graphitic-like structures. Besides, as displayed in Fig. 1b, one diffraction peak centered at 16.6° is observed for the sample prepared at 380 °C, while a broad peak from 12° to 16° is found for all the other ones prepared at 400–480 °C. It is suggested that the sample obtained at 380 °C may exist some differences from the ones prepared at 400–480 °C. Furthermore, the broad one seems to be composed of two peaks, centered at around 13° and 15° (Fig. 1b), respectively, the former of which is attributed to the (100) plane of g-C3N4,2 and the latter one may related to the phenyl groups in the samples.13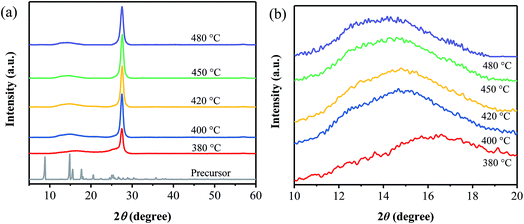 | ||
| Fig. 1 XRD patterns of the samples prepared at different temperatures, together with that of the precursor. | ||
Fig. 2 shows FT-IR spectra of the samples prepared at different temperatures, together with that of the precursor. Obviously, the FT-IR spectrum of the precursor is quite different from those of the products, in which the stretching vibration of the phenyl group is shifted from 1624 cm−1 for the precursor to 1629 cm−1 for the products. It is verified that the thermal polymerization happened to the precursor.19 Furthermore, several strong bands are observed in the 1200–1600 cm−1 region for all the products, which correspond to the typical stretching modes of the CN heterocycle.20 However, the product prepared at 380 °C shows some differences in the wavenumber range between 850 and 750 cm−1 from the ones obtained at 400–480 °C. Specifically, a sharp peak at 809 cm−1, corresponded to the C–N stretching vibration of the characteristic mode of the tri-s-triazine cycles,21,22 appears in all the FT-IR spectra of the samples prepared at 400–480 °C, while it is not clearly observed in that of the sample obtained at 380 °C. These results suggest that the sample prepared at 380 °C does not consist of the typical heptazine rings. In addition, the SEM images of the precursor and the samples prepared at different temperatures are displayed in Fig. S1.† The precursor presents flower-like aggregates consisting of sheets, and it changes into sphere particles after being heated at 380 °C for 40 min. For the two samples obtained at 400 and 420 °C, they show similar layer-like aggregates consisting of small sheets and pores. Based on the above results it can be inferred that, the annealing temperature should be controlled at the temperatures of more than 380 °C for obtaining the phenyl modified g-C3N4. Note that pristine g-C3N4 are usually prepared at the temperatures of more than 500 °C.2,3 It is revealed that the phenyl modified g-C3N4 can be prepared at lower temperatures as compared with pristine g-C3N4. The reason for the decrease in the temperature for the thermal polymerization may be attributed to the replacement of the terminal amino groups with the phenyl groups, which enhances the conjugated structure and thus leads to the thermal polymerization taking place at lower temperatures.18
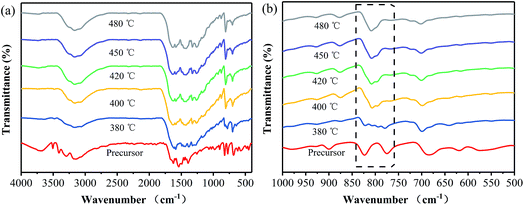 | ||
| Fig. 2 FT-IR spectra of the samples prepared at different temperatures, together with that of the precursor. | ||
The chemical compositions of the precursor and the products have been obtained from elemental analysis, as listed in Table S1.† It can be seen that the C/N molar ratios vary from 1.53 for the precursor to 1.26 for the sample prepared at 380 °C and 0.92–0.82 for the ones obtained at 400–480 °C. The high C/N molar ratio of 1.26 further confirms that this sample does not consist of the typical heptazine rings. Compared to pristine g-C3N4 with a C/N ratio of 0.75, all the products prepared at 400–480 °C exhibit the increased C/N ratios. The reasons for this can be explained as follows. On one hand, the phenyl groups existing in the products makes an increase in the C/N ratio, owing to its nonparticipation in the formation of heptazine.19 On the other hand, the samples prepared at the temperatures ranging from 400 to 480 °C consist of the tri-s-triazine units with lower polymerization degree,3 as illustrated in Scheme S1,† compared with pristine g-C3N4 that are usually prepared at the temperatures of more than 500 °C. Note that lower polymerization degree results in high C/N ratios. Moreover, a gradual decrease in the C/N ratio from 0.92 to 0.85 and 0.82 appears as the annealing temperature is increased from 420 °C to 450 °C and 480 °C, which originates from the increase in polymerization degree with the annealing temperature.
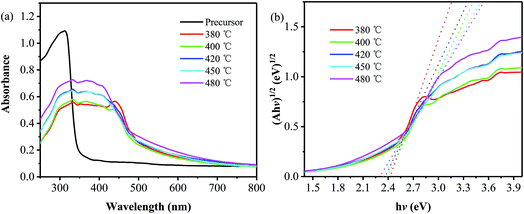
The UV-vis diffuse reflectance absorption spectra of the precursor and the samples obtained at different temperatures are shown in Fig. 3a. Compared with the precursor that exhibits an absorption edge at around 350 nm, all the products show an obvious red shift in absorption edge, suggesting the quite difference in electronic structure between the products and the precursor.2,23 Moreover, an obvious absorption peak located at around 440 nm is observed on the absorption spectrum of the sample obtained at 380 °C, and it decreases and then disappears as the annealing temperature is increased to 400 and 420 °C, which is caused by an increase in the layer number and thus a decrease in the n–π* transition.24,25 Furthermore, in order to obtain the bandgaps of the products, their corresponding (Ahv)1/2 versus the photon energy (hv) have been plotted,26 as shown in Fig. 3b. It is found that the bandgap values are 2.38, 2.37, 2.34 and 2.30 eV for the samples prepared at 400, 420, 450 and 480 °C, respectively, all of which are smaller than that of pristine g-C3N4 (∼2.7 eV).2 The reason for the narrowed band gap can be attributed to the introduction of phenyl groups, which extends the 2D electron delocalization in the PhCN samples.24 And the gradual decrease in band gap is related to the increase in the polymerization degree and the system π-conjugation with the annealing temperature,19 as described from the aforementioned XRD and SEM results.
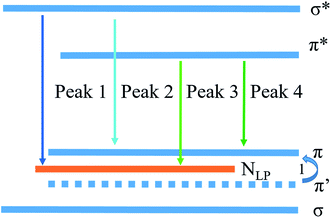
The excitation spectra of the precursor and the products have been detected under the emission wavelengths of 440 nm and 520 nm, respectively, as shown in Fig. 4a. All the products obtained at different temperatures exhibit broad excitation bands ranging from 300 to 500 nm with centers at around 370 nm, and their intensities decrease with the increase in the annealing temperature. Consequently, the emission spectra of all the products have been measured under an excitation wavelength of 365 nm and are also shown in Fig. 4a. It is obvious that all the products prepared from the precursor exhibit green emission and a redshift, compared with the emission of precursor. This redshift is contributed to the narrowed bandgap, which are mainly caused by the increase in the polymerization degree and the system π-conjugation with the annealing temperature. Moreover, their emission intensity decreases with the increase in the annealing temperature. In order to elucidate the emission behavior of the samples prepared from the precursor via the one-step thermal polymerization, Gaussian fitting has been carried out on all the products. It is found that the emission spectra of the samples obtained at different temperatures can be fitted into four peaks, centered at 465, 490, 520 and 545 nm,27–30 respectively, as displayed in Fig. 4b. The first peak centered at 465 nm can be attributed to the transition between the σ* conduction band and the lone pair (LP) valence band, formed through the LP electron of the nitride valence band.27 The second one centered at 490 nm is indexed to the transition between the σ* conduction band and the π valence band,28 which may take place between the bridge N atoms and the tri-s-triazine. Note that the introduction of phenyl groups into the structure of g-C3N4 makes a decrease the energy level of π orbitals along with an enhancement in the rigidity of the tri-s-triazine structure, thus making the transition of σ*–π possible. Peak 3 is caused by the transition released from π* conduction band to LP valence band.29 Peak 4 is attributed to the transition between π* conduction band and π valence band.28,30 Apparently, both Peak 3 and Peak 4 contribute to the green emission of the PhCN samples. Compared with pristine g-C3N4 that usually shows a blue emission peak centered at 450 nm, the samples developed in this work exhibit green emission, owing to their narrowed band gaps, as revealed from Fig. 3. The introduction of the phenyl groups enhances the π-conjugation of g-C3N4 skeleton structure, which leads to the decrease in band gap and thus the red shift in emission.19,28
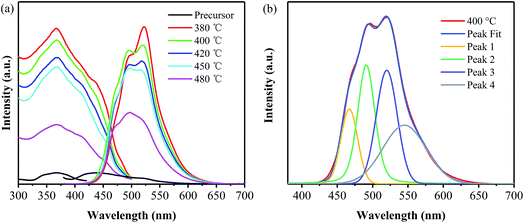 | ||
| Fig. 4 (a) PL spectra of the samples prepared at different temperatures and (b) the corresponding Gaussian fitting of the one obtained from 400 °C. | ||
Moreover, the absolutely photoluminescence quantum yield (AQY) of the PhCN samples prepared at the annealing temperatures ranging from 400 to 480 °C has been measured, and the obtained values are listed in Table 1. The sample prepared at 400 °C exhibits a AQY of 22.77%, larger than 17.9% of the solid phosphor prepared from a supramolecular of cyanuric acid and 2,4-diamino-6-phenyl-1,3,5-triazine as the precursor along with barbituric acid as the dopant.18 The high AQY of the sample developed in this work may be related to its low annealing temperature of 400 °C. As described above, the increase in the annealing temperature leads to the increases in the polymerization degree of the products along with the extending of the electron delocalization, which result in the overlaps of orbits.31 A bigger overlap of the σ* and π* antibonding states accounts for the decrease in emission intensity with the annealing temperature.28 And the PhCN sample obtained at lower annealing temperatures consists of the layers with less numbers, which favors the recombination of hole–electron.24 As illustrated by the FT-IR and SEM results, the sample obtained at 380 °C has been revealed not to possess a typical carbon nitride structure, and thus 400 °C is taken as the optimal annealing temperature for preparing PhCN with high AQY.
| Annealing temperature (°C) | 400 | 420 | 450 | 480 |
| AQY (%) | 22.77 | 21.13 | 17.99 | 10.72 |
3.2. Effect of annealing duration
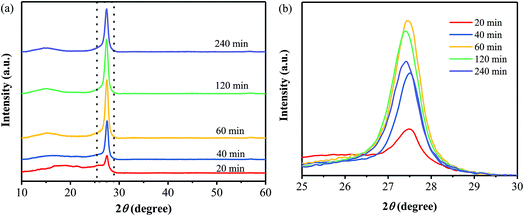
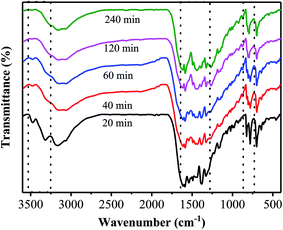
Several samples have been prepared from the precursor by annealing at 400 °C for different times, and their XRD patterns are shown in Fig. 5. When the precursors has been treated at 400 °C for only 20 min, the obtained product does not show an obvious diffraction peak of the (100) plane as well as a sharp diffraction peak of the (002) plane. It is suggested that the samples obtained at the annealing time of 20 min does not consist of the typical carbon nitride structure. For the other samples obtained at the annealing times of 40–240 min, they all exhibit the two typical diffraction peaks, which are corresponding to the (100) plane of g-C3N4 and the interlayer (002) diffraction of graphitic-like structures, respectively. And the intensity of the (002) diffraction peak increased with the annealing time extending from 40 to 120 min, representing the enhancement in crystallinity. While, a decrease in the intensity of the (002) diffraction peak is observed with a further increase in the annealing time from 120 to 240 min, suggesting the destroying of the crystalline structure by the thermal treatment for a too long time.32Fig. 6 shows FT-IR spectra of the samples prepared at 400 °C for different annealing times. One can see that the FT-IR spectrum of the sample obtained from the annealing for 20 min shows two obvious peaks located at the range of 3250–3550 cm−1, which originate from the primary amine in the precursor. The presence of the primary amine suggests that the precursor has not been completely transformed into PhCN through the thermal treatment only for 20 min, which is in good agreement with the XRD results. Moreover, the sample prepared by the annealing for 20 min exhibits two strong bands located at 825 cm−1 and 780 cm−1, which are corresponding to the characteristic features of triazine units;23,33 while, as the annealing time is increased to 40 min, these two bands disappear, and another band at around 807 cm−1 appears, indicating the formation of heptazine rings. In addition, several bands in the 1200–1600 cm−1 region are observed for all the samples, corresponding to the typical stretching modes of carbon nitride heterocycles.23
The morphology transformation with the annealing time from the precursor to the products is illustrated in Fig. S3.† After being heated at 400 °C for 20 min, the precursor, big flower-like aggregates composed of thickness sheets, changed into the product consisting of lots of small aggregates composed of thin layers. As the annealing time is increased to 40 min, the obtained sample majorly consists of small particles with sizes of 100–300 nm, along with a few of layer blocks. For the sample obtained from the annealing for 60 min, it mainly consists of layer blocks with different sizes, whose sizes are quite smaller than those of the sample prepared by the annealing for 120 min (Fig. S1c†). These results reveal that, the PhCN sample consisting of small particles can be obtained from the thermal polymerization of the precursor for the time of less than 60 min, and the aggregation of the layer blocks occurs as the annealing time is more than 60 min.
The C/N molar ratios of the samples obtained at different annealing times have been obtained and are listed in Table S3.† When the annealing time is 20 min, the C/N ratio is as high as 1.42, close to 1.53 of the precursor, suggesting the incomplete transformation of the precursor through the annealing at 400 °C only for 20 min. As the time is increased to 40 min, the C/N ratio remarkably decreases from 1.42 to 1.18, implying the formation of PhCN. A gradual decrease in the C/N ratio is observed with the further increase in the annealing time from 40 to 240 min, which is attributed to the increase in polymerization degree with the annealing time.
Fig. 7a shows UV-vis diffuse reflectance absorption spectra of the samples prepared at 400 °C for different times. At the wavelengths of less than 400 nm, a gradual increase in absorbance with the annealing time is observed, suggesting an increase in the UV-light harvesting ability. And an absorption peak at round 438 nm is found for all the samples, which is related to the fact that all the samples have been prepared at the annealing temperature of 400 °C; the lower temperature for the thermal polymerization of the precursor results in the samples consisting of less layer number and thus leads to the occurrence of the n–π* transition.24 In the wavelength range of more than 500 nm, an obvious increase in absorption is found for the two samples prepared by the annealing for 120 and 240 min, which is related to the colors of the two samples. It is found that the colors of these two samples are darker than those of the other ones obtained from the annealing for shorter duration. Furthermore, the bandgap of all the samples have been obtained, as displayed in Fig. 7b. The bandgap values are 2.44, 2.42, 2.40, 2.38 and 2.33 eV for the samples obtained from the annealing of 400 °C for 20, 40, 60, 120 and 240 min, respectively, all of which are smaller than that of pristine g-C3N4 (∼2.7 eV). The gradual decrease in band gap can be attributed to the increase in the polymerization degree and the packing of layer structure with the annealing time,2,23 as described from the aforementioned XRD and SEM results.
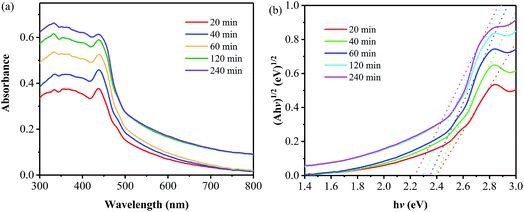 | ||
| Fig. 7 Absorption (a) and Kubelka–Munk transformed reflectance spectra and estimated optical absorption bandgap (b) of the samples prepared at 400 °C for different annealing times. | ||
The excitation spectra of the samples have been measured under the emission wavelength at 520 nm, as shown in Fig. 8a. It is clearly shown that, all the samples exhibit broad excitation bands ranging from 300 to 500 nm with their peaks located at around 365 nm. Consequently, the emission spectra of these samples have been obtained at the excitation wavelength of 365 nm and are also displayed in Fig. 8a. It is indicated that the emission intensity decreases with the increase in the annealing time. Furthermore, Gaussian fitting has been conducted on all the samples, and some of them are displayed in Fig. 8(b–d). The PL emission spectra of all the samples can be also fitted into four peaks, which are centered at 465, 490, 520 and 545 nm, respectively. And the area of each fitted peak has been obtained for all the samples, as listed in Table S3.† It can be seen that the area of Peak 1 for the sample prepared at 400 °C for 240 min is much less than those for the other samples, suggesting that the transition between the σ* conduction band and the lone pair (LP) valence band has been greatly decreased for this sample. The reason for this may be related to the decrease of dangling amino, as the prolonging annealing duration. As a result, the decrease of lone pair electron results in weaker transition.28 For Peak 2, the sample obtained for 20 min exhibits the largest area, while the one prepared for 240 min exhibits the least one; and the area values of the other three samples are comparable to each other. Note that Peak 2 is ascribed to the transition between the σ* conduction band and the π valence band. It is revealed that the long duration results in the higher degree of disorder structure and thus the increase in the electron delocalization,24 leading to the overlap of σ* and π* conduction band and thus the weaker transition.28 Moreover, a decrease in the area of Peak 3 with the annealing time is observed, suggesting the transition from π* conduction band to LP valence band gradually reduces with the increase in the annealing time. For Peak 4, its area values for the two samples prepared for 120 and 240 min are less than those for the ones obtained for 20, 40 and 60 min. As described above, the increase in the annealing time leads to the increases in the aggregation of the layer blocks, which may result in the extending of the electron delocalization26,34 and thus the overlaps of orbits.31 As a result, the transition between π* conduction band and π valence band reduces as the annealing time is as long as 120 and 240 min.
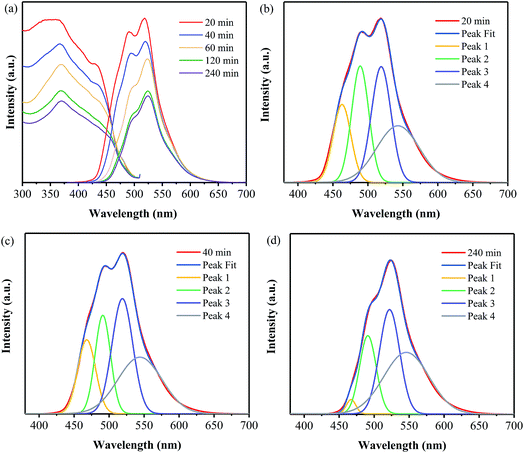 | ||
| Fig. 8 PL spectra (a) and Gaussian fitting of the PL spectra of the samples prepared at 400 °C for 20 min (b), 40 min (c), and 240 min (d). | ||
In addition, the AQY of the PhCN samples prepared at 400 °C for different annealing times has been detected under the excitation at 365 nm, as listed in Table 2. Significantly, when the annealing time is controlled to be 40 min, the obtained sample exhibits a AQY of as high as 38.08%, which is comparable to those of the g-C3N4 nanoparticles and quantum dots obtained from the multi-step processes,15,17,35 as summarized in Table S4.† And a gradual decrease in AQY with the annealing time is found, consistent with their PL emission spectra.
| Annealing time (min) | 40 | 60 | 120 | 240 |
| AQY (%) | 38.08 | 27.05 | 22.77 | 19.80 |
3.3. Discussion
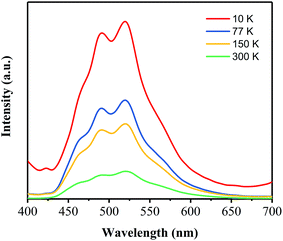
Based on the investigations on the effects of the annealing temperature and time, the optimal process conditions for preparing a green phosphor with high AQY has been obtained to be 400 °C 40 min−1. To get more insight into the dynamics of the electronic transitions for this green phosphor, the temperature-dependent and time-resolved PL analyses have been carried out on the PhCN sample prepared at 400 °C for 40 min.Fig. 9 shows the PL emission spectra of the PhCN sample measured at 10 K, 77 K, 150 K and 300 K under the excitation at 365 nm. At the low temperature (10 K), the sample exhibits the strongest PL emission and it is obvious that the intensity of the PL emission spectra decreases with the temperature rising from 10 K to 300 K, which is attributed to the increase of non-radiation. The non-radiation is mainly caused by the defect states in the PhCN and activated via the promoted thermal energy.30,36 Therefore, the decrease of non-radiation recombination at low temperatures provides a clear visualization of the four sub-peaks in the asymmetric PL spectra, which are centered at 465 nm, 490 nm, 520 nm and 545 nm, respectively. These results proves the correctness of the Gaussian fitting conducted on the PL spectra of the samples. It is implied that the PhCN phosphor possesses multi-fluorophores or luminescent species.37
The time-resolved PL spectra of the PhCN sample measured at different temperatures are displayed in Fig. 10a. The temperature dependent lifetime is in agreement with the temperature dependent PL, which is reduced sharply from 249.2 ns at 10 K to 18.7 ns at 150 K and then to 11.7 ns at 300 K. This nonlinear reduction illustrates that the PL relaxation dynamics becomes faster at high temperature, indicating the non-radiation rate (knr) is decreased, and the non-radiation dominates the relaxation process.11 As the monitored emission wavelength set as 545, 520, 491 and 466 nm, the lifetime is found to be 12.2, 11.7, 8.12 and 4.17 ns, respectively. Based on these results, it can be inferred that the transition between π* conduction band and π valence band is the main emission.
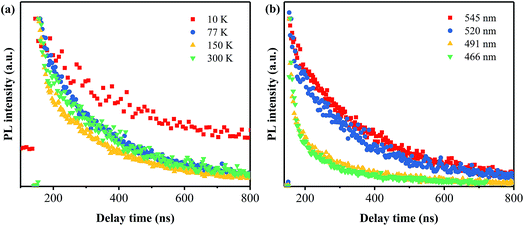 | ||
| Fig. 10 Time-resolved PL spectra of PhCN detected at different temperatures (a) and monitored at different emission wavelengths (b). | ||
For providing a good insight into the PL mechanism of the PhCN, a schematic diagram corresponding to the band gap states of PhCN is approximately illustrated in Fig. 11, based on the above analyses. The highest occupied molecular orbital (HOMO) states of this sample consist of the sp3 C–N σ band, the sp2 C–N and sp2 C–C π band and LP state of the nitride atom.30 The formation of NLP valence state is due to the reason that the lone pair electrons of nitride is not hybridization with the carbon atoms, which are located in the sp2 C–N π valence band.28,38,39 The process 1 is caused by the introduction of phenyl group into the CN structure, thus leading to the higher system π conjugation and the shift of π′ states to π.28 Therefore, the HOMO energy level is increased with increasing π-conjugated number, and thus the gap between π valence band and π* conduction band is decreased, thus lead to the red shift of PL spectra of PhCN.19
4. Conclusions
A simple one-step process has been explored for preparing the phenyl-modified g-C3N4 phosphor from single phenyl-containing precursor. Based on the investigations on the effects of the annealing temperature and time, it is shown that both the increases in the annealing temperature and time result in the gradual reduction in band gap and the decrease in PL emission intensity for the as-prepared samples. The optimal process condition has been determined to be 400 °C for 40 min, and under these conditions, the obtained PhCN sample exhibits strong green emission with a high absolutely photoluminescence quantum yield of 38.08%. It is revealed that this solid green phosphor shows four transition behaviors in the whole radiative recombination process, which are σ*–LP, σ*–π, π*–LP and π*–π transition, respectively. The green emission, high AQY and simple synthesis process make the PhCN phosphor show great promise in practical applications.Conflicts of interest
There are no conflicts to declare.Acknowledgements
This work was supported by the National Science Foundation of China (No. 60976053).References
- A. Y. Liu and M. L. Cohen, Science, 1989, 245, 841–842 CAS.
- X. Wang, K. Maeda, A. Thomas, K. Takanabe, G. Xin, J. M. Carlsson, K. Domen and M. Antonietti, Nat. Mater., 2009, 8, 76–80 CrossRef CAS PubMed.
- A. Thomas, A. Fischer, F. Goettmann, M. Antonietti, J. O. Muller, R. Schlogl and J. M. Carlsson, J. Mater. Chem., 2008, 18, 4893–4908 RSC.
- H. H. Liu, D. L. Chen, Z. Q. Wang, H. J. Jing and R. Zhang, Appl. Catal., B, 2017, 203, 300–313 CrossRef CAS.
- S. Guo, Z. Deng, M. Li, B. Jiang, C. Tian, Q. Pan and H. Fu, Angew. Chem., Int. Ed., 2016, 55, 1830–1834 CrossRef CAS PubMed.
- Q. Liu, Y. Guo, Z. Chen, Z. Zhang and X. Fang, Appl. Catal., B, 2016, 183, 231–241 CrossRef CAS.
- Q. Liu, T. Chen, Y. Guo, Z. Zhang and X. Fang, Appl. Catal., B, 2016, 193, 248–258 CrossRef CAS.
- R. Godin, Y. Wang, M. A. Zwijnenburg, J. Tang and J. R. Durrant, J. Am. Chem. Soc., 2017, 139, 5216–5224 CrossRef CAS PubMed.
- Y. Cui, Z. Ding, P. Liu, M. Antonietti, X. Fu and X. Wang, Phys. Chem. Chem. Phys., 2012, 14, 1455–1462 RSC.
- Y. Wang, J. Zhang, X. Wang, M. Antonietti and H. Li, Angew. Chem., Int. Ed., 2010, 49, 3356–3359 CrossRef CAS PubMed.
- M. Shalom, S. Inal, C. Fettkenhauer, D. Neher and M. Antonietti, J. Am. Chem. Soc., 2013, 135, 7118–7121 CrossRef CAS PubMed.
- Z. X. Gan, Y. Shan, J. R. Chen, Q. F. Gui, Q. Z. Zhang, S. P. Nie and X. L. Wu, Nano Res., 2016, 9, 1801–1812 CrossRef CAS.
- X. Zhang, X. Xie, H. Wang, J. Zhang, B. Pan and Y. Xie, J. Am. Chem. Soc., 2013, 135, 18–21 CrossRef CAS PubMed.
- X. Zhang, H. Wang, H. Wang, Q. Zhang, J. Xie, Y. Tian, J. Wang and Y. Xie, Adv. Mater., 2014, 26, 4438–4443 CrossRef CAS PubMed.
- Z. Zhou, Y. Shen, Y. Li, A. Liu, S. Liu and Y. Zhang, ACS Nano, 2015, 9, 12480–12487 CrossRef CAS PubMed.
- H. Y. Guo, J. Z. Y. Zhang, L. Ma, J. L. Chavez, L. Q. Yin, H. Gao, Z. L. Tang and W. Chen, Adv. Funct. Mater., 2015, 25, 6833–6838 CrossRef CAS.
- Q. Cui, J. Xu, X. Wang, L. Li, M. Antonietti and M. Shalom, Angew. Chem., Int. Ed., 2016, 55, 3672–3676 CrossRef CAS PubMed.
- J. S. Xu, M. Shalom, F. Piersimoni, M. Antonietti, D. Neher and T. J. K. Brenner, Adv. Opt. Mater., 2015, 3, 913–917 CrossRef CAS.
- Y. Ishida, L. Chabanne, M. Antonietti and M. Shalom, Langmuir, 2014, 30, 447–451 CrossRef CAS PubMed.
- Y. R. Guo, T. X. Chen, Q. Liu, Z. G. Zhang and X. M. Fang, J. Phys. Chem. C, 2016, 120, 25328–25337 CAS.
- Y. Zheng, L. Lin, X. Ye, F. Guo and X. Wang, Angew. Chem., Int. Ed., 2014, 53, 11926–11930 CrossRef CAS PubMed.
- Y. X. Zeng, C. B. Liu, L. L. Wang, S. Q. Zhang, Y. B. Ding, Y. Z. Xu, Y. T. Liu and S. L. Luo, J. Mater. Chem. A, 2016, 4, 19003–19010 CAS.
- B. Jurgens, E. Irran, J. Senker, P. Kroll, H. Muller and W. Schnick, J. Am. Chem. Soc., 2003, 125, 10288–10300 CrossRef PubMed.
- Y. Chen, B. Wang, S. Lin, Y. Zhang and X. Wang, J. Phys. Chem. C, 2014, 118, 29981–29989 CAS.
- V. N. Khabashesku, J. L. Zimmerman and J. L. Margrave, Chem. Mater., 2000, 12, 3264–3270 CrossRef CAS.
- Q. Han, B. Wang, J. Gao, Z. Cheng, Y. Zhao, Z. Zhang and L. Qu, ACS Nano, 2016, 10, 2745–2751 CrossRef CAS PubMed.
- Y. Iwano, T. Kittaka, H. Tabuchi, M. Soukawa, S. Kunitsugu, K. Takarabe and K. Itoh, Jpn. J. Appl. Phys., 2008, 47, 7842–7844 CrossRef CAS.
- Y. Zhang, Q. Pan, G. Chai, M. Liang, G. Dong, Q. Zhang and J. Qiu, Sci. Rep., 2013, 3, 1943 CrossRef PubMed.
- B. B. Wang, Q. J. Cheng, Y. A. Chen and K. Ostrikov, J. Appl. Phys., 2011, 110, 054323 CrossRef.
- D. Das, S. L. Shinde and K. K. Nanda, ACS Appl. Mater. Interfaces, 2016, 8, 2181–2186 CAS.
- Y. Wang, X. Wang and M. Antonietti, Angew. Chem., Int. Ed., 2012, 51, 68–89 CrossRef CAS PubMed.
- J. R. Ran, T. Y. Ma, G. P. Gao, X. W. Du and S. Z. Qiao, Energy Environ. Sci., 2015, 8, 3708–3717 CAS.
- J. R. Holst and E. G. Gillan, J. Am. Chem. Soc., 2008, 130, 7373–7379 CrossRef CAS PubMed.
- Y. C. Zhao, Z. Liu, W. G. Chu, L. Song, Z. X. Zhang, D. L. Yu, Y. J. Tian, S. S. Xie and L. F. Sun, Adv. Mater., 2008, 20, 1777–1781 CrossRef CAS.
- J. Zhou, Y. Yang and C. Y. Zhang, Chem. Commun., 2013, 49, 8605–8607 RSC.
- P. Yu, X. M. Wen, Y. R. Toh and J. Tang, J. Phys. Chem. C, 2012, 116, 25552–25557 CAS.
- X. Zheng, W. Qiao and Z. Y. Wang, RSC Adv., 2015, 5, 100736–100742 RSC.
- G. Fanchini, A. Tagliaferro, N. Conway and C. Godet, Phys. Rev. B, 2002, 66, 195415 CrossRef.
- B. B. Wang, Q. J. Cheng, L. H. Wang, K. Zheng and K. Ostrikov, Carbon, 2012, 50, 3561–3571 CrossRef CAS.
Footnote |
| † Electronic supplementary information (ESI) available. See DOI: 10.1039/c7ra09873a |
| This journal is © The Royal Society of Chemistry 2017 |

