
 Open Access Article
 This Open Access Article is licensed under a
 Creative Commons Attribution 3.0 Unported Licence
Graphene enhanced silicon/carbon composite as anode for high performance lithium-ion batteries
Xiaohui Li ,
Mengqiang Wu*,
Tingting Feng*,
Ziqiang Xu,
Jingang Qin,
Cheng Chen,
Chengyang Tu and
Dongxia Wang
,
Mengqiang Wu*,
Tingting Feng*,
Ziqiang Xu,
Jingang Qin,
Cheng Chen,
Chengyang Tu and
Dongxia Wang
School of Energy Science and Engineering, University of Electronic Science and Technology of China, Chengdu 611731, P. R. China. E-mail: mwu@uestc.edu.cn; fengtt@uestc.edu.cn
First published on 13th October 2017
Abstract
Silicon-based anode materials for lithium ion batteries (LIBs) have become a hot research topic due to their remarkably high theoretical capacity (4200 mA h g−1). However, the large volume change (>300%) of Si electrodes during the lithium ion insertion/extraction process leads to a rapid decay of the reversible capacity. In our report, carbon/graphene double-layer coated-silicon composite (Si/carbon/graphene, Si/C/G) is prepared via a facile hydrothermal process. It is demonstrated that the Si/C/G composite displayed an exceedingly ameliorated electrochemical performance in both cycling stability and rate capability. The specific capacity of the Si/C/G electrode is maintained at 2469 mA h g−1 after 50 cycles under 0.2 A g−1, and above 1500 mA h g−1 after 300 cycles at 2 A g−1. More notably, even at an ultrahigh rate of 32 A g−1, the specific capacity could still reach 471 mA h g−1. Hence the presented simple approach enables massive fabrication of the Si/C/G composite as a promising anode material for high performance LIBs.
1. Introduction
LIBs have attracted considerable attention in various energy storage applications, ranging from portable electronics to electric vehicles and aerospace engineering, due to the superior energy density and higher operating voltages over other rechargeable battery.1,2 As the most common material used for the anode of commercial LIBs, graphite has long cycle life, ample material supply and fairly low cost.3,4 Nevertheless, its relatively low specific capacity (372 mA h g−1) is gradually unable to meet the needs of high energy density application. Recently, multitudinous alternatives for the graphite anode have been investigated, within Si being one of the most promising material, since its theoretical specific capacity of 4200 mA h g−1 (Li22Si5) is 10 times higher than that of graphite.5 However, Si shows severe capacity decrease because of the large volume expansion/contraction in the process of lithium insertion/extraction.2 To solve the problem, lots of terrific struggle have been committed to the design of silicon nanostructure, which could display better ability to cope the volume expansion/contraction during the cycling process.6,7 While the low conductivity of silicon is another important cause. To promote its electrical conductivity, all sorts of conductive coating layers such as carbon, metal, metal oxide, conducting polymers and metal silicate have been introduced on the silicon surface,8–10 which has been proved an effective approach to ameliorate the conductivity of silicon and improve the overall electrochemical performance. Besides the high specific capacity, the rate capability of the electrode is also one of the most pivotal properties that should be examined, especially for high-power applications.11 There have been a few research studies which investigated the electrochemical properties of Si electrode at high charge/discharge rates. For instance, Wu et al.12 synthesized silicon oxide-coated Si tubes that can obtain 540 mA h g−1 at 20C. Cui et al.13 prepared an interconnected Si hollow nano sphere electrode displaying a discharge capacity of 1387 mA h g−1 at 14 A g−1, which is 57% of the capacity obtained at 0.44 A g−1. Wang et al.14 prepared the Si/C/G micro/nanocomposite that could reach 470 mA h g−1 at 5 A g−1.Herein, we designed a yolk–shell structure of carbon/graphene double-layer coated-silicon material to alleviate the serious structure crush and promote the intrinsic low electrical conductivity of silicon nanoparticles. Specifically, the inner carbon coating could enhance the surface electronic conductivity of silicon nanoparticles, while the outer layer of graphene sheets, which act as flexible and conductive bridges, could not only enhance the intergranular conductivity among silicon particles, but also provide an effective buffer space for the volume expansion of silicon and maintain the integrity of the electrode structure.15
2. Experimental
2.1. Materials
Si particles (100–200 nm) were obtained from the Shenzhen Kejing Star Technology Co. China. Acetonitrile (C2H3N) and glucose (C6H12O6, the Sinopharm Chemical Reagent Co., Ltd) were used as received.2.2. Sample preparation
![[thin space (1/6-em)]](https://www.rsc.org/images/entities/char_2009.gif) :1 were accurately weighed and grinded in an agate mortar. The mixed powders were transferred into a small amount of de-ionized water with vigorously stirring at 300 rpm for 1 h to form a homogeneously mixed slurry, which was then heated up to 90 °C for 12 h. The dried mixture was mashed and the resulting powders were finally put in a crucible for calcination in a nitrogen atmosphere at 600 °C (5 °C min−1) for 6 h to form Si/C particles.:1) were dispersed in ethanol and ultrasonically treated for 0.5 h to form a suspension. The compound suspension was transferred into a 100 ml PTFE-lined autoclave, and kept at 180 °C for 12 h in the vacuum oven. Upon the completion of the reaction, the autoclave underwent the natural cooling till room temperature. Afterwards, the suspension was transformed into a wet solid mixture in a refrigerator and followed by vacuum drying to obtain the final solid products.:1) and 0.1 g GO were dispersed in ethanol and ultrasonically treated for 0.5 h to form a suspension. Afterwards, the same processes for the preparation of Si/G composites was used to synthesize the Si/C/G (w/w = 10:1:1) composite.
:1 were accurately weighed and grinded in an agate mortar. The mixed powders were transferred into a small amount of de-ionized water with vigorously stirring at 300 rpm for 1 h to form a homogeneously mixed slurry, which was then heated up to 90 °C for 12 h. The dried mixture was mashed and the resulting powders were finally put in a crucible for calcination in a nitrogen atmosphere at 600 °C (5 °C min−1) for 6 h to form Si/C particles.:1) were dispersed in ethanol and ultrasonically treated for 0.5 h to form a suspension. The compound suspension was transferred into a 100 ml PTFE-lined autoclave, and kept at 180 °C for 12 h in the vacuum oven. Upon the completion of the reaction, the autoclave underwent the natural cooling till room temperature. Afterwards, the suspension was transformed into a wet solid mixture in a refrigerator and followed by vacuum drying to obtain the final solid products.:1) and 0.1 g GO were dispersed in ethanol and ultrasonically treated for 0.5 h to form a suspension. Afterwards, the same processes for the preparation of Si/G composites was used to synthesize the Si/C/G (w/w = 10:1:1) composite.2.3. Sample characterization
Si/C/G materials were characterized using X-ray diffraction (XRD, DX-1000) with Cu-Kα radiation. Field emission electron scanning microscope (SEM, JEOL JSM-5900LV) operated at 10 KV was used to observe the microstructure morphology and energy dispersive X-ray spectroscopy (EDX) was used to analyze the element mappings. TEM/HR-TEM images were taken on a JEOL JEM-2100F microscope. X-ray photoelectron spectroscopy (XPS) measurement was performed with a Kratos XSAM800 spectrometer using Mg Kα1,2 radiations.2.4. Electrochemical measurements
The electrochemical performance of the Si/C/G material was evaluated in 2032-type coin cells. The Si/C/G composite sample was mixed with conductive carbon black and carboxyl methyl cellulose (w/w = 60:20:20) to form a homogenous slurry. Ni foam cleaned with 2.0 M HCl solution was used as the current collector. The working electrodes were prepared by pasting the slurry onto the as-prepared Ni foam, and drying at 80 °C under vacuum oven for 5 h. Coin cells were assembled in an argon-filled glove box using lithium foil as the counter electrode, polypropylene film as the separator. The electrolyte was 1.0 M LiPF6 in 1:1 w/w ethylene carbonate/diethyl carbonate, with 1 volume% fluoroethylene carbonate added to improve the cycling stability. The battery was assembled in the order of “the positive electrode shell – electrode sheet – electrolyte – diaphragm – electrolyte – lithium plate – steel sheet – spring plate – negative housing”. All the cells were cycled between 0.01 and 3 V versus Li/Li+. Specific capacity values were calculated based on the total mass of the Si/C/G. The mass loading of active materials on the electrode was ranging from 0.6 mg to 1 mg (including Si, C and G).
3. Results and discussion
The schematic diagrams for the formation of Si/C/G materials are illustrated in Fig. 1a. Firstly, the pretreated Si nanoparticles and glucose were used as the starting material to prepare yolk–shell structured Si/C composite via a grinding/mixing and calcination process. The Si/C/G composite was further synthesized using Si/C and GO powders through a hydrothermal process. Fig. 2a–c shows the typical SEM image of Si, Si/C, Si/C/G composites, respectively. Obviously, there are many differences in morphology and brightly colored surfaced of the conductive Si/C/G show better. Fig. 2d shows the typical of TEM image, which clearly discloses that core–shell structure of Si/C/G material. High resolution TEM in Fig. 2e also confirms the highly crystalline characteristic of the Si nanoparticles, with a d-spacing of 0.32 nm.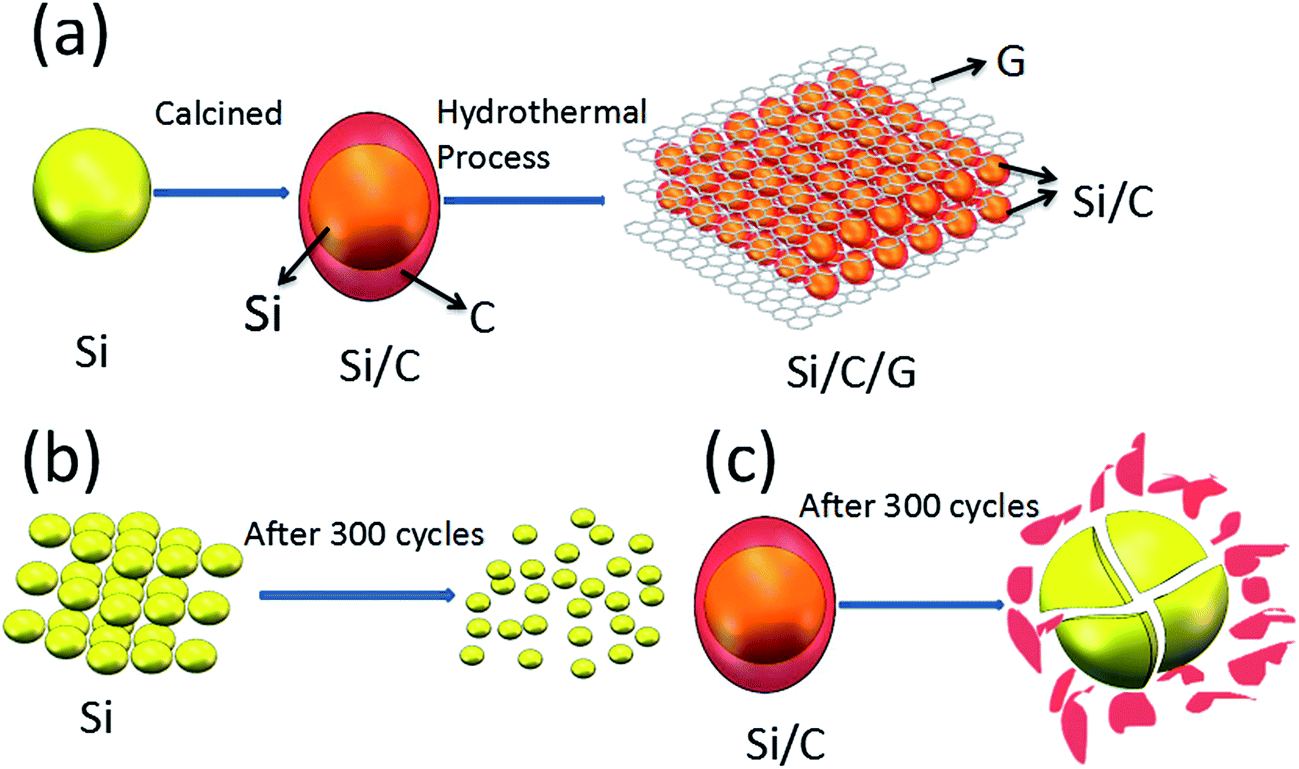 | ||
| Fig. 1 (a) Schematics illustration of the synthesis of the Si/C/G, (b) and (c) shows Si, Si/C structure changes of after many cycles. | ||
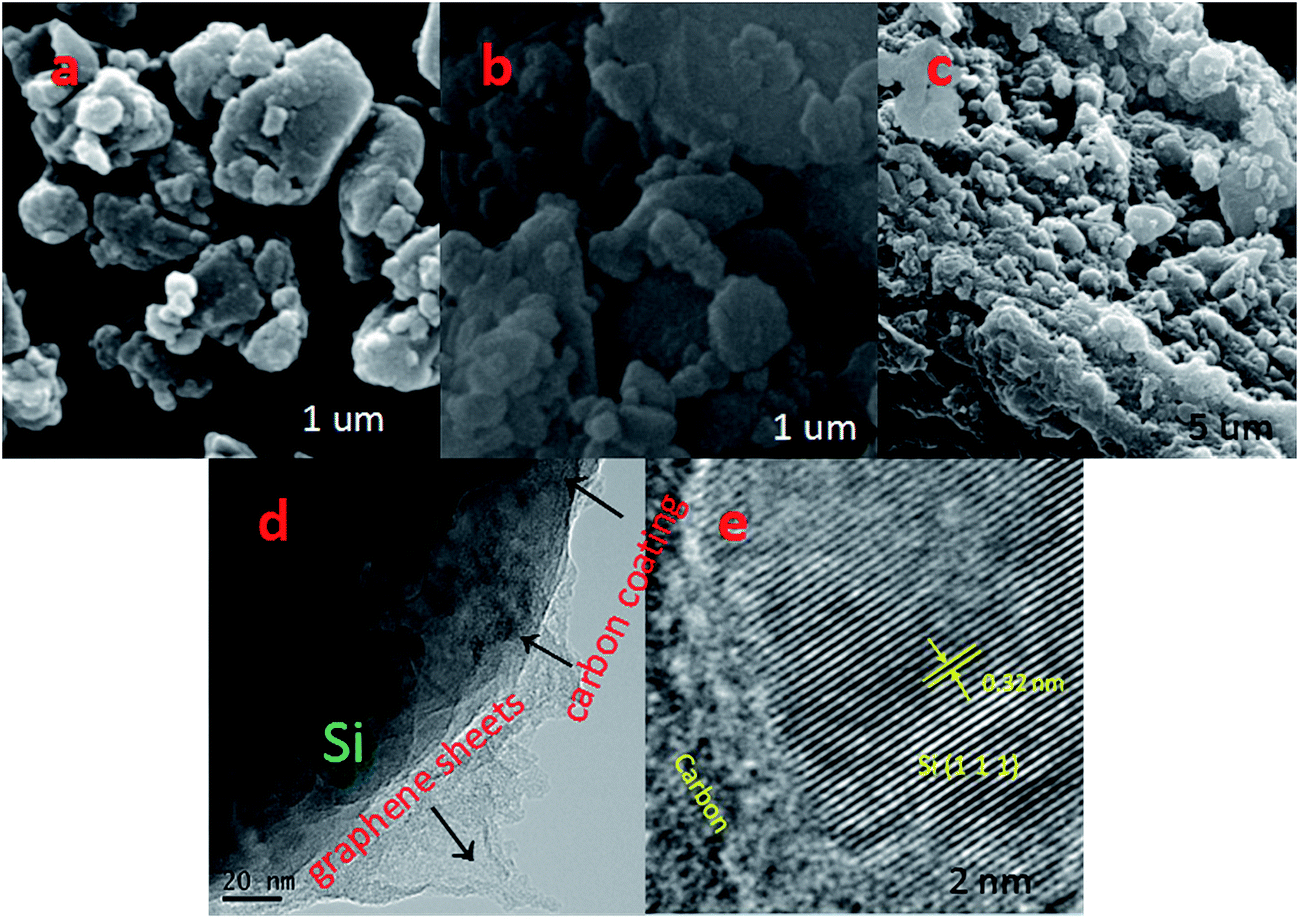 | ||
| Fig. 2 SEM images of (a) Si, (b) Si/C and (c) Si/C/G electrodes. (d) TEM and (e) HRTEM images of the Si/C/G materials. | ||
The structure of the prepared Si/C/G material was analyzed by X-ray diffraction (DX-1000). Fig. 3a presents the XRD patterns of the Si, Si/C and Si/C/G composites. In the XRD pattern of the as-obtained Si/C/G composite, the main diffraction peaks at 28.4°, 47.24°, 56.06°, 69.08° and 76.28° can be indexed as the (1 1 1), (2 2 0), (3 1 1), (4 0 0) and (3 3 1) planes of Si crystallites (JCPDS no. 27-1402), respectively. Compared with Si and Si/C, there are diffraction peaks at 23.48° with Si/C/G composite, indicating the carbon derived from the graphene oxide. Fig. 3b presents the Raman spectra of the Si/C/G composites. In the two spectra, the band located at 825 cm−1 corresponds to the crystalline Si, demonstrating the existence of active Si materials in all the obtained composites. In the Raman spectra of two composites, the characteristic peaks at around D (1360 cm−1) and G Bands (1604 cm−1) are known to depend on the structural nature of carbon. In contrast to Si/C composite, the bonds at about 2600 cm−1 relevant to the 2D peak of Si/C/G composite, which indicates the existence of graphitized carbon and multilayer structure.14,16–18 While the intensity ratio of D/G band is not very high, demonstrating few defects and excellent quality of rGO, in favor of applications in LIBs.
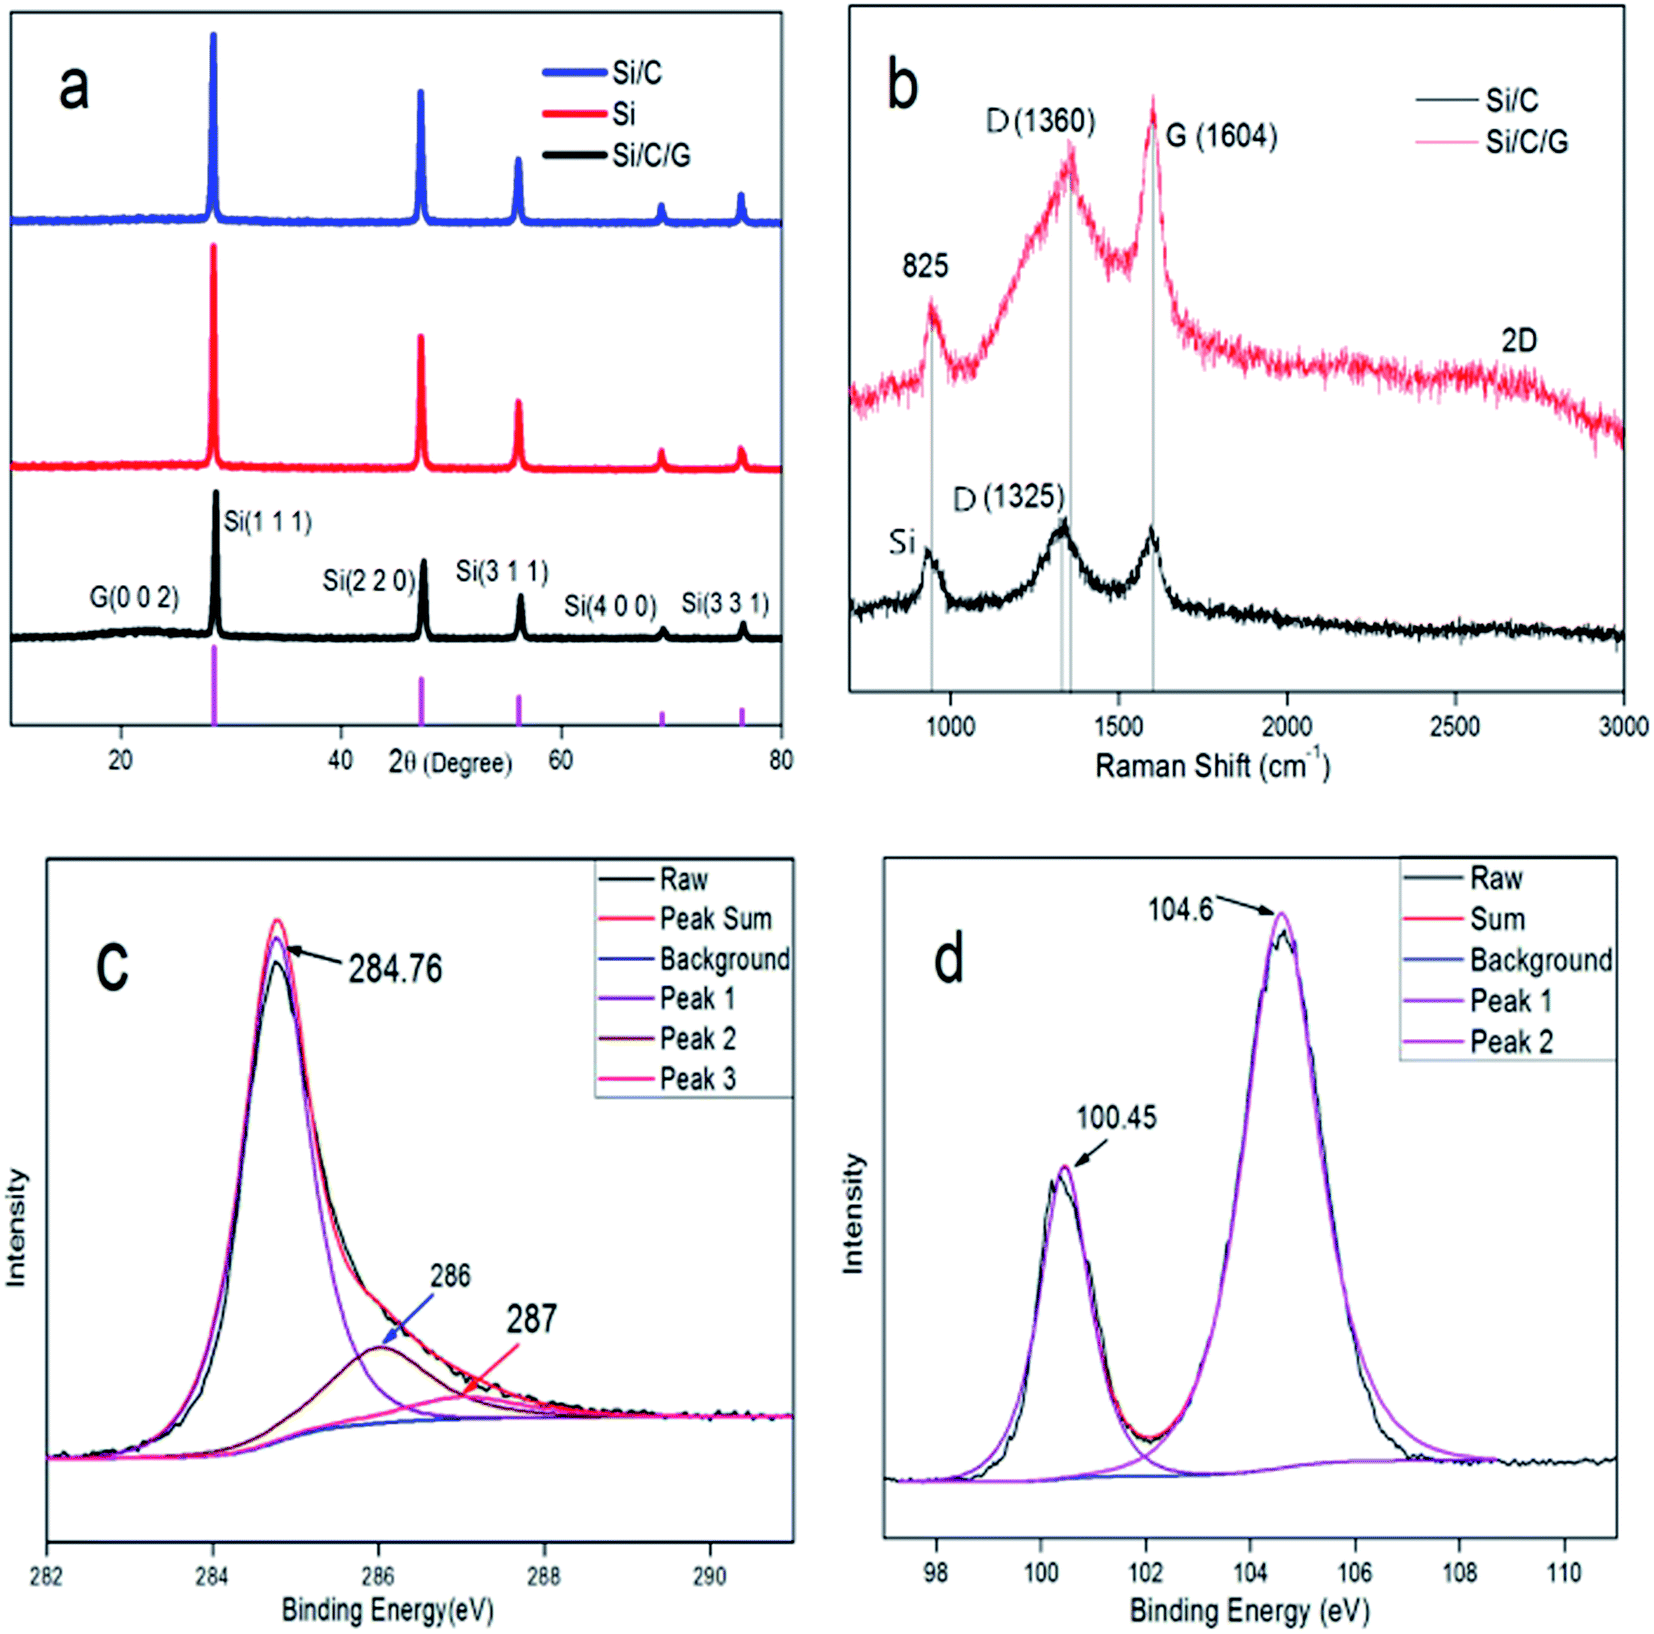 | ||
| Fig. 3 (a) XRD patterns of Si, Si/C and Si/C/G composites. (b) Raman spectra of the Si/C and Si/C/G composites. The XPS spectra (c) C 1s and (d) Si 2p of the Si/C/G composite. | ||
Fig. 3c presents the high-resolution X-ray photoelectron spectroscopy (XPS) spectra of C 1s with synthesized Si/C/G composite, illustrating the existence of three types of bonding forms for the carbon atoms in the Si/C/G composite. The observed peak at 284.7 eV should be corresponding to the carbon atoms in the chemical bonds of C–C. The other two peaks at 286 eV and 287 eV correspond that the carbon atoms in the functional groups of C-OR and COOR, individually. Three types of peaks came from two carbonaceous materials including graphitized carbon of graphene and amorphous carbon in glucose. Fig. 3d presents the XPS spectra of Si 2p. The peak at 100.45 eV and 104.6 eV is attributed to silicon powders and the silicon oxides, which indicates the Si/C/G composite was partially oxidized during the process of grinding slurry in the air.14
The elemental component in the Si/C/G composite is construed by the energy dispersive X-ray spectroscopy as well as the elemental mappings. Fig. 4b and d further demonstrates that the active Si and C elements are uniformly distributed in the Si/C/G microspheres. Fig. 4c reveals that the O element scatters homogeneously in the whole material, indicating that the O element should be originated from the absorbed oxygen on the surface of material.1,6,14
 | ||
| Fig. 4 (a) Magnified SEM image and mapping results of (b) Si (purple), (c) O (green), (d) C (L T magenta) of the Si/C/G composite. | ||
In behalf of highlight the preferable performance of Si/C/G compound for anode application in LIBs, we made all the four materials of batteries to compare it are electrochemical performance.19 Cyclic Voltammograms (CV) of the electrodes based on the Si/C/G composites were measured in the potential window from 0.01 to 1.5 V (vs. Li/Li+) at a scan rate of 0.5 mV s−1, as shown in Fig. 5a. In the first catholic half-cycle (lithiation), an extend catholic peak was inspected at about 0.82 V, which was generally associated with the formation of the solid electrolyte interface (SEI) layer in the process of the reaction of Li+ with the electrolyte. The other two anode peaks around 0.35 V and 0.59 V are relevant to the decomposition of the Li–Si phases. To further investigate the cycling stability of Si/C/G composite used as electrodes of LIBs, we compared the electrochemical impedance spectroscopy (EIS) of Si, Si/C, Si/G and Si/C/G composites, respectively. Fig. 5b presents the Nyquist plots of all the four composite electrodes at the charge/discharge states. The depressed semicircles in the high frequency region represent the overlap of the resistance of the SEI film and the charge-transfer resistance, while the straight lines in the low frequency region correspond to the diffusion of lithium ions.20 The Si anode has clearly the largest charge-transfer resistance (RCT) among the four samples. Strikingly, the RCT of the Si/C and Si/G are relatively small, demonstrating that carbon is helpful to the electron transfer. Evidently, the diameter of the semicircle of the Si/C/G composite electrode is the smallest in the four electrodes, illustrating that amorphous carbon layer and graphene sheets could further enhance the conductivity.21 Fig. 5c–f show the testing curves obtained from the LIBs with a Si, Si/C, Si/G and Si/C/G at a current density 0.2 A g−1 with a voltage ranging from 0.01 V to 3 V, which can conclude that the deep lithiation and delithiation for the first three cycles.22,23 The Si electrode exhibits a reversible discharge specific capacity up to 3575 mA h g−1 for the first cycle, which shows beneficially eliminated volume variations and pulverization of active material after coating carbon. Practically, compared with Si and Si/C composites, discharge and charge platforms apparently rise in Si/G, Si/C/G composites, indicating that graphene promoted the ionic conductivity and decreased internal resistance of silicon electrode. Therefore, Si/C/G composite structure presented prominent status for preparation in LIBs with superior cycling stability. In the other hand, the columbic efficiency was found to be almost 100% (reference Fig. 6b) since the second cycle, suggesting the better reversibility of Si/C/G electrodes compared with the previously reported. The irreversible discharge specific capacity for the first charge is owing to the formation of the SEI layer on the surface of Si/C/G electrodes.9,14,24 Moreover, Fig. 5f also shows a stable charge plateau at 2.4 V from the first to the 3rd cycle, indicating an excellent cycling stability of the Si/C/G composite.25–27
 | ||
| Fig. 5 (a) Cycling performance of the Si/C/G composite from 0.01 to 1.5 V at a scanning rate of 0.5 mV s−1. (b) Nyquist plots of the pristine Si, Si/C, Si/G and Si/C/G composites. (c)–(f) First three discharge/charge behaviors of the Si, Si/C, Si/G and Si/C/G composites at a current density of 0.2 A g−1. | ||
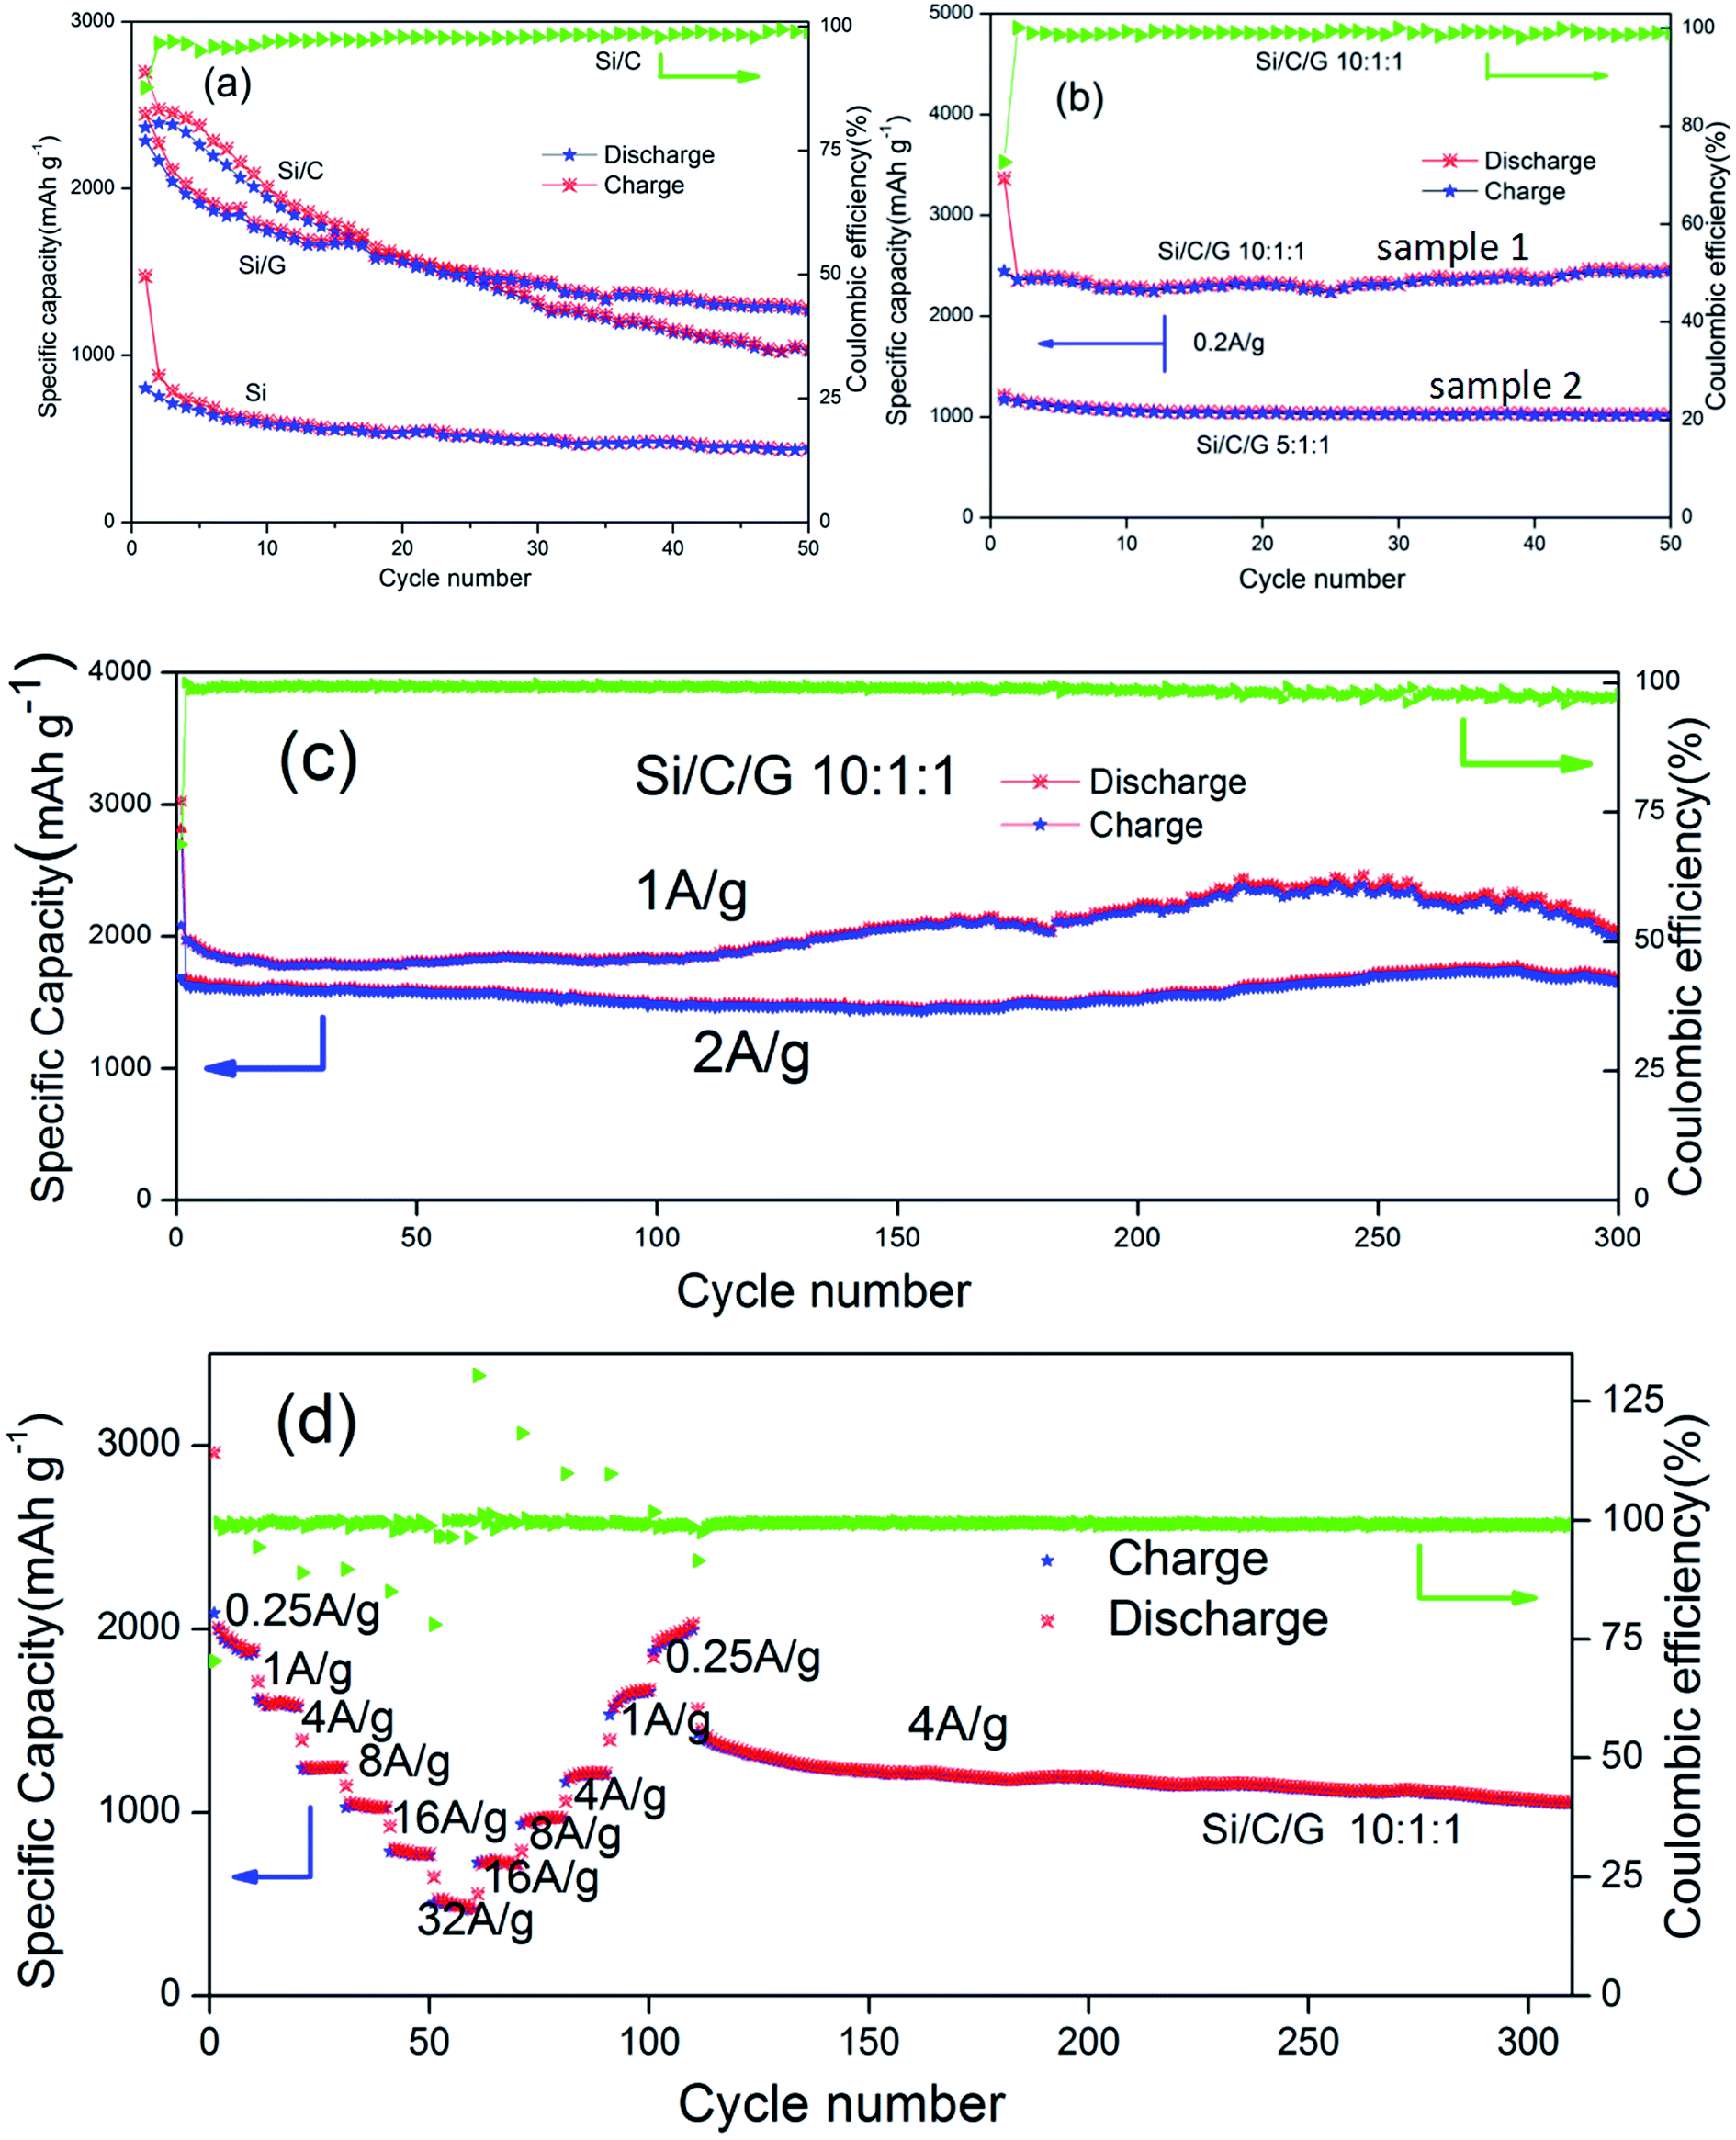 | ||
| Fig. 6 (a) Cycling performance and specific capacity of Si, Si/C and Si/G composite electrodes. (b) The comparisons of cycling stability and specific capacity of Si/C/G composites with different mass ratio. (c) Discharge capacity and coulombic efficiency of the Si/C/G composite electrode at current density of 1 and 2 A g−1. (d) Rate performance for the Si/C/G composites electrode at different charge/discharge current densities ranging from 0.25 A g−1 to 32 A g−1. | ||
Fig. 6a shows the cycling behavior and specific capacity of the pure Si, Si/C and Si/G in coin-type half cells. The specific capacity of pure was the lowest in all the composites. The initial discharge specific capacities (at 0.2 A g−1) of the Si/C, Si/G composites and Si are about 2699, 2515 and 1476 mA h g−1, respectively. After 50 cycles, it still retains 1039, 1253 and 442 mA h g−1, individually, all of which are apparently higher than the pure Si.14,28–30 Fig. 6b compares the cycling stability and specific capacity (0.2 A g−1) of Si/C/G composites with different mass ratio. The initial discharge specific capacities for samples (10:1:1, 5:1:1) are 3366, 1215 mA h g−1, and after 50 cycle, it still retains 2469, 1024 mA h g−1, respectively. On the contrast, the cycling stability and discharge specific capacity of simple (1) is clearly surpassed (2) at the same current density.31 The sample (2) shows excellent cycle stability but low discharge specific capacity, the reason of which could owning to too much carbon,32–34 while the sample (1) displays a better performance. Furthermore, the previously reported Si/C composite microspheres with hierarchical core–shell structure as anode for lithium ion batteries showed a capacity about 900 mA h g−1 at 0.2 A g−1 after 50 cycles. In present work, the discharge specific capacity of Si/C/G composite above 2300 mA h g−1 under the same conditions.14,21 Fig. 6c shows a long cycle performance (300 cycles) at different discharging currents of 1 A g−1, 2 A g−1, which shows stable capacities around 2000, 1600 mA h g−1 respectively. Capacity degradation is almost negligible in this case, demonstrating good stability of the Si/C/G composites.33,35 As previously reported, dual-carbon enhanced silicon-based composite showed a capacity around 800 mA h g−1 at 0.5 A g−1 for 150 cycles, and with a capacity retention of 90% after 150 cycles. By contrast, we have prepared uncomplicated Si/C/G composites which still maintained discharge specific capacity above 2000 mA h g−1 after 300 cycles.36,37 The rate property was measured from 0.25 to 32 A g−1 and again 0.25 A g−1, followed by cycling at 4 A g−1 for additional 210 cycles.38–40 As shown in Fig. 6d, the Si/C/G anode exhibited a superior moderate rate capability, with a capacity of 500 mA h g−1 at 32 A g−1, about 40% of its capacity at 0.25 A g−1. After the rate performance test, the coin cell was cycled for additional 210 cycles at 4 A g−1, maintaining 1057 mA h g−1 and 80% of its reversible capacity, which further confirms the excellent cycling and rate performance of Si/C/G anodes.41,42
The morphological changes of the Si/C/G electrode in the process of lithiation–delithiation are characterized by SEM and the results are shown in Fig. 7. Fig. 7a and b show the initial morphologies of the Si/C/G electrode before charge/discharge cycling, and after 700 cycles, respectively. It can be seen that both images display a similar morphology of the Si/C/G composite. Even after long-time cycling, the Si/C/G composite particles are still closely packed and uniformly distributed on the current collector, without showing fractures or cracking. Moreover, although silicon experiences great volume deformation during lithiation/delithiation process, no apparent changes in particle size are observed in the Si/C/G material after cycling, indicating the extraordinary structural stability of our sample.
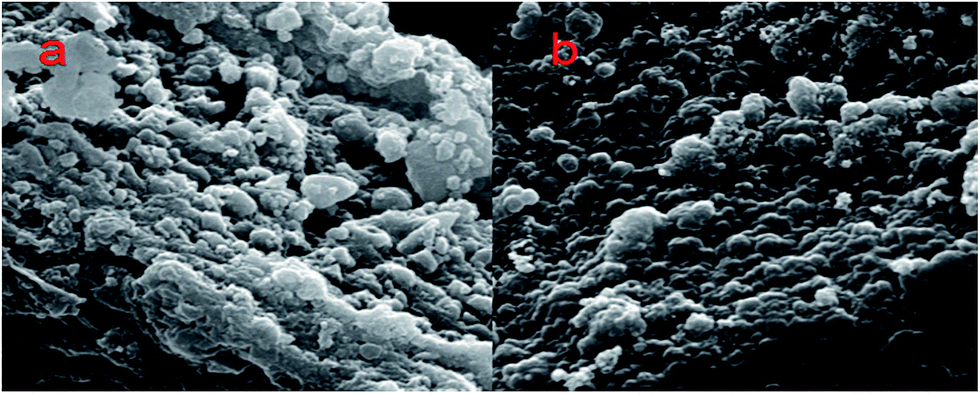 | ||
| Fig. 7 (a) and (b) SEM images of Si/C/G electrodes before and after 700 cycles. | ||
Herein, we develop a simple approach using double carbon coated nano-sized Si as the anode material. As the anode, carbon-coated nano-sized Si composites can significantly improve the cycle performance and enhance specific capacity, while it falls short of achieving the desired commercial goals. To boost batteries rate performance and cycling behavior, we develop a facile hydrothermal route to readily form a hybrid structure of Si/carbon/graphene bilayers (Si/C/G). Especially, superior rate performance of the resulting composites could perfectly meet the commercial demand for the rapid charge and discharge.
4. Conclusions
We have successfully synthesized Si/C/G nanocomposite material via two-step chemical reaction of silicon particles. To improve the specific capacity, cycle and rate performance of nanometer-sized silicon particles, the amorphous carbon was coated on the Si surface to form more steady core–shell structure. Furthermore, the core–shell structure was surrounded by graphene via a simple hydrothermal process, which preserves the integrity of silicon particles. The Si/C/G composite dramatically buffered the volume expansion and enhanced the ion conductivity, which maintained the high specific capacity while promoted the cycle stability and rate performance. From electrochemical performance analysis, the Si/C/G composite remarkably ameliorate the rate performance of Si-based anode material and promote their development of practical application in high performance lithium ion batteries.Conflicts of interest
There are no conflicts to declare.Acknowledgements
Financial support provided by the Sichuan Science and Technology through (2015GZ0130, 2015GZ0132, 2016GZ0025) is gratefully acknowledged.References
- X. Huang, J. Yang, S. Mao, J. Chang, P. B. Hallac, C. R. Fell, B. Metz, J. Jiang, P. T. Hurley and J. Chen, Adv. Mater., 2014, 26, 4326–4332 CrossRef CAS PubMed.
- M. Ge, J. Rong, X. Fang and C. Zhou, Nano Lett., 2012, 12, 2318–2323 CrossRef CAS PubMed.
- D.-H. Liu, H.-Y. Lü, X.-L. Wu, J. Wang, X. Yan, J.-P. Zhang, H. Geng, Y. Zhang and Q. Yan, Nanoscale Horiz., 2016, 1, 496–501 RSC.
- S. Maskova, K. Miliyanchuk, L. Akselrud, I. Halevy, M. Giovannini and L. Havela, J. Alloys Compd., 2017, 694, 201–207 CrossRef CAS.
- T. Song, J. Xia, J. H. Lee, D. H. Lee, M. S. Kwon, J. M. Choi, J. Wu, S. K. Doo, H. Chang, W. I. Park, D. S. Zang, H. Kim, Y. Huang, K. C. Hwang, J. A. Rogers and U. Paik, Nano Lett., 2010, 10, 1710–1716 CrossRef CAS PubMed.
- J. K. Yoo, J. Kim, H. Lee, J. Choi, M. J. Choi, D. M. Sim, Y. S. Jung and K. Kang, Nanotechnology, 2013, 24, 424008 CrossRef PubMed.
- J. Xie, G. Wang, Y. Huo, S. Zhang, G. Cao and X. Zhao, Electrochim. Acta, 2014, 135, 94–100 CrossRef CAS.
- M.-S. Wang, L.-Z. Fan, M. Huang, J. Li and X. Qu, J. Power Sources, 2012, 219, 29–35 CrossRef CAS.
- H. Park, S. Lee, S. Yoo, M. Shin, J. Kim, M. Chun, N. S. Choi and S. Park, ACS Appl. Mater. Interfaces, 2014, 6, 16360–16367 CAS.
- S. Li, X. Qin, H. Zhang, J. Wu, Y.-B. He, B. Li and F. Kang, Electrochem. Commun., 2014, 49, 98–102 CrossRef CAS.
- J.-Z. Guo, X.-L. Wu, F. Wan, J. Wang, X.-H. Zhang and R.-S. Wang, Chem.–Eur. J., 2015, 21, 17371–17378 CrossRef CAS PubMed.
- H. Wu, G. Chan, J. W. Choi, I. Ryu, Y. Yao, M. T. McDowell, S. W. Lee, A. Jackson, Y. Yang, L. Hu and Y. Cui, Nat. Nanotechnol., 2012, 7, 310–315 CrossRef CAS PubMed.
- Y. Yao, M. T. McDowell, I. Ryu, H. Wu, N. Liu, L. Hu, W. D. Nix and Y. Cui, Nano Lett., 2011, 11, 2949–2954 CrossRef CAS PubMed.
- J. Wang, D.-H. Liu, Y.-Y. Wang, B.-H. Hou, J.-P. Zhang, R.-S. Wang and X.-L. Wu, J. Power Sources, 2016, 307, 738–745 CrossRef CAS.
- D.-H. Liu, H.-Y. Lü, X.-L. Wu, B.-H. Hou, F. Wan, S.-D. Bao, Q. Yan, H.-M. Xie and R.-S. Wang, J. Mater. Chem. A, 2015, 3, 19738–19746 CAS.
- A. K. Arora, M. Rajalakshmi, T. R. Ravindran and V. Sivasubramanian, J. Raman Spectrosc., 2007, 38, 604–617 CrossRef CAS.
- J. Chang, X. Huang, G. Zhou, S. Cui, P. B. Hallac, J. Jiang, P. T. Hurley and J. Chen, Adv. Mater., 2014, 26, 758–764 CrossRef CAS PubMed.
- X. Xu, H. Zhang, Y. Chen, N. Li, Y. Li and L. Liu, J. Alloys Compd., 2016, 677, 237–244 CrossRef CAS.
- H.-Y. Lü, F. Wan, L.-H. Jiang, G. Wang and X.-L. Wu, Part. Part. Syst. Charact., 2016, 33, 204–211 CrossRef.
- M.-S. Wang, Y. Song, W.-L. Song and L.-Z. Fan, ChemElectroChem, 2014, 1, 2124–2130 CrossRef CAS.
- W. Sun, R. Hu, M. Zhang, J. Liu and M. Zhu, J. Power Sources, 2016, 318, 113–120 CrossRef CAS.
- R. Dai, W. Sun, L. P. Lv, M. Wu, H. Liu, G. Wang and Y. Wang, Small, 2017, 13, 1003–1007 Search PubMed.
- U. Kasavajjula, C. Wang and A. J. Appleby, J. Power Sources, 2007, 163, 1003–1039 CrossRef CAS.
- N. Liu, Z. Lu, J. Zhao, M. T. McDowell, H. W. Lee, W. Zhao and Y. Cui, Nat. Nanotechnol., 2014, 9, 187–192 CrossRef CAS PubMed.
- S. Wang, J. Liao, M. Wu, Z. Xu, F. Gong, C. Chen, Y. Wang and X. Yan, Part. Part. Syst. Charact., 2017, 1700141, DOI:10.1002/ppsc.201700141.
- Q. Pan, P. Zuo, S. Lou, T. Mu, C. Du, X. Cheng, Y. Ma, Y. Gao and G. Yin, J. Alloys Compd., 2017, 723, 434–440 CrossRef CAS.
- X. L. Bin Wang, X. Zhang, B. Luo, M. Jin, M. Liang, S. A. Dayeh, L. Zhi and S. T. Picraux, ACS Nano, 2013, 7, 6467–6472 Search PubMed.
- B. Wang, X. Li, X. Zhang, B. Luo, Y. Zhang and L. Zhi, Adv. Mater., 2013, 25, 3560–3565 CrossRef CAS PubMed.
- N. Liu, H. Wu, M. T. McDowell, Y. Yao, C. Wang and Y. Cui, Nano Lett., 2012, 12, 3315–3321 CrossRef CAS PubMed.
- W. Jiang, M. Wu, F. Liu, J. Yang and T. Feng, RSC Adv., 2017, 7, 44296–44302 RSC.
- L. F. Cui, Y. Yang, C. M. Hsu and Y. Cui, Nano Lett., 2009, 9, 3370–3374 CrossRef CAS PubMed.
- Y. Xu, Y. Zhu, F. Han, C. Luo and C. Wang, Adv. Energy Mater., 2015, 5, 1400753 CrossRef.
- Z. Lu, N. Liu, H.-W. Lee, J. Zhao, W. Li, Y. Li and Y. Cui, ACS Nano, 2014, 2540–2547 Search PubMed.
- K. Fu, O. Yildiz, H. Bhanushali, Y. Wang, K. Stano, L. Xue, X. Zhang and P. D. Bradford, Adv. Mater., 2013, 25, 5109–5114 CrossRef CAS PubMed.
- D. A. Agyeman, K. Song, G.-H. Lee, M. Park and Y.-M. Kang, Adv. Energy Mater., 2016, 6, 1600904 CrossRef.
- S. Ohara, J. Suzuki, K. Sekine and T. Takamura, J. Power Sources, 2004, 136, 303–306 CrossRef CAS.
- J. K. Lee, K. B. Smith, C. M. Hayner and H. H. Kung, Chem. Commun., 2010, 46, 2025–2027 RSC.
- G. Derrien, J. Hassoun, S. Panero and B. Scrosati, Adv. Mater., 2007, 19, 2336–2340 CrossRef CAS.
- X. Zhao, C. M. Hayner, M. C. Kung and H. H. Kung, Adv. Energy Mater., 2011, 1, 1079–1084 CrossRef CAS.
- C. M. Park, J. H. Kim, H. Kim and H. J. Sohn, Chem. Soc. Rev., 2010, 39, 3115–3141 RSC.
- B.-H. Hou, X.-L. Wu, Y.-Y. Wang, H.-Y. Lü, D.-H. Liu, H.-Z. Sun, J.-P. Zhang and H.-Y. Guan, Part. Part. Syst. Charact., 2015, 32, 1020–1027 CrossRef CAS.
- X.-L. Wu, Y.-G. Guo, J. Su, J.-W. Xiong, Y.-L. Zhang and L.-J. Wan, Adv. Energy Mater., 2013, 3, 1155–1160 CrossRef CAS.
| This journal is © The Royal Society of Chemistry 2017 |