 Open Access Article
Creative Commons Attribution 3.0 Unported Licence
A facile electrospinning and electrospraying synchronization technique for preparation of high performance MnO/C@rGO composite anodes for lithium storage
Fan Wanga,
Peipei Zhua,
Jiaolong Pana,
Chao Li*b and
Zhenyu Yang *ab
*ab
aSchool of Chemistry, Nanchang University, No.999, Xuefu Road, Nanchang, Jiangxi 330031, P. R. China. E-mail: zyyang@ncu.edu.cn; Tel: +86-791-83969514
bSchool of Chemical Engineering and Energy Technology, Dongguan University of Technology, Dongguan, Guangdong 523808, P. R. China. E-mail: lichao@dgut.edu.cn
First published on 16th October 2017
Abstract
A three-dimensional (3D) composite film has become one of the most attractive candidates for energy-storage systems owing to its simple design and fast charge-transportation network. In this study, novel electrospinning and electrospraying synchronization technologies were combined to achieve manganese oxide/carbon nanofibers@reduced graphene oxide composite film electrodes [MnO/CNFs@rGO, (MCG)] for lithium-ion batteries (LIBs). In such an electrode structure, the as-prepared CNFs/MnO nanowires successively dispersed on the 2D reduced graphene oxide (rGO) sheets to build a 3D composite flexible film, forming an especially stable, freestanding, and binder-free structure. In this film, the rGO sheets and carbon coating can accommodate the huge volume expansion from MnO after lithiation, improve the electronic conductivity, and further increase lithium ion diffusion. Remarkably, the MCG electrodes exhibited a reversible capacity of 1148 mA h g−1 at a current density of 0.1 A g−1 and retained a capacity of 332 mA h g−1 at a current density of 5 A g−1 even after 4500 cycles. More interestingly, the MnO2 powder (Mn source) used as the raw material in this work was the recovery product from spent Zn/MnO2 batteries. The present work also demonstrates a new approach to utilize the MnO2 from spent Zn/MnO2 batteries to make high value Li-ion battery electrodes.
1. Introduction
Currently, lithium-ion batteries (LIBs) dominate the market of energy-storage systems and have become irreplaceable in portable devices. However, along with the gradually increasing demand, the many shortcomings of the electrode materials, such as low specific capacity, poor rate capability, and short life, have further limited the development and application of LIBs.1,2 Searching for advanced materials is one of the most important missions in current LIB studies. However, most of the cathode materials in commercial applications are based on LiMO (M is a transition metal, such as Co, Mn, Ni), and these intercalation-based materials have a relatively small number of crystallographic sites for storing charge-carrier ions, leading to limited energy densities (≤200 mA h g−1), so there is very little room for further improvement.2 Therefore, searching for anode materials with a high capacity is urgently needed.Compared with commercial graphite anode with low theoretical specific capacity (372 mA h g−1),3 transitional-metal oxides, such as Co3O4,4,5 Fe2O3,6 and MnO, Mn2O3 and Mn3O4,7–10 have received increasing attention owing to their high theoretical capacities. Among them, MnO has become one of the most popular anode materials for LIBs owing to their low cost, high theoretical capacity, and environmentally friendly characteristics.8–12 It has also some superior characteristics such as low conversion potential (1.032 V vs. Li/Li+) and low voltage hysteresis than that of common graphite.10,13,14 Besides, MnO is also demonstrated as the only end-product relative to other manganese oxides after the recharge process in the first discharge process.15,16 Nevertheless, as an anode material, raw MnO material still suffers from fast capacity fading and low rate capability, which are caused by poor conductivity, serious agglomeration, and the large volume change due to Li+ incorporation/extraction in the charge–discharge process.17
In primary studies, various MnO/C composites with different nanostructures have been synthesized by many methods for LIBs.18–26 However, most of the synthesis strategies included multi-step routes, combing hydrothermal reaction, and other post-treatments. In addition, the synthesized nanostructures by hydrothermal processes are highly susceptible to the reaction parameters, and the synthesis methods have been difficult to reproduce.
Recently, the method of electrospinning along with heat treatment has received significant attention owing to its simplicity, high efficiency, and versatility for the preparation of diverse one-dimensional (1D) structures.27–30 For example, Zhao's group fabricated a composite film electrode of MnO/carbon through incorporating MnO2 nanowires from hydrothermal reaction into polymer solution by a facile electrospinning technique. The MC-800 membrane exhibited a high reversible capacity of 987.3 mA h g−1, after 150 cycles at 0.1 A g−1, a good rate capability (406.1 mA h g−1 at 3 A g−1), and an excellent cycling performance (655 mA h g−1 over 280 cycles at 0.5 A g−1).28 Liu et al. have designed a flexible membrane through incorporating Mn3O4 nanoparticles encapsulated in carbon nanofibers (CNFs). These materials exhibited a high reversible capacity at a high current density of 1 A g−1 and the specific capacity was up to 575 mA h g−1 after 200 cycles.30
Herein, we combined electrospinning and electrospraying processes to achieve the manganese monoxide/carbon nanofibers@reduced graphene oxide [MnO/CNFs@rGO, (MCG)] composite electrodes for LIBs. The 3D electrode showed stable, freestanding, and binder-free structure: the 2D reduced graphene (rGO) sheets are dispersed on each of the 1D MnO/CNFs nanowires; rGO and carbon-wrapped MnO particles in such electrode can accommodate the huge volume expansion, shorten the diffusion distance of lithium ions and electrons, and offers a good electronic conduction between the MnO particles. It is found that the MCG film exhibited the average specific capacities of 1148 mA h g−1 at 0.1 A g−1, and the capacity retention was still up to 80% after 80 cycles; this electrode can still keep 332 mA h g−1 at a current density of 5 A g−1 after 4500 cycles. More interestingly, the recovery MnO2 products from the spent batteries have been directly used as the Mn source. This work also demonstrates a great potential approach to utilize the MnO2 from the spent Zn/MnO2 batteries into high value anode materials for Li-ion batteries applications.
2. Experimental
2.1 Materials
Manganese dioxide (MnO2, 91%) was provided by Sanmu Battery Recovery Co. (Fosan, China). The received sample was ground for 24 h by high energy ball-milling treatment before use. Polyacrylonitrile (PAN, Mw = 150![[thin space (1/6-em)]](https://www.rsc.org/images/entities/char_2009.gif) 000) was purchased from J&K Chemical; N, N-dimethylformamide (DMF, AR) were purchased from Sinopharm Chemical Reagent Co, Ltd; these reagents were used without further purification.
000) was purchased from J&K Chemical; N, N-dimethylformamide (DMF, AR) were purchased from Sinopharm Chemical Reagent Co, Ltd; these reagents were used without further purification.
2.2 Fabrication of MnO2/PAN@GO nanofiber films
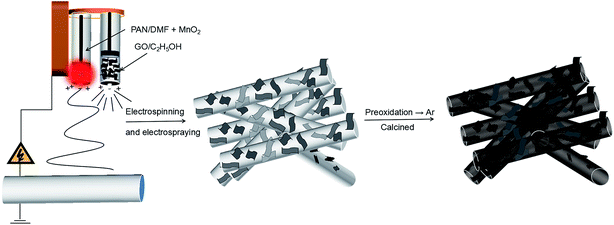
A PAN solution was prepared by dissolving 0.8 g of PAN in 10 mL of DMF at room temperature with vigorous stirring for 2 h, 1 g MnO2 powders were dispersed in the solution of PAN/DMF, with ultrasonic stirring over 2 h at room temperature, then stirred at 60 °C for 12 h in order to obtain homogeneous viscous mixtures, which was called solution (a). Meanwhile, GO was obtained by an improved “hummers” method, described in detail previously.31 Then, it was dissolved in ethanol, which was called solution (b). Then, the as-prepared precursor solution “(a) and (b)” were loaded into a plastic syringe with a stainless steel nozzle, respectively. With a syringe pump (1 mL h−1) and an applied voltage of 16 kV between the electrospinning jet and the collector (15 cm). The as-prepared MnO2/PAN@GO composite film were dried at 80 °C for 12 h in vacuum oven. Then the MnO2/PAN@GO composite film was obtained by electrospinning and electrospraying simultaneously. The unit of temperature throughout this work is degree centigrade (°C) if not specified.2.3 Fabrication of MCG films
The composite film was firstly heated at 280 °C in air for 2 h to promote stabilization. Then, the MnO/CNFs@rGO (MCG) was obtained by a simple carbonization treatment process. In a typical synthesis of MCG composite film, MnO2/PAN@GO was sintered at 800 °C for 3 h at a rate of 5 °C min−1 under Ar atmosphere. The obtained sample was named as MCG-800. For comparison, the MCG sample were treated at different temperature (600 °C and 700 °C), which denoted as MCG-600 and MCG-700, respectively. In order to explore the effect of graphene, the MnO/CNFs (MC-800) samples was obtained by sintering PAN/MnO2 under the sintering temperature of 800 °C, and the pure MnO (M-800) sample was obtained by sintering MnO2 powder under the temperature of 800 °C (Scheme 1).2.4 Characterization
The crystal structures of the obtained samples were determined by X-ray diffraction (XRD, Bruker D8 Focus X-ray diffractometer) using Cu Kα radiation over the range of 2θ = 5–80°, the morphology and structure of products were examined using a scanning electron microscopy (SEM, FEI Quanta200F) and transmission electron microscopy and high-resolution TEM (TEM, FEI Tecnai G2 F20, 200 kV). X-ray photoelectron spectra (XPS) were recorded using an X-ray photoelectron spectrometer (K-Alpha 1063) with a monochromatic Al Kα X-ray source. Raman spectroscopy was performed with a laser micro-Raman spectrometer (Renishaw inVia, Renishaw, 532 nm excitation wavelength). Weight loss behavior was tested by thermogravimetric (TG) analysis (TGA/DSC 3+, Mettler Toledo, Zurich, Switzerland) (air, 10°C min−1).2.5 Cell fabrication and electrochemical measurement
Electrochemical experiments of the half cell was carried out on CR 2025 coin cells, which were assembled in an Ar-filled MBraun glove box. Li metal was used as counter electrode and celgard 2400 as the separator. The as-obtained flexible nanofiber films were tailored into freestanding discs with 10 mm in diameter, which were directly used as the working electrode without any binder and conductive additive. The electrolyte was 1M LiPF6 dissolved in a mixture of ethylene carbonate/dimethyl carbonate/diethyl carbonate (EC/DMC/DEC = 1![[thin space (1/6-em)]](https://www.rsc.org/images/entities/char_2009.gif) :
:![[thin space (1/6-em)]](https://www.rsc.org/images/entities/char_2009.gif) 1
1![[thin space (1/6-em)]](https://www.rsc.org/images/entities/char_2009.gif) :
:![[thin space (1/6-em)]](https://www.rsc.org/images/entities/char_2009.gif) 1, v/v). The coin cells were galvano statically cycled between 3.0 and 0.02 V (vs. Li/Li+) using a NEWARE battery measurement system at room temperature. Electrochemical impedance spectroscopy (EIS) tests were measured in the frequency range from 100 kHz to 0.1 Hz on a electrochemical workstation (PARSTAT 2273, Princeton, USA).
1, v/v). The coin cells were galvano statically cycled between 3.0 and 0.02 V (vs. Li/Li+) using a NEWARE battery measurement system at room temperature. Electrochemical impedance spectroscopy (EIS) tests were measured in the frequency range from 100 kHz to 0.1 Hz on a electrochemical workstation (PARSTAT 2273, Princeton, USA).
3. Results and discussion
The composition, crystalline structure, and phase purity of samples were characterized by X-ray diffraction (XRD). Fig. 1a shows the XRD patterns of the samples MCG-600, MCG-700, and MCG-800. It is found that the crystallinity of MCG increased as the sintering temperature increased. Then the MCG-800 samples showed sharp diffraction peaks located at 34.9, 40.5, 58.7, 70.1, and 73.7°, and the d-space/index have been marked as to the 0.256 nm/(111), 0.222 nm/(200), 0.157 nm/(220), 0.134 nm/(311) and 0.128 nm/(222) for the MnO, respectively, and assigned to the cubic phase of MnO (JCPDS no. 07-0230).32 It shows the good crystallinity compared with the samples of MCG-600 and MCG-700. In addition to the relatively weak diffraction peak at 26°, which was assigned to carbon and rGO in the nanocomposites, a strong diffraction peak from GO was not detected at 11.2°, indicating that most oxygen functional groups had been removed from GO.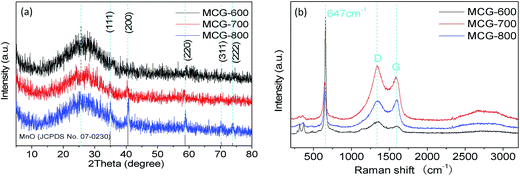 | ||
| Fig. 1 XRD patterns of MCG (a); MCG-600, MCG-700 and MCG-800. (b) Raman spectra of MCG-600, MCG-700 and MCG-800. | ||
Raman spectroscopy was further used to confirm the existence of MnO and carbonaceous materials, as depicted in Fig. 1b. The G and D bands of composite film were ascribed to ordered sp2 bonded carbon and disordered carbon,33 respectively. The existing G band at 1573 cm−1 and D band at 1343 cm−1 indicate that the ordered sp2 bonded carbon dominates the structure of the planes. During elevating temperature, the MCG did not show much difference between the intensity ratio of ID/IG for MCG-600 (1.35), MCG-700 (1.17), and MCG-800 (0.96), revealing a relatively high defective state for the hybrid carbon. In addition, the Raman band at ∼647 cm−1 belongs to the Mn–O stretching vibration of MnO.34–36 The strong vibrational band at <400 cm−1 is attributed to Mn3O4 rather than MnO, because MnO easily transforms into Mn3O4 on a local heating effect and photochemically transforms under beam irradiation when the beam intensity is >1.1 mW during the Raman measurement.37
The morphology and structural observations were further investigated by SEM. Fig. 2a–f show the SEM images. After the thermal treatment, the diameter of the nanowires of MCG-600, MCG-700, and MCG-800 becomes smaller. Moreover, after calcinations, the diameter of the nanowires gradually decreases with increasing carbonization temperature. Further, graphene sheet and nanowire were found to be closely bonded to each other. In addition, the diameter of CM-800 sample became smaller as well.
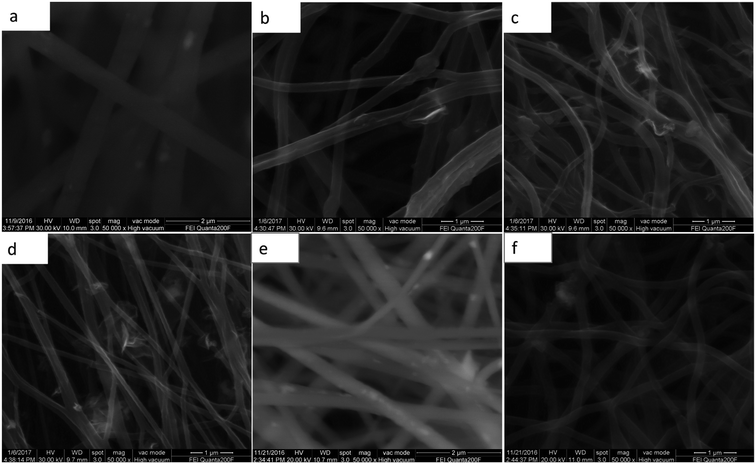 | ||
| Fig. 2 SEM images of MnO2/PAN@GO in the (a); MCG-600, MCG-700, MCG-800 corresponds to (b)–(d); SEM images of MnO@PAN in the (e); SEM images of MC-800 in the (f). | ||
The transmission electron microscopy (TEM) images are displayed in Fig. 3. The 2D rGO sheets are layer by layer dispersed on each of the 1D MC-800 composite filaments (Fig. 3a). Fig. 3b shows the clear diffraction spot ring of reduced graphene from its SAED pattern. Fig. 3c and e reveal that the MnO nanoparticles are uniformly embedded in the nanowires. Nevertheless, a part of these nanoparticles were on the surface of the nanowires. The lattice fringes (Fig. 3d and f) with a lattice fringe spacing of 2.56 Å and 1.28 Å are indexed to the (111) and (222) planes of the cubic MnO phase, respectively.38–40
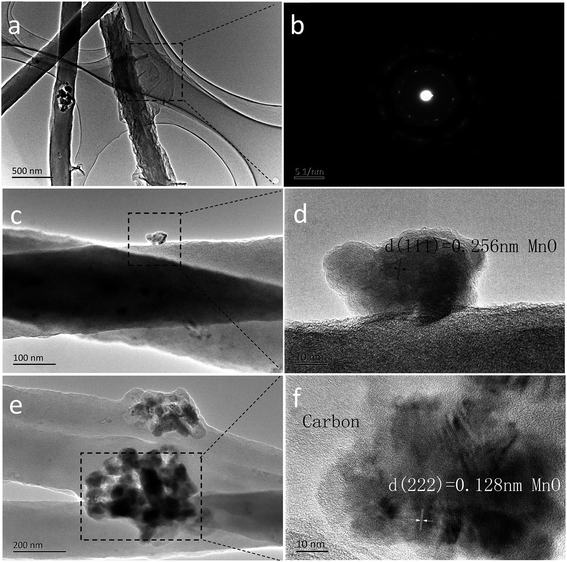 | ||
| Fig. 3 TEM images of the as-prepared MCG composite film: (a); the diffraction pattern of rGO is in (b); TEM image (c) and HRTEM image (d); TEM image (e) and HRTEM image (f). | ||
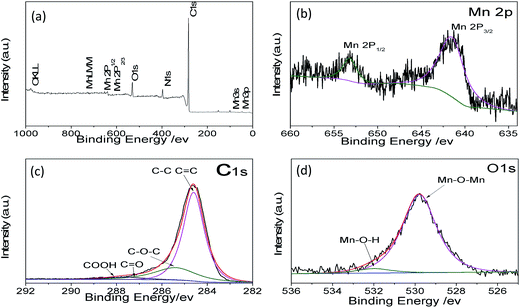
To further confirm the material structure, the oxidation states and composition of manganese oxides were investigated by X-ray photoelectron spectroscopy (XPS). The wide survey XPS spectrum of MCG in Fig. 4a shows predominant signals of carbon, oxygen, and manganese. The peaks at 642.1 and 653.1 eV correspond to the Mn 2p3/2 and Mn 2p1/2 binding energy, respectively, which indicates the valence of Mn is +2, agreeing with the oxidation state in MnO, as shown in Fig. 4b.41 Fig. 4c shows the high-resolution XPS spectrum for C 1s, which can be deconvoluted into four peaks. The strong C 1s peak at 284.5 eV corresponds to the graphitic carbon in graphene, whereas the weaker peak including C–O, C–O–C, and C–O![[double bond, length as m-dash]](https://www.rsc.org/images/entities/char_e001.gif) O appeared at 285.7, 287.6, and 288.5 eV,42 respectively. The O 1s spectra of the as-prepared samples are shown in Fig. 4d. The peaks centered at 529.5 and 532.0 eV are related to the binding energy of O 1s in anhydrous Mn–O–Mn and hydrated (Mn–O–H) manganese oxides, respectively.43
O appeared at 285.7, 287.6, and 288.5 eV,42 respectively. The O 1s spectra of the as-prepared samples are shown in Fig. 4d. The peaks centered at 529.5 and 532.0 eV are related to the binding energy of O 1s in anhydrous Mn–O–Mn and hydrated (Mn–O–H) manganese oxides, respectively.43
The TG curves of the samples MCG-600, MCG-700, and MCG-800 are shown in Fig. 5a. There was almost no weight loss in the temperature range from 150 °C to 320 °C, demonstrating that the composite is stable up to 320 °C in the air. When the temperature increased from 320 to 500 °C, the weight gradually decreased, owing to the oxidation of carbon to carbon dioxide (C + O2 → CO2 (gas)).44,45 When the temperature increased from 600 to 800 °C, the weight gradually increased, attributed to the oxidation of MnO (MnO + O2 → Mn2O3). Based on the theoretical value (11.3 wt%) of the weight gain from MnO to cubic Mn2O3 (JCPDS 41-1442) according to the TG results, the loading mass of the MnO component was estimated to be approximately 19.6, 21.9, and 43.9 wt% for MCG-600, MCG-700, MCG-800 samples, respectively, and MCG-800 sample exhibited the highest MnO content.
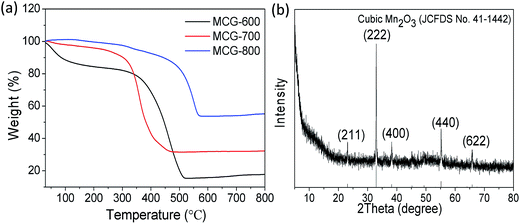 | ||
| Fig. 5 (a) TGA curves of MCG-600, MCG-700 and MCG-800; (b) XRD pattern of MCG-800 after TGA testing (cubic Mn2O3). | ||
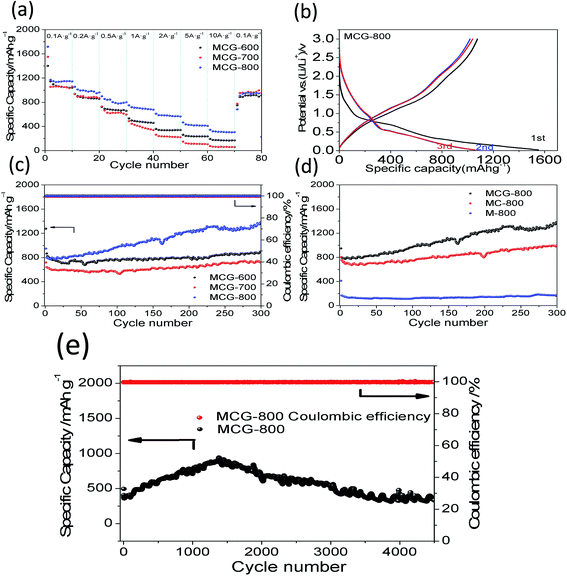
To better illustrate the electrochemical performance of the MCG, the rate capability of the samples was investigated by discharging-charge at various current densities. As shown in Fig. 6a, it is clear that the MCG-800 sample exhibits excellent rate capability, except for the first circular discharge, and the average specific capacities were calculated to be 1148, 990, 818, 702, 580, 424, and 313 mA h g−1 at the current densities of 0.1, 0.2, 0.5, 1, 2, 5, and 10 A g−1, respectively. When the current density switched back to 0.1 A g−1 after 80 cycles, the composite electrode exhibited a high discharge capacity of 914 mA h g−1 with a capacity retention of up to 80%, indicating an outstanding restorability. In order to further investigate its reversible electrochemical performance, the first three discharge–charge processes for MCG-800 sample are shown in Fig. 6b. The initial discharge and charge capacities are 1719 and 1159 mA h g−1, respectively. As expected, the formation of the SEI layer results in a relatively low coulombic efficiency (CE) during the initial cycle under a low charge–discharge current density. The second and third discharge curves at 0.1 A g−1 have a dominant plateau at ∼0.6 V, attributed to the reaction of Li+ and MnO (MnO + 2Li+ + 2e− ↔ Li2O + Mn, Li2O + Mn ↔ MnO + 2Li+ + 2e−). A minor and slope plateau in the range 0.3–0.02 V was also observed, corresponding to the formation of solid electrolyte interphase (SEI) film on the electrode surface. Redox reactions are attributed to the oxidation of Mn0 changing to Mn2+, and the Mn2+ to a higher oxidation state (Mn + Li2O → MnO + 2Li+ + 2e−; MnO + 1/2Li2O → 1/2Mn2O3 + Li+ + e−).46,47 To investigate the cycle stability of the composite materials, the cyclabilities of the MCG, MC-800, and M-800 electrodes were tested in the voltage range 0.02–3.0 V at a constant current density of 0.5 A g−1. Fig. 6c and d show the discharge–charge capacities versus cycle number for MCG-600, MCG-700, MCG-800, MC-800, and M-800 electrodes. The MCG-800 composite electrode exhibits a high reversible capacity of 1176 mA h g−1 and a high CE nearly ∼100% except for the initial few cycles, which are not only much higher than MC-800 and M-800 electrodes (Fig. 6d), but also obviously higher than the other two MCG composite electrodes (Fig. 6c) after 300 cycles. Fig. 6e also shows distinct superiority of MCG-800, and long cycling curves of MCG-800 are displayed at a current of 5 A g−1. Remarkably, after 4500 cycles, the retention capacity finally reaches 332 mA h g−1 to manifest excellent cycling stability. Interestingly, the specific capacity starts to gradually increase from the 50th cycle, and this has also been observed previously for nanostructured Mn-based materials.48,49 Such excellent electrochemical stability of the MCG composite film is rarely reported in literature.
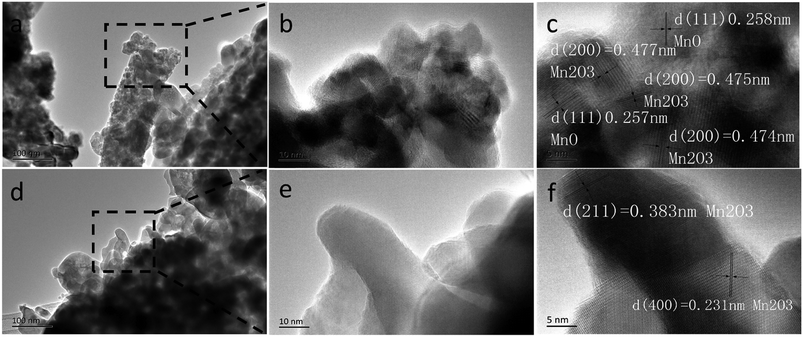
It should be mentioned that the capacity of the MCG (MCG-800) electrode gradually increases at initial 1500 cycles at high current densities of 5 A g−1 (Fig. 6e), attributed to the electrochemically driven reconstruction of the hybrid MCG electrodes to enhance the electrochemical activity, thus improving the capacity. As shown in Fig. 7, the MCG film surface of the nanowires became rough after 500th cycles; a small part of nanowires was broken after 1500th cycles; and the most of nanowires were broken after 3000th cycles. At the same time, a few cracks and defects were observed in the material, because of the conversion reaction of Mn compounds together with repeated volume expansion and contraction; however, the peeling of MCG film was not yet observed. Surface roughness of the nanowires can provide a shorter transport distance and expose more active sites to store ions or charges. This can be regarded as a significant reason for the observed elevated capacity. The improved conversion reaction kinetics by the formation of defects in the electrodes during cycling oxidizes Mn ions to a higher oxidation state as evidenced by the HR-TEM results. Fig. 8a–c and d–f show the TEM images of MCG-800 after 500 and 1500 cycles, respectively. Meanwhile, when the MCG electrode is cycled from 500 to 1500 times, more Mn2+ ions could be re-oxidized to Mn3+, increasing the capacity, as shown in Fig. 8c–f.
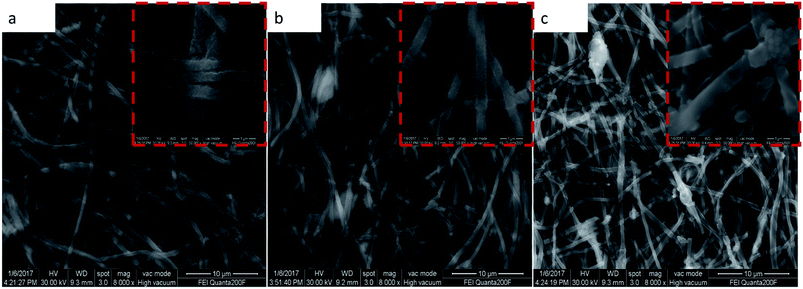 | ||
| Fig. 7 SEM images of MCG-800 shows in (a)–(c), which corresponds to 500th cycles, 1500th cycles and 3000th cycles, respectively. | ||
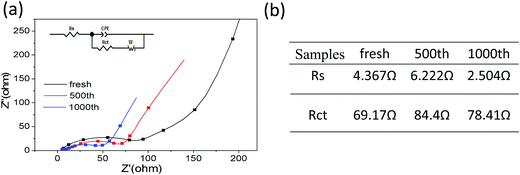
Further, electrochemical impedance spectroscopy (EIS) of different cycles at the discharge state were measured to understanding the long cycling stability for MCG-800 samples during the discharge–charge processes (Fig. 9a). In general, a semicircle at the high-frequency region in Nyquist plots is expressed as the ohmic resistance at the electrode/electrolyte interface. It is obviously noted that the shapes of the Nyquist plots at different cycles are similar, indicating the almost same interparticle contact resistances to prove the high structural integrity of MCG-800. MCG-800 electrodes were further investigated by an equivalent circuit model (Fig. 9b). The fitting results show that the Rct and Rs resistance values of MCG-800 composite film are still kept at small values even after 1000th cycles. These results confirm that the 3D film structure with the 2D reduced graphene sheets dispersing layer by layer between the MnO/C composite nanofibers is beneficial to further reduce the electronic conductivity of composites. In short, these aforementioned factors translate to greater accessibility to active sites for the lithium ion, shorter diffusion distances and quicker lithium ion diffusion, thereby explaining the significantly better rate capability and excellent cycling performance of the MCG-800 composite film electrodes.
4. Conclusions
In summary, a novel, well-defined MCG film for high-performance LIB anodes was successfully fabricated via simultaneous electrospinning and electrospraying strategy. For the as-obtained electrode, the 2D reduced graphene sheets are dispersed on each of the 1D MnO/CNFs composite filaments, which not only enhance the electrical conductivity and the flexibility of the material but also increase the specific surface area, significantly increasing the specific capacity. For example, the MCG-800 composite film exhibited the average specific capacities of 1148 mA h g−1 at 0.1 A g−1 and then back to 0.1 A g−1 after 80 cycles, with a capacity retention of up to 80%; the film electrode reached 332 mA h g−1 at a current density of 5 A g−1 after 4500 cycles. Furthermore, this work also demonstrates a great potential approach to utilize the MnO2 from the spent Zn/MnO2 batteries into high value anode materials for Li-ion batteries applications.Conflicts of interest
There are no conflicts to declare.Acknowledgements
This work is supported by the National Natural Science Foundation of China (No. 21263016, 21363015, 51662029) and the Jiangxi Province Research Program of Science and Technology (No. 2011BBE50022).References
- M. R. Palacin, Chem. Soc. Rev., 2009, 38, 2565 RSC.
- (a) L. Ji, Z. Lin, M. Alcoutlabi and X. Zhang, Energy Environ. Sci., 2011, 4, 2682 RSC; (b) J. W. Choi and D. Aurbach, Nat. Rev. Mater., 2016, 1, 16013 CrossRef CAS.
- B. S. Lee, S. B. Son, K. M. Park, G. Lee, K. H. Oh, S. H. Lee and W.-R. Yu, ACS Appl. Mater. Interfaces, 2012, 4, 6702 CAS.
- H.-L. Wang, N. Mao, J. Shi, Q.-G. Wang, W.-H. Yu and X. Wang, ACS Appl. Mater. Interfaces, 2015, 7, 2882–2890 CAS.
- H.-T. Sun, G.-Q. Xin, T. Hu, M.-P. Yu, D.-L. Shao, X. Sun and J. Lian, Nat. Commun., 2014, 5, 4526 CAS.
- J. M. Jeong, B. G. Choi, S. C. Lee, K. G. Lee, S.-J. Chang, Y.-K. Han, Y. B. Lee, H. U. Lee, S. Kwon, G. Lee, C. S. Lee and Y. S. Huh, Adv. Mater., 2013, 25, 6250–6255 CrossRef CAS PubMed.
- H.-L. Wang, L.-F. Cui, Y. Yang, H. S. Casalongue, J. T. Robinson, Y. Y. Liang, Y. Cui and H.-J. Dai, J. Am. Chem. Soc., 2010, 132, 13978–13980 CrossRef CAS PubMed.
- J. Gao, M. A. Lowe and H. D. Abruña, Chem. Mater., 2011, 23, 3223–3227 CrossRef CAS.
- J. Guo, Q. Liu, C. Wang and M. R. Zachariah, Adv. Funct. Mater., 2012, 22, 803–811 CrossRef CAS.
- Y. Xia, Z. Xiao, X. Dou, H. Huang, X.-H. Lu, R.-J. Yan, Y.-P. Gan, W.-J. Zhu, J.-P. Tu, W.-K. Zhang and X.-Y. Tao, ACS Nano, 2013, 7, 7083–7092 CrossRef CAS PubMed.
- H. Hu, H.-Y. Cheng, Z.-F. Liu and Y. Yu, Electrochim. Acta, 2015, 152, 44–52 CrossRef CAS.
- C.-Y. Zhu, N. Sheng and T. Akiyama, RSC Adv., 2015, 5, 21066–21073 RSC.
- H. Jiang, Y.-J. Hu, S.-J. Guo, C.-Y. Yan, P. S. Lee and C.-Z. Li, ACS Nano, 2014, 8, 6038–6046 CrossRef CAS PubMed.
- S.-M. Guo, G.-X. Lu, S. Qiu, J.-R. Liu, X.-Z. Wang, C.-Z. He, H.-G. Wei, X.-R. Yan and Z.-H. Guo, Nano Energy, 2014, 9, 41–49 CrossRef CAS.
- J. Zhang, R. Wang, X. Yang, W. Lu, X. Wu, X. Wang, H. Li and L. Chen, Nano Lett., 2012, 12, 2153–2157 CrossRef CAS PubMed.
- F. J. Douglas, D. A. MacLaren, F. Tuna, W. M. Holmes, C. C. Berry and M. Murrie, Nanoscale, 2014, 6, 172–176 RSC.
- Y.-M. Sun, X.-L. Hu, W. Luo, F.-F. Xia and Y.-H. Huang, Adv. Funct. Mater., 2013, 23, 2436–2444 CrossRef CAS.
- X. Gu, J. Yue, L. Chen, S. Liu, H. Xu, J. Yang, Y. Qian and X. Zhao, J. Mater. Chem. A, 2015, 3, 1037–1041 CAS.
- Y. Xiao, X. Wang, W. Wang, D. Zhao and M. Cao, ACS Appl. Mater. Interfaces, 2014, 6, 2051–2058 CAS.
- J. Liu, N. Chen and Q. Pan, J. Power Sources, 2015, 299, 265–272 CrossRef CAS.
- H. Jiang, Y. Hu, S. Guo, C. Yan, P. Lee and C. Li, ACS Nano, 2014, 8, 6038–6046 CrossRef CAS PubMed.
- W.-M. Chen, L. Qie, Y. Shen, Y.-M. Sun, L.-X. Yuan, X.-L. Hu, W.-X. Zhang and Y.-H. Huang, Nano Energy, 2013, 2, 412–418 CrossRef CAS.
- J.-G. Wang, C. Zhang, D. Jin, K. Xie and B. Wei, J. Mater. Chem. A, 2015, 3, 13699–13705 CAS.
- J.-G. Wang, D. Jin, H. Liu, C. Zhang, R. Zhou, C. Shen, K. Xie and B. Wei, Nano Energy, 2016, 22, 524–532 CrossRef CAS.
- C. Zhang, J.-G. Wang, D. Jin, K. Xie and B. Wei, Electrochim. Acta, 2015, 180, 990–997 CrossRef CAS.
- G. Zhang, H.-B. Wu, H. E. Hostera and X.-W. Lou, Energy Environ. Sci., 2014, 7, 302–305 CAS.
- J.-G. Wang, Y. Yang, Z.-H. Huang and F. Kang, Electrochim. Acta, 2015, 170, 164–170 CrossRef CAS.
- X. Zhao, Y. Du, L. Jin, Y. Yang, S. Wu, W. Li, Y. Yu, Y. Zhu and Q. Zhang, Sci. Rep., 2015, 5, 14146 CrossRef CAS PubMed.
- G. Yang, Y. Li, H. Ji, H. Wang, P. Gao, L. Wang, H. Liu, J. Pinto and X. Jang, J. Power Sources, 2012, 216, 353–362 CrossRef CAS.
- B. Liu, X. Hu, H. Xu, W. Luo and Y. Sun, Sci. Rep., 2014, 4, 4229 CrossRef PubMed.
- F. Xiang, R. Mukherjee, J. Zhong, Y. Xia, N.-Y. Gu, Z.-Y. Yang and N. Koratkar, Energy Storage Materials, 2015, 1, 9–16 CrossRef.
- J.-G. Wang, Y. Yang, Z.-H. Huang and F. Kang, Electrochim. Acta, 2015, 170, 164–170 CrossRef CAS.
- L.-Z. Bai, D.-L. Zhao, T.-M. Zhang, W.-G. Xie, J.-M. Zhang and Z.-M. Shen, Electrochim. Acta, 2013, 107, 555–561 CrossRef CAS.
- W. Luo, X.-L. Hu, Y.-M. Sun and Y.-H. Huang, ACS Appl. Mater. Interfaces, 2013, 5, 1997–2003 CAS.
- N. Mironova-Ulmane, A. Kuzmin and M. Grube, J. Alloys Compd., 2009, 480, 97–99 CrossRef CAS.
- S. Chen, J.-W. Zhu and X. Wang, ACS Nano, 2010, 4, 6212–6218 CrossRef CAS PubMed.
- I. Rusakova, T. Ould-Ely, C. Hofmann, D. Prieto-Centurión, C. S. Levin and N. J. Halas, Chem. Mater., 2007, 19, 1369–1375 CrossRef CAS.
- Y.-J. Mai, D. Zhang, Y.-Q. Qiao, C.-D. Gu, X.-L. Wang and J.-P. Tu, J. Power Sources, 2012, 216, 201–207 CrossRef CAS.
- Y.-L. Ding, C.-Y. Wu, H.-M. Yu, J. Xie, G.-S. Cao, T.-J. Zhu, X.-B. Zhao and Y.-W. Zeng, Electrochim. Acta, 2011, 56, 5844–5848 CrossRef CAS.
- Y. Sun, X. Hu, W. Luo, F. Xia and Y. Huang, Adv. Funct. Mater., 2013, 23, 2436–2444 CrossRef CAS.
- D.-W. Liu, Q.-F. Zhang, P. Xiao, B. B. Garcia, Q. Guo and R. Champion, et al., Chem. Mater., 2008, 20, 1376–1380 CrossRef CAS.
- X. Zhang, Z. Xing, L.-L. Wang, Y.-C. Zhu, Q.-W. Li, J.-W. Liang, Y. Yu, T. Huang, K.-B. Tang and Y.-T. Qian, J. Mater. Chem., 2012, 22, 17864–17869 RSC.
- M. Toupin, T. Brousse and D. Bélanger, Chem. Mater., 2004, 16, 3184–3190 CrossRef CAS.
- R. C. Lee, Y.-P. Lin, Y.-T. Weng, H.-A. Pan, J.-F. Lee and N.-L. Wu, J. Power Sources, 2014, 253, 373–380 CrossRef CAS.
- S. Wang, Y. Ren, G. Liu, Y. Xing and S. Zhang, Nanoscale, 2014, 6, 3508–3512 RSC.
- B. Sun, Z. Chen, H. S. Kim, H. Ahn and G. Wang, J. Power Sources, 2011, 196, 3346–3349 CrossRef CAS.
- Y. Sun, X. Hu, W. Luo, F. Xia and Y. Huang, Adv. Funct. Mater., 2013, 23, 2436–2444 CrossRef CAS.
- J. Guo, Q. Liu, C. Wang and M. R. Zachariah, Adv. Funct. Mater., 2012, 22, 803–811 CrossRef CAS.
- Y. Sun, X. Hu, W. Luo and Y. Huang, J. Mater. Chem., 2012, 22, 19190 RSC.
| This journal is © The Royal Society of Chemistry 2017 |

