
 Open Access Article
 This Open Access Article is licensed under a Creative Commons Attribution-Non Commercial 3.0 Unported Licence
Cytotoxic neolignans from the traditional Chinese medicine Daphniphyllum macropodum Miq.†
Xinhua Ma‡
a,
Jie Yang‡a,
Christopher L. Brownb,
Chao Wangb,
Shihao Denga,
Ruifang Kea,
Shicheng Xua,
Mi Huanga,
Xinzhou Yang*a and
Yunjiang Feng *b
*b
aSchool of Pharmaceutical Sciences, South-Central University for Nationalities, Wuhan 430074, China. E-mail: xzyang@mail.scuec.edu.cn; Fax: +86-27-67841196; Tel: +86-27-67841196
bGriffith Institute for Drug Discovery, School of Natural Sciences, Griffith University, Brisbane, QLD 4111, Australia. E-mail: y.feng@griffith.edu.au; Fax: +61-7-37356000; Tel: +61-7-37358367
First published on 16th November 2017
Abstract
Four new neolignans, (E)-3-(hydroxymethyl)-2-(4-hydroxyphenyl)-5-(prop-1-en-1-yl)benzofuran-6-ol (1), methyl (E)-6-hydroxy-2-(4-hydroxyphenyl)-5-(prop-1-en-1-yl)benzofuran-3-carboxylate (2), (R)-4-hydroxy-3-(1-(4-hydroxyphenyl)propan-2-yl)benzaldehyde (3) and methyl (E,R)-3-(4-hydroxy-3-(1-(4-hydroxyphenyl)propan-2-yl)phenyl)acrylate (4) were isolated from the seeds of Daphniphyllum macropodum Miq, together with four known compounds. The structures of the new compounds were established by spectroscopic analyses, including 1D and 2D NMR as well as HRESIMS data. The absolute configurations of 3 and 4 were determined by the comparison of experimental and calculated electronic circular dichroism (ECD) spectra. All the compounds were evaluated for their antiproliferative activity on human NSCLC A549 and H460 cell lines. Compound 2 significantly inhibited the cancer cell growth in a dose-dependent manner. Mechanism of the action studies showed that 2 increased the expression of bax, caspase-3 and caspase-9, and decreased the production of bcl-2, suggesting that 2 induced apoptosis in A549 cells through activating the mitochondrial pathway.
Introduction
Cancer is one of the most fatal diseases globally. Nearly 14.1 million new cases were diagnosed in 2012 and the number is predicted to rise up to 19.3 million by 2025.1 Lung cancer is the most frequently diagnosed malignancy with a high mortality rate. Chemotherapies using, for example, compounds such as cisplatin, are still the common mode of treatment for lung cancer patients, albeit with limited success. Additionally, the clinical use of chemotherapeutic agents is commonly associated with severe side effects and lack of selectivity.2 There has been growing interest in identifying novel drug candidates with apoptosis-inducing properties.3,4 Particularly, several natural products obtained from plants and used in Chinese herbal medicines are showing results as promising antitumor agents, as they demonstrate low systemic toxicity and accordingly show great medicinal value.As part of our continuing research into the discovery of new bioactive leads from traditional Chinese medicines (TCM),5–7 a prefractionated TCM extract library were screened against two human lung cancer cell lines NSCLC A549 and H460. The activity results suggested that the EtOAc extract of the TCM “Jiao Rang Mu” (seeds of Daphniphyllum macropodum Miq.) displayed promising cytotoxic activity. Daphniphyllum macropodum Miq. (Daphniphyllaceae), an evergreen tree native to southern China, grows at an altitude of 1000–1700 meters.8 The plant has been traditionally used to treat symptoms such as inflammation, pyreticosis, and influenza.9 Previous phytochemical investigations on this plant revealed that it mainly contained molecules related to the daphniphylline skeleton series of alkaloids.10–12
Bioassay-guided fractionation of the active extract resulted in the isolation of four new neolignans, (E)-3-(hydroxymethyl)-2-(4-hydroxyphenyl)-5-(prop-1-en-1-yl)benzofuran-6-ol (1), methyl (E)-6-hydroxy-2-(4-hydroxyphenyl)-5-(prop-1-en-1-yl)benzofuran-3-carboxylate (2), (R)-4-hydroxy-3-(1-(4-hydroxyphenyl)propan-2-yl)benzaldehyde (3) and methyl (E,R)-3-(4-hydroxy-3-(1-(4-hydroxyphenyl)propan-2-yl)phenyl)acrylate (4), along with four known compounds (5–8) (structures shown in Fig. 1). Herein we report the isolation, structure elucidation for compounds 1–4. We also discuss the antiproliferative activity of the compounds against two human lung cancer cell lines, NSCLC A549 and H460, as well as the possible molecular mechanism for apoptosis induced by compound 2 through activation of the mitochondrial pathway in human A549 cells.
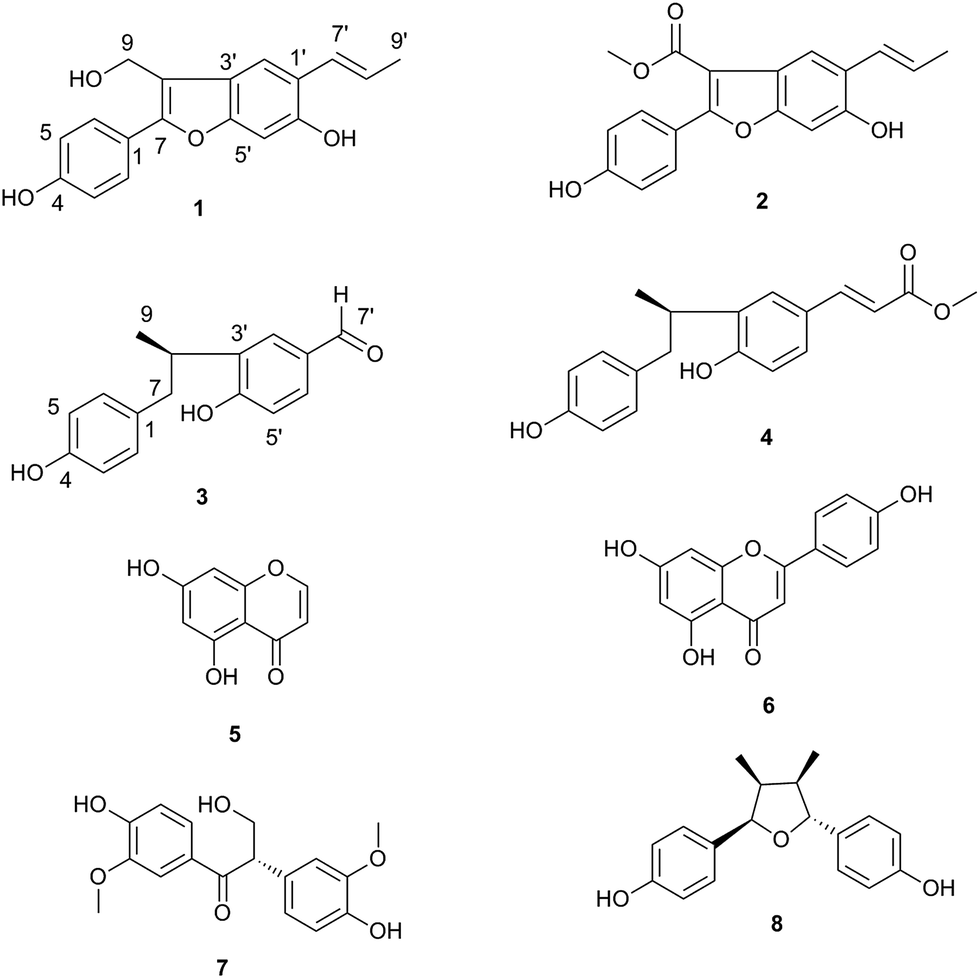 | ||
| Fig. 1 Structures of compounds 1–8. | ||
Results and discussion
Compound 1 was isolated as a white solid, and HRESIMS mass spectrometry revealed a pseudomolecular ion at m/z 295.0986 [M − H]− (calcd for C18H15O4, 295.0976), in agreement with the proposed molecular formula of C18H16O4. The analysis of the 1H NMR spectrum (Table 1) showed two sets of aromatic rings due to a 1,4-disubstituted aromatic ring (δ 7.64, 2H, d, J = 8.4 Hz, H-2, H-6; 6.90, 2H, d, J = 8.4 Hz, H-3, H-5) and a 1,2,4,5-tetrasubstituted aromatic system (δ 7.63, s, H-2′; 6.87, s, H-5′). Two olefinic protons (δ 6.77, dd, J = 1.8, 15.8 Hz, H-7′; 6.24, dq, J = 6.7, 15.8 Hz, H-8′) and one methyl (δ 1.91, dd, J = 1.8, 6.7 Hz, H-9′) were also observed. Moreover, correlations in the 1H–1H COSY and HSQC spectra indicated the presence of a –CH(7′) = CH(8′)–CH3(9′) (bold line in Fig. 2). The observed HMBC correlations, from H-2 and H-6 to C-7, from H-7′ to C-2′ and C-6′, and from H-8′ and H-9′ to C-1′, indicated that C-7′ was linked to C-1′, similar to a neolignan eupomatenoid 13.13 The key structural differences arose from the replacement of a methyl at C-8 with a hydroxymethyl in 1 and a methoxy at C-5′ with a hydrogen in 1. These observations were confirmed by the HMBC correlations from H-9 to C-3′, C-7 and C-8, and from H-2′, H-5′ and H-7′ to C-6' (δC 153.8). Accordingly, the structure of 1 was elucidated as (E)-3-(hydroxymethyl)-2-(4-hydroxyphenyl)-5-(prop-1-en-1-yl)benzofuran-6-ol.| No. | 1 | 2 | ||
|---|---|---|---|---|
| δCa,b | δHa,c (J in Hz) | δCa,b | δHa,c (J in Hz) | |
| a In CD3OD.b At 150 MHz.c At 600 MHz. | ||||
| 1 | 123.5 | 122.3 | ||
| 2 | 129.5 | 7.64 (d, 8.4) | 131.9 | 7.86 (d, 8.7) |
| 3 | 116.5 | 6.90 (d, 8.4) | 115.9 | 6.88 (d, 8.7) |
| 4 | 159.1 | 160.5 | ||
| 5 | 116.5 | 6.90 (d, 8.4) | 115.9 | 6.88 (d, 8.7) |
| 6 | 129.5 | 7.64 (d, 8.4) | 131.9 | 7.86 (d, 8.7) |
| 7 | 153.8 | 161.5 | ||
| 8 | 114.3 | 107.9 | ||
| 9 | 55.5 | 4.81 (s) | 166.4 | |
| 1′ | 123.5 | 124.8 | ||
| 2′ | 117.2 | 7.63 (s) | 120.0 | 7.91 (s) |
| 3′ | 123.7 | 120.8 | ||
| 4′ | 155.22 | 154.4 | ||
| 5′ | 98.1 | 6.87 (s) | 97.9 | 6.91 (s) |
| 6′ | 153.8 | 154.8 | ||
| 7′ | 127.7 | 6.77 (dd, 1.8, 15.8) | 127.6 | 6.77 (dd, 1.8, 15.8) |
| 8′ | 125.0 | 6.24 (dq, 6.7, 15.8) | 125.8 | 6.26 (dq, 6.6, 15.8) |
| 9′ | 19.0 | 1.91 (dd, 1.8, 6.7) | 19.0 | 1.92 (dd, 1.8, 6.6) |
| OCH3 | 51.9 | 3.93 (s) | ||
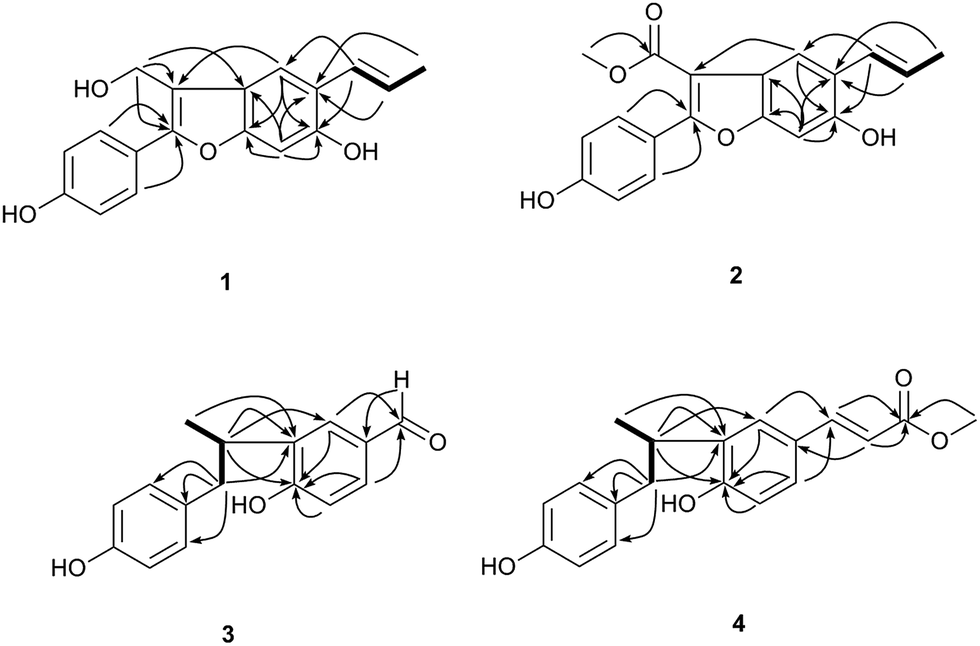 | ||
| Fig. 2 Key COSY (▬) and HMBC (→) of compounds 1–4. | ||
Compound 2 was isolated as a white solid. The HRESIMS showed a [M − H]− molecular ion at m/z 323.0933 (calcd for C19H15O5, 323.0925), in agreement with the molecular formula C19H16O5. The 1H and 13C NMR spectra (Table 1) of compounds 1 and 2 were almost identical. The only difference was the replacement of a hydroxymethyl at C-8 in 1 by a methyl ester functional group (δH 3.93, s, δC 51.9, –OCH3; δC 166.4, C-9) in 2. The assignment was confirmed by the HMBC correlations from 9-methoxyl (δ 4.81, s) to C-9 and from H-2′ to C-8 (Fig. 2). Therefore, compound 2 was elucidated as methyl (E)-6-hydroxy-2-(4-hydroxyphenyl)-5-(prop-1-en-1-yl)benzofuran-3-carboxylate.
Compound 3 was also isolated as a white solid. The molecular formula was determined to be C16H16O3 by the HRESIMS at m/z 255.1021 [M − H]− (calcd for C16H15O3, 255.1027). The 1H NMR spectral analysis (Table 2) showed a 1,4-disubstituted aromatic system (δ 6.93, 2H, d, J = 8.5 Hz, H-2, H-6; 6.63, 2H, d, J = 8.5 Hz, H-3, H-5) and a 1,2,4-trisubstituted aromatic ring (δ 7.67, d, J = 2.1 Hz, H-3′; 7.58, dd, J = 2.1, 8.3 Hz, H-5′; 6.88, d, J = 8.3 Hz, H-6′). It also displayed one methine (δ 3.41, m, H-8), one methylene (δ 2.91, dd, J = 6.2, 13.4 Hz, H-7α; 2.62, dd, J = 8.4, 13.4 Hz, H-7β), one methyl (δ 1.19, d, J = 7.0 Hz, H-9) and an aldehyde (δ 9.72, s) groups in 3. The 1H–1H COSY and HSQC spectra showed that it contained a –CH2(7)–CH(8) (CH3) (9)– moiety (bold in Fig. 2). The observed HMBC correlations from H-7 to C-1, C-2(6), and C-4′ and from H-8 to C-2′, C-3′, and C-4′ indicated that C-7 and C-8 were attached at C-1 and C-3′, respectively (Fig. 2). Furthermore, the key HMBC correlations from H-7′ to C-1′ and from H-2′, H-6′ to C-7′ suggested that C-7′ was located at C-1′ position. Further HMBC correlations from H-2′, H-5′ and H-6′ to C-4′ (δC 162.7) suggested that a hydroxy was located at C-4′ (Fig. 2). Accordingly, the planar structure of 3 was elucidated as 4-hydroxy-3-(1-(4-hydroxyphenyl)propan-2-yl) benzaldehyde.
| No. | 3 | 4 | ||
|---|---|---|---|---|
| δca,b | δHa,c (J in Hz) | δca,b | δHa,c (J in Hz) | |
| a In CD3OD.b At 150 MHz.c At 600 MHz. | ||||
| 1 | 133.1 | 133.3 | ||
| 2 | 131.1 | 6.93 (d, 8.5) | 131.1 | 6.95 (d, 8.5) |
| 3 | 115.8 | 6.63 (d, 8.5) | 115.8 | 6.65 (d, 8.5) |
| 4 | 156.4 | 156.4 | ||
| 5 | 115.8 | 6.63 (d, 8.5) | 115.8 | 6.65 (d, 8.5) |
| 6 | 131.1 | 6.93 (d, 8.5) | 131.1 | 6.95 (d, 8.5) |
| 7 | 43.0 | 2.91 (dd, 6.2, 13.4) | 43.1 | 2.92 (dd, 6.0, 13.4) |
| 2.62 (dd, 8.4, 13.4) | 2.63 (dd, 8.4, 13.4) | |||
| 8 | 35.8 | 3.41 (m) | 35.9 | 3.36 (m) |
| 9 | 19.7 | 1.19 (d, 7.0) | 19.7 | 1.18 (d, 7.0) |
| 1′ | 130.2 | 127.0 | ||
| 2′ | 130.7 | 7.67 (d, 2.1) | 129.0 | 7.32 (d, 2.2) |
| 3′ | 135.6 | 135.2 | ||
| 4′ | 162.7 | 158.8 | ||
| 5′ | 116.3 | 6.88 (d, 8.3) | 116.4 | 6.78 (d, 8.4) |
| 6′ | 131.1 | 7.58 (dd, 2.1, 8.3) | 128.3 | 7.28 (dd, 2.2, 8.4) |
| 7′ | 193.3 | 9.72 (s) | 147.2 | 7.61 (d, 16.0) |
| 8′ | 114.4 | 6.29 (d, 16.0) | ||
| 9′ | 169.9 | |||
| OCH3 | 52.0 | 3.77 (s) | ||
Compound 4 was obtained as a white solid. The molecular formula was deduced as C19H20O4 based on HRESIMS measurement at m/z 311.1296 [M − H]− (calcd for C19H19O4, 311.1289). The 1H and 13C NMR spectra (Table 2) of 4 were almost identical to those of 3. Nevertheless, 4 contained an additional acrylate methyl moiety (δH 7.61, d, J = 16.0 Hz, H-7′; 6.29, d, J = 16.0 Hz, H-8′; 3.77, s, 9′-methoxy) replacing the aldehyde group observed in 3, evidenced by the combined analyses of 1H NMR, 13C NMR and HSQC spectra of 4. In particular, long-range HMBC correlations were observed from H-7′, H-8′ and the methoxy (δH 3.77) to C-9′ (δC 169.9). Key HMBC correlations from H-7′ to C-2′ and C-6′ as well as from H-8′ to C-1′ confirmed the linkage between the acrylate methyl moiety and C-1′ (Fig. 2). Therefore the planar structure of compound 4 was elucidated as methyl (E)-3-(4-hydroxy-3-(1-(4-hydroxyphenyl)propan-2-yl)phenyl) acrylate.
The absolute configurations of 3 and 4 could be deduced from their optical rotations and electronic circular dichroism (ECD) spectra. Being structurally similar to the known neolignan 1-deoxycarinatone,14 both compounds had only one chiral centre (C-8) which determined the chiroptical properties of the whole molecule. Since the S enantiomer of 1-deoxycarinatone was reported to exhibit a positive optical sign ([α]25D +33.3, c 0.6, CHCl3),14 the negative optical rotations of [α]25D −15.6 (c 0.22, CHCl3) for 3 and [α]25D −4.5 (c 0.06, CHCl3) for 4 should be an indication of their R configurations. This deduction was consistent with the TDDFT-ECD calculation results where the calculated ECD spectra of R enantiomers matched well with the experimental values (Fig. 3a and 3b). Thus, the absolute configurations at C-8 in 3 and 4 were assigned as R.
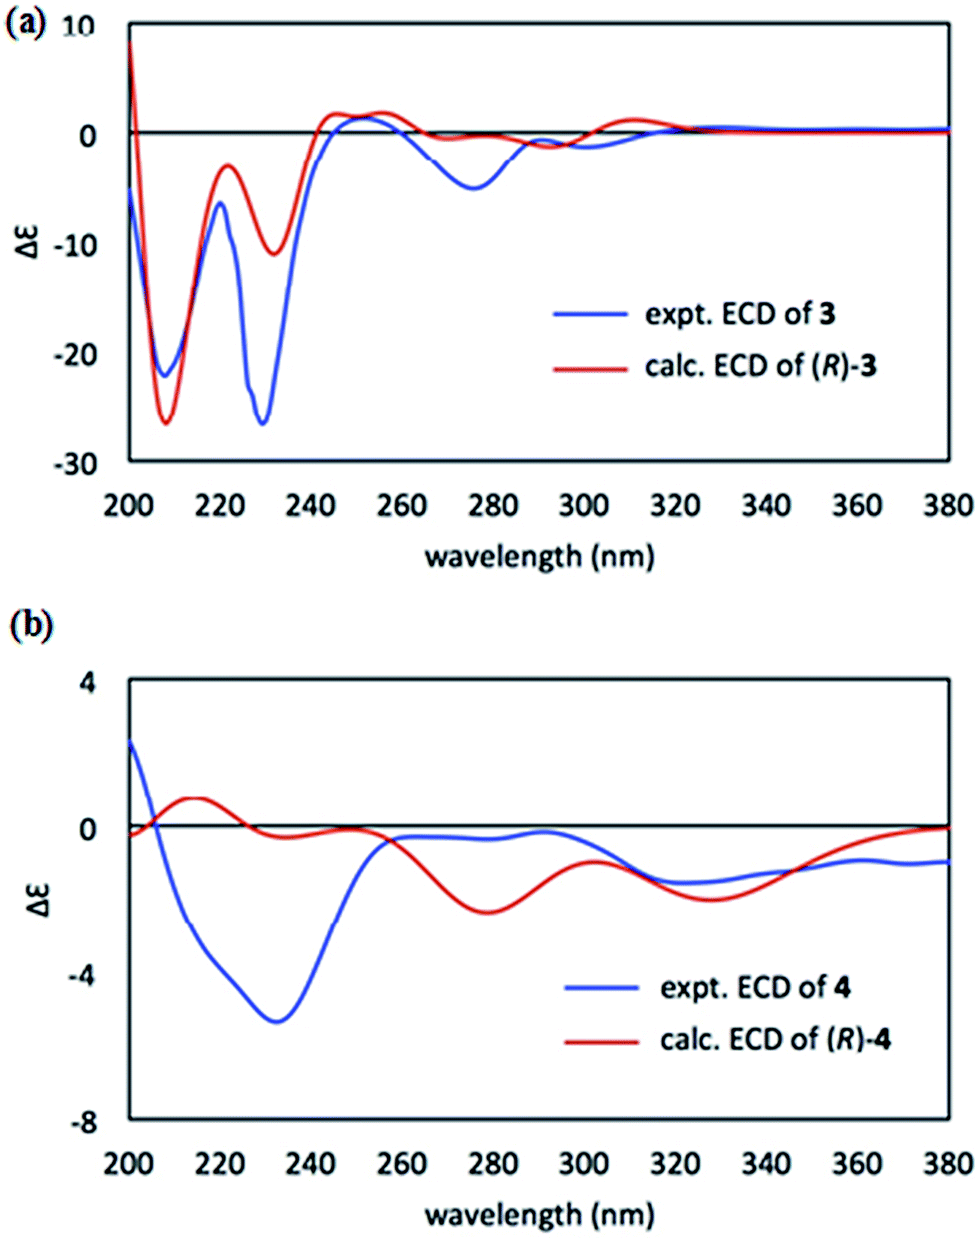 | ||
| Fig. 3 Experimental and calculated ECD spectra of 3 and 4. (a) Boltzmann-weighted calculated (R) and experimental ECD spectra of 3. Gaussian band-width 0.16 eV. (b) Boltzmann-weighted calculated (R) and experimental ECD spectra of 4. Gaussian band-width 0.25 eV. | ||
On the basis of 1D, 2D NMR and MS data, the other four known compounds were identified as 5,7-dihydroxychromone (5),15 apigenin (6),16 evofolin B (7),17 and larreatricin (8).18
The antiproliferative activity of compounds 1–8 was evaluated against human lung cancer cell lines NSCLC A549 and H460.19 Preliminary toxicity was also investigated against the human bronchial epithelial cell line, BEAS-2B. All compounds exhibited anticancer activity against both A549 and H460 cell lines with IC50 values ranging from 12 to 63 μg mL−1. Most of the compounds did not show cytotoxic activity against BEAS-2B cell line at the concentration of up to 100 mg mL−1, except for 1 and 2 (Table 3). Compound 2 displayed more potent inhibition against A549 cells than the positive control CDDP (IC50 = 12.69 ± 2.74 verses 19.88 ± 3.21 μg mL−1) with lower toxic effects against BEAS-2B cells (IC50 values = 66.19 ± 6.47 verses 13.71 ± 1.86 μg mL−1 for CDDP) (Table 3, Fig. 4A). This result encouraged us to investigate the molecular mechanism of 2. In brief, the NSCLC A549 cells were treated with compound 2 (10, 20, 30, 40 μg mL−1) and CDDP (25 μg mL−1). After 12, 24 and 48 h of incubation, cell viability and cytotoxicity were tested, and the results were showed in Fig. 4A and B. Moreover, to validate whether compound 2 suppressed cell viability in a dose-dependent manner, A549 cells were co-incubated with 2 (0, 10, 20 μg mL−1) and CDDP (25 μg mL−1). The influence (such as distortion, membrane blebbing and shrinkage) of compound 2 on the A549 cell morphology was performed by a phase contrast microscope and Hoechst 33258 staining. Our results indicated that a large proportion of cells became round in shape and necrotic. By comparison, cells in the untreated group grew well with clear cytoskeletons (Fig. 4C). Microscopy also revealed that the numbers of cells that shrunk and subsequently peeled from the culture plate were significantly larger when treated with compound 2 (Fig. 4D). Consequently, compound 2 resulted in an enhanced and dose-dependent induction of apoptosis in A549 cells.
| Compound code | Cell lines | ||
|---|---|---|---|
| A549 | H460 | BEAS-2B | |
| 1 | 27.84 ± 4.56 | 34.65 ± 5.94 | 81.52 ± 7.95 |
| 2 | 12.69 ± 2.74 | 25.72 ± 3.69 | 66.19 ± 6.47 |
| 3 | 36.28 ± 3.85 | 44.74 ± 6.62 | >100 |
| 4 | 34.39 ± 4.10 | 51.08 ± 7.15 | >100 |
| 5 | 46.01 ± 9.67 | 62.58 ± 8.36 | >100 |
| 6 | 43.34 ± 5.18 | 53.21 ± 7.67 | >100 |
| 7 | 57.67 ± 7.11 | 45.61 ± 5.37 | >100 |
| 8 | 39.78 ± 5.38 | 37.55 ± 4.36 | >100 |
| CDDP | 19.88 ± 3.21![[thin space (1/6-em)]](https://www.rsc.org/images/entities/char_2009.gif) |
31.95 ± 4.58 | 13.71 ± 1.86 |
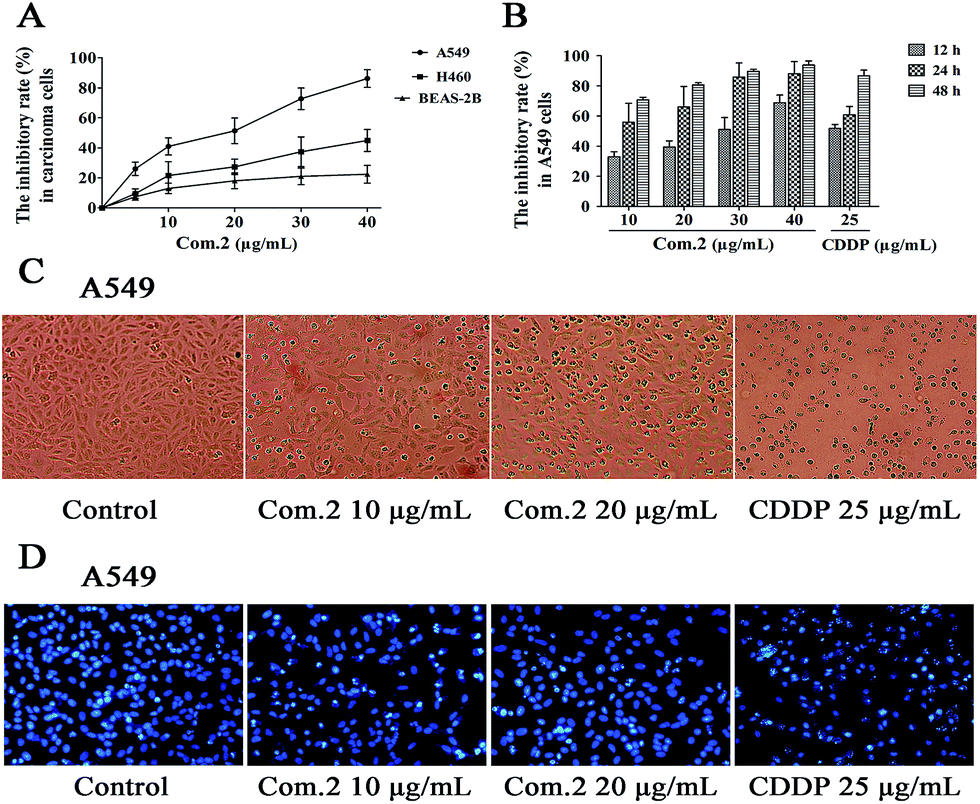 | ||
| Fig. 4 Compound 2 dose- and time-dependently provoked A549 cells apoptosis in vitro. (A) Cell viability and cytotoxicity was determined using the MTT. (B) A549 cells were treated with indicated concentrations of A549. After 12, 24, 48 h, cell apoptosis was examined by MTT. (C, D) Cells were seeded at a density of 1 × 10⁵–4 × 10⁵ cells per mL in 6-well polystyrene culture plates at 37 °C with 5% (v/v) CO2 for one day. After 24 h of incubation, cells were incubated with variable concentrations of compound 2 and CDDP for 24 h. Changes in nuclear morphology was observed by phase contrast microscope and fluorescence microscopy after staining with Hoechst 33258. Chromatin condensation and nuclear fragmentation were considered to indicate apoptotic cells. | ||
Cell cycle arrest is known as a stopping point in the cell cycle transition such as G0, G1, S and G2/M phases for cell duplication and division. To confirm the effect of 2 on cell death and cell cycle arrest in cancer cells, A549 cells were treated with various concentrations of 2 for 24 h. The cells were stained with propidium iodide, and cell–cycle activity was analyzed using flow cytometry. As shown in Fig. 5A, 2 increased sub-G1 population up to 24.20% and 34.90% at the concentrations of 10 μg mL−1 and 20 μg mL−1, respectively, compared with untreated control (0.38%) in A549 cells.
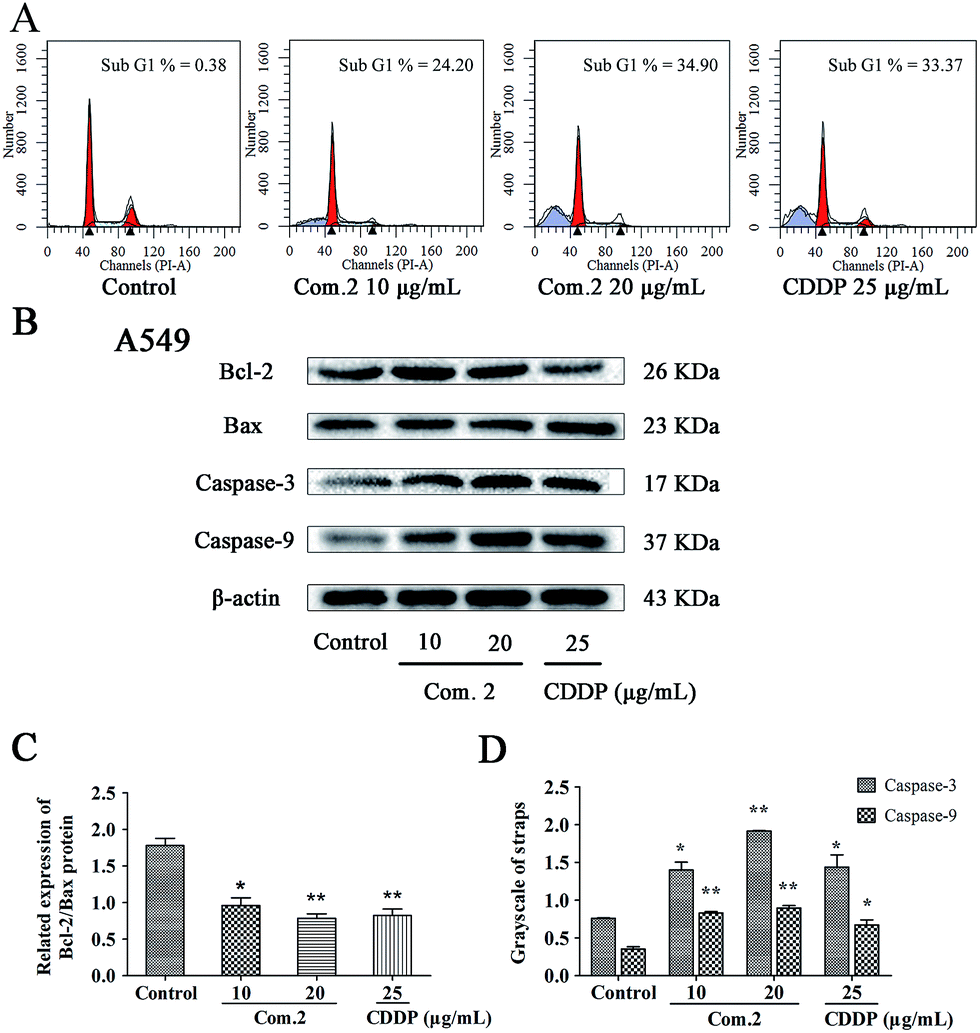 | ||
| Fig. 5 Compound 2 dose-dependently provoked A549 cells apoptosis in vitro. (A) A549 cells were treated with compound 2 for 24 h. Then, cell cycle distribution was observed by FACS. (B–D) Compound 2 activated mitochondrial pathway in vitro. (B) Compound 2 activated mitochondrial pathway in vitro. Bcl-2, bax, caspase-3 and caspase-9 were assessed by western blot analysis. β-actin was used as an internal control. In A549 cells, expression of interacting protein was detected. (C, D) Bar graphs showed the expression of bcl-2/bax, caspase 3 and caspase 9 in A549 cells. The data are shown as the means ± SD of three independent experiments. *P < 0.05 compared to control, **P < 0.01 compared to control, ***P < 0.001, compared to control. | ||
Encouraged by our results, the effect of apoptosis-related proteins of bcl-2, bax, caspase-3 and caspase-9 by compound 2 were evaluated by western blotting analysis. Following treatment with compound 2 the expression of bax, caspase-3 and caspase-9 were clearly increased, whereas cellular production of bcl-2 decreased when compared with the control (Fig. 5B–D). These results suggest that compound 2 induced apoptosis in A549 cells is mediated by intracellular mitochondrial dysfunction.
Conclusions
In summary, we have reported the isolation of four new neolignans 1–4, along with four known compounds which were isolated from the seeds of Daphniphyllum macropodum Miq. All compounds were evaluated for their cellular antiproliferative activity against human NSCLC A549 and H460 cell lines with different concentrations of each test compound for 24 h by MTT assay using CDDP as the positive control. The in vitro biological evaluation result showed that the neolignan based compound 2, can function as an antimitotic agent and inhibit cell proliferation by increasing the cell cycle within the sub-G1 phase and inducing cell death via apoptosis. Furthermore, western blotting analysis indicated that 2 dose-dependently upregulated the activities of bax, caspase-9 and caspase-3, and downregulated the expression of bcl-2. These findings provide important information for the development of compound 2 for use in the study of A549 cells.Experimental section
General experimental procedures
Semi-preparative HPLC was carried out on a Waters 2535 HPLC fitted with a 2998 photodiode array Detector and a 2707 autosampler (Waters). Separations were performed on two Waters Sunfire™ C18 columns (5 μm, 10 × 150 mm; 5 μm, 19 × 250 mm) (Waters, Ireland). Direct injection ESIMS and LC-PDA-ESIMS analyses were recorded on a Waters ACQUITY SQD MS system (Waters, USA) connected to a Waters 1525 HPLC with a 2998 photodiode array Detector (Waters, USA). The NMR spectra were recorded on an AVANCE III 600 MHz spectrometer (Bruker BioSpin, Germany). Optical rotations were recorded on a Jasco P-1020 polarimeter (JASCO, Japan). CD spectra were recorded on a JASCO J-810W spectrophotometer (JASCO, Japan). UV and IR spectra were recorded on a Hewlett-Packard 8452A diode array spectrophotometer (Agilent, USA) and a Nicolet Magna FT-IR 750 spectrometer (Nicolet, USA), respectively.Plant material
The seeds of Daphniphyllum macropodum Miq. were collected in February 2012 in Wufeng county, Hubei province, China and identified by Prof. Dingrong Wan, School of Pharmaceutical Sciences, South-Central University for Nationalities (SCUN). A voucher specimen (SC0138) is deposited in School of Pharmaceutical Sciences, SCUN, Wuhan, China.Extraction and isolation
The air-dried and powdered seeds of D. macropodum (2.5 kg) were percolated with 80% EtOH at room temperature. The ethanol extract was filtered and concentrated under reduced pressure. The resulting extract was suspended in H2O and partitioned successively with petroleum ether (60–90 °C), EtOAc and n-BuOH (4 × 5000 mL). The EtOAc fraction (25 g) was subjected to a normal-phase silica gel column chromatography eluted with CHCl3–CH3OH (100:1 to 0:1, containing 0.1% formic acid) to give eight major fractions (Fr. 1–Fr. 8). Fr. 3 was subjected to a sephadex LH-20 CC (CH2Cl2–MeOH, 1:1, containing 0.1% formic acid) to afford four fractions Fr. 3-1–Fr. 3-4. Fr. 3-3 was purified by semipreparative HPLC (H2O–CH3CN, 90:10 to 0:100, 40 min, containing 0.1% formic acid in both phase) to give compound 5 (8.8 mg). Fr. 4 was separated into five major parts Fr. 4-1–Fr. 4-5 with a sephadex LH-20 gel column (MeOH with 0.1% formic acid). Fr. 4-1 was purified by semi-preparative HPLC (H2O–CH3CN, 90:10 to 0:100, 40 min, containing 0.1% formic acid in both phases) to afford compound 1 (5.3 mg). Fr. 4-2 was purified by semi-preparative HPLC (H2O–CH3CN, 90:10 to 0:100, 40 min, containing 0.1% formic acid in both phases) to afford compound 7 (8.3 mg), 4 (3.1 mg). Fr. 4-4 was purified by semi-preparative HPLC (H2O–CH3CN, 90:10 to 0:100, 40 min, containing 0.1% formic acid in both phases) to afford compound 2 (8.1 mg). Fr. 5 was purified on a normal-phase silica gel column chromatography (CHCl3–CH3OH, 20:1 to 0:1, containing 0.1% formic acid) to afford compound 8 (7.6 mg) and other three fractions Fr. 5-1–Fr. 5-3. Fr. 5-1 was purified by semi-preparative HPLC (H2O–CH3CN, 90:10 to 0:100, 40 min, containing 0.1% formic acid) to afford compound 3 (4.2 mg). Fr. 7 was subjected to a sephadex LH-20 gel column (CH2Cl2–MeOH, 1:1, containing 0.1% formic acid) to afford three fractions Fr. 7-1–Fr. 7-3. Fr. 7-1 was purified by semipreparative HPLC (H2O–CH3CN, 90:10 to 0:100, 40 min, containing 0.1% formic acid in both phases) to give compound 6 (7.3 mg).
Computation section
Conformational searches based on the Monte Carlo (MCMM) method in the gas phase were carried out using MacroModel package (Schrödinger20) with the OPLS_2005 force field. Stable conformers (within 5 kcal mol−1) were saved and optimized at the B3LYP/6-31G(d) level with the IEFPCM solvation model for methanol by Gaussian 09 program.21 The DFT optimized conformers with populations greater than 1% were used as input for TDDFT ECD calculations in methanol at the B3LYP(IEFPCM)/SVP level including 50 excited states per molecule. The ECD spectra were generated using the program SpecDis22 by applying a Gaussian band shape with 0.16–0.25 eV exponential half-width from dipole-length rotational strengths. The calculated spectra were blue-shifted by 14 nm to facilitate comparison with the experimental data.Cell culture
The NSCLC A549, H460 and human bronchial epithelial (BEAS-2B) cell lines were purchased from the American Type Culture Collection (ATCC; Manassas, VA, USA), and cultured as recommended as monolayers in DMEM medium (GibcoBRL Life Technologies, Grand Island, NY) supplemented with 10% fetal bovine serum (FBS; GibcoBRL Life Technologies) and 1% penicillin–streptomycin–neomycin (GibcoBRL Life Technologies), in a humidified incubator at 37 °C in a 5% CO2/95% air.Cell viability assay
Cell viability of A549, H460 and BEAS-2B was analyzed using 3-(4,5-dimethylthiazol-2-yl)-2,5-diphenyltetrazolium bromide (MTT) assay.23,24 Cells were seeded in 96-well plates at a density of 1000–1500 cells per well and were treated with 5 compounds at the indicated dose of 200 μg mL−1 dissolved in DMSO. After 24 h, 100 uL of MTT solution (5 mg mL−1) per well was added to each cultured medium, which was incubated for another 4 h. Then, DMSO (150 μL) was added to each well and the plates were shaken for 10 min at room temperature. After 10 min, the OD of each well was measured on a Microplate Reader (BIO-RAD) at the wavelength of 472 nm. Then compound 2 was selected for further analysis. Subsequently, cells were incubated in the test compound at 10, 20, 30, 40 and 25 μg mL−1 CDDP containing 1‰ DMSO for 12, 24 and 48 h, respectively. And then supernate was abandoned and 100 μL of MTT (5 mg mL−1) was subjected to each well and incubated cells for 4 h. The resulting crystals were dissolved in 150 μL DMSO. (Bio-Rad Laboratories Ltd, China). Inhibitory rate (%) = [(A492 control − A492 sample)/A492 control] × 100%.25Observation of cell morphology and Hoechst 33258 staining
The A549 cells were seeded into 6-well culture plates with a density of 1 × 10⁵–4 × 10⁵ cells. After 24 h incubation, the cells were treated with compound 2 (0, 10, 20 μg mL−1) and 25 μg mL−1 CDDP. Subsequently, a phase contrast microscope (Leica, Nussloch, Germany) was used to observe the cellular morphological changes. After staining with Hoechst 33258, and apoptotic nuclear morphology was observed.26 The A549 cell were seeded in 6-well plates and incubated for 24 h with a density of 1 × 10⁵–4 × 10⁵ cells per well. The cells were exposed to compound 2 (0, 10, 20 μg mL−1) and 25 μg mL−1 CDDP. After discarding the supernatant, 1.0 mL of stationary liquid (methanol:acetic acid = 3:1) were covered for about 30 min., after which a Hoechst 33258 solution (5 μg mL−1) was added to the wells and the system left to equilibrate for 30 min. The cells were then examined under a fluorescence microscope (Leica Microsystems, Wetzlar, Germany).
Cell cycle analysis
Cell cycle analysis was performed by propidium iodide (PI) staining. Cells were fixed in 75% ethanol, incubated with 0.1% RNase A in PBS at 37 °C for 30 min and resuspended in PBS containing 25 μg mL−1 PI for 30 min at room temperature. The stained cells were analyzed for DNA content by FACSCalibur (Becton Dickinson, Franklin Lakes, NJ, USA) using Cell Quest program (Becton Dickinson, Franklin Lakes, NJ, USA).Western blot analysis
Cells were lysed in RIPA buffer (50 mM Tris–HCl, pH 7.4, 150 mM NaCl, 1% NP-40, 0.25% sodium deoxycholic acid, 1 M EDTA, 1 mM Na3VO4, 1 mM NaF and protease inhibitors cocktail). Protein samples were quantified by using a Bio-Rad DC protein assay kit II (Bio-Rad, Hercules, CA), separated by electrophoresis on 8–15% SDS-PAGE gel and electro transferred onto a Hybond ECL transfer membrane (Amersham Pharmacia, Piscataway, NJ). After blocking with 3–5% nonfat skim milk, the membrane was probed with antibodies for β-actin, bcl-2, bax, caspase 3 and caspase 9 (Cell Signaling Technology, Danvers, MA) followed by exposure to horseradish peroxidase (HRP)-conjugated secondary anti-mouse or rabbit antibodies (Cell Signaling Technology, Danvers, MA). Protein expression was determined by using enhanced chemiluminescence (ECL) system (Amersham Pharmacia, Piscataway, NJ, USA).Conflicts of interest
There are no conflicts to declare.Acknowledgements
We acknowledge National Natural Science Foundation of China grants (81573561 and 81102798), Key Projects of Technological Innovation of Hubei Province (No. 2016ACA138) and Hubei Provincial Training Programs of Innovation and Entrepreneurship for Undergraduates (SCX15025) for financial support. We thank Analytical & Measuring Center of School of Pharmaceutical Sciences from South-Central University for Nationalities for spectroscopic data.Notes and references
- Z. Z. Li, H. Su, W. W. Yu, X. J. Li, H. Cheng, M. Y. Liu, X. F. Pang and X. Z. Zou, Org. Biomol. Chem., 2016, 14, 277–287 CAS.
- M. Chidambaram, R. Manavalan and K. Kathiresan, J. Pharm. Pharm. Sci., 2011, 14, 67–77 Search PubMed.
- M. J. Thun, S. J. Henley and C. Patrono, J. Natl. Cancer Inst., 2002, 94, 252–266 CrossRef CAS PubMed.
- A. S. Abu-Surrah and M. Kettunen, Curr. Med. Chem., 2006, 13, 1337–1357 CrossRef CAS PubMed.
- C. Wang, J. Yang, P. Zhao, Q. Zhou, Z. N. Mei, G. Z. Yang, X. Z. Yang and Y. J. Feng, Bioorg. Med. Chem. Lett., 2014, 24, 3096–3099 CrossRef CAS PubMed.
- X. Z. Yang, C. Wang, J. Yang, D. R. Wan, Q. X. Lin, G. Z. Yang, Z. N. Mei and Y. J. Feng, Tetrahedron Lett., 2014, 55, 5632–5634 CrossRef CAS.
- X. Z. Yang, M. Huang, J. Y. Cai, D. Lv, J. N. Lv, S. J. Zheng, X. H. Ma, P. Zhao and Q. Wang, Nat. Prod. Res., 2016, 31, 1150–1155 CrossRef PubMed.
- S. X. Fu, J. H. Zheng, Q. H. Liu, Q. S. Wang, S. F. Zhang, Z. Zheng, Y. Z. Long, N. Z. Wang, S. Y. Wang, Z. H. Jiang and R. H. Huang, Flora Hubeiensis, Hubei Science & Technology Press, Wuhan, 2002 Search PubMed.
- Editorial Committee of the Administration Bureau of Traditional Chinese Medicine in Chinese Materia, Zhonghua Bencao, Shanghai Science & Technology Press, Shanghai, 1998 Search PubMed.
- Y. Lu, K. Gao, X. Y. Wang, W. Zhang, N. Ma and H. F. Tang, Molecules, 2014, 19, 3055–3067 CrossRef PubMed.
- N. C. Kong, H. P. He, Y. H. Wang, S. Z. Mu, Y. T. Di and X. J. Hao, J. Nat. Prod., 2007, 70, 1348–1351 CrossRef CAS PubMed.
- M. M. Cao, Y. Zhang, H. P. He, S. F. Li, S. D. Huang, D. Z. Chen, G. H. Tang, S. L. Li, Y. T. Di and X. J. Hao, J. Nat. Prod., 2012, 75, 1076–1082 CrossRef CAS PubMed.
- H. Achenbach, J. Grob, X. A. Dominguez, G. Cano, J. V. Star, L. D. C. Brussolo, G. Muñoz, F. Salgado and L. López, Phytochemistry, 1987, 26, 1159–1166 CrossRef CAS.
- F. Li and X. W. Yang, Helv. Chim. Acta, 2007, 90, 1491–1496 CrossRef CAS.
- A. Simon, A. J. Chulia, M. Kaouadji and C. Delage, Phytochemistry, 1994, 36, 1043–1045 CrossRef CAS PubMed.
- J. J. Liang, J. L. Qi, L. Li, X. J. Jing and Z. Y. Wang, Chem. Nat. Compd., 2011, 47, 110–111 CrossRef CAS.
- T. S. Wu, J. H. Yeh and P. L. Wu, Phytochemistry, 1995, 40, 121–124 CrossRef CAS.
- S. G. A. Moinuddin, S. Hishiyama, M. H. Cho, L. B. Davin and N. G. Lewis, Org. Biomol. Chem., 2003, 1, 2307–2313 CAS.
- C. S. F. Cheung, K. K. W. Chung, J. C. K. Lui, C. P. Lau, P. M. Hon, J. Y. W. Chan, K. P. Fung and S. W. N. Au, Cancer Lett., 2007, 253, 224–235 CrossRef CAS PubMed.
- F. Mohamadi, N. G. J. Tichards, R. L. W. C. Guida, M. Lipton, C. Caufield, G. Chang, T. Hendrickson and W. C. Still, J. Comput. Chem., 1990, 11, 440–467 CrossRef CAS.
- M. J. Frisch, G. W. Trucks, H. B. Schlegel, G. E. Scuseria, M. A. Robb, J. R. Cheeseman, G. Scalmani, V. Barone, B. Mennucci, G. A. Petersson, H. Nakatsuji, M. Caricato, X. Li, H. P. Hratchian, A. F. Izmaylov, J. Bloino, G. Zheng, J. L. Sonnenberg, M. Hada, M. Ehara, K. Toyota, R. Fukuda, J. Hasegawa, M. Ishida, T. Nakajima, Y. Honda, O. Kitao, H. Nakai, T. Vreven, J. A. Montgomery Jr., J. E. Peralta, F. Ogliaro, M. Bearpark, J. J. Heyd, E. Brothers, K. N. Kudin, V. N. Staroverov, R. Kobayashi, J. Normand, K. Raghavachari, A. Rendell, J. C. Burant, S. S. Iyengar, J. Tomasi, M. Cossi, N. Rega, J. M. Millam, M. Klene, J. E. Knox, J. B. Cross, V. Bakken, C. Adamo, J. Jaramillo, R. Gomperts, R. E. Stratmann, O. Yazyev, A. J. Austin, R. Cammi, C. Pomelli, J. W. Ochterski, R. L. Martin, K. Morokuma, V. G. Zakrzewski, G. A. Voth, P. Salvador, J. J. Dannenberg, S. Dapprich, A. D. Daniels, O. Farkas, J. B. Foresman, J. V. Ortiz, J. Cioslowski, and D. J. Fox, Gaussian, Inc., Wallingford CT, 2009.
- T. Bruhn, A. Schaumlöffel, Y. Hemberger and G. Bringmann, SpecDis, Version 1.62, University of Wuerzburg, Germany, 2014 Search PubMed.
- C. M. Sai, D. H. Li, C. M. Xue, K. B. Wang, P. Hu, Y. H. Pei, J. Bai, Y. K. Jing, Z. L. Li and H. M. Hua, Org. Lett., 2015, 17, 4102–4105 CrossRef CAS PubMed.
- Y. Bai, D. H. Li, T. T. Zhou, N. B. Qin, Z. L. Li, Z. G. Yu and H. M. Hua, J. Funct. Foods, 2016, 20, 453–462 CrossRef CAS.
- L. Yuan, J. Wang, H. F. Xiao, C. X. Xiao, Y. T. Wang and X. B. Liu, Toxicol. Appl. Pharmacol., 2012, 265, 83–92 CrossRef CAS PubMed.
- S. Mo, H. Xiong, G. Shu, X. Yang, J. Wang, C. Zheng and W. Xiong, J. Pharmacol. Sci., 2013, 122, 163–175 CrossRef CAS.
Footnotes |
| † Electronic supplementary information (ESI) available. See DOI: 10.1039/c7ra09569d |
| ‡ Both authors contributed equally to this paper. |
| This journal is © The Royal Society of Chemistry 2017 |