DOI:
10.1039/C7RA09515E
(Paper)
RSC Adv., 2017,
7, 51444-51451
The influence of different N-substituted groups on the mechanochromic properties of 1,4-dihydropyridine derivatives with simple structures†
Received
28th August 2017
, Accepted 30th October 2017
First published on 6th November 2017
Abstract
A twisted molecular conformation is known to be beneficial to the formation of mechanochromic (MC) phenomenon for organic fluorescent molecules, but it is sometimes not a decisive factor. Up to now, the clear design guidance for MC-active materials based on these twisted molecules is still lacking. Herein, four twisted 1,4-dihydropyridine derivatives (3a–3d) with a simple structure were synthesized to investigate the effect of N-substituted groups on their potential MC activities. Compound 3d containing 2-phenylethyl group presented reversible high-contrast MC properties, while 3a with an ethyl group and 3c with a 1-phenylethyl group were MC-inactive. Moreover, 3b with a benzyl group had two different crystalline forms, interestingly, the blue-emitting 3b-B was MC-active, whereas the green-emitting 3b-G was MC-inactive. The results indicated that N-substituted groups played a decisive role in determining whether or not these compounds had MC activities. Through the careful analyses of their X-ray diffraction and differential scanning calorimetry experiments, it was found that the phase transformation between different crystalline states was responsible for the reversible MC properties of 3b-B and 3d. Furthermore, the red shift of their fluorescence spectra was ascribed to the planarization of molecular conformation and the resultant enhancement of the degree of π-electron conjugation. This work provides a feasible design direction for the development of efficient MC materials based on twisted fluorescent molecules.
Introduction
Mechanochromic (MC) materials refer to a class of fluorescent compounds whose solid-state emission and/or reflection colors can exhibit distinct change under external force (grinding or pressing). In recent years, such fluorescent compounds have received widespread attention because of their potential application in solid-state sensing materials.1 Generally speaking, for the development of new MC materials, a very important requirement is that the designed molecules need to be able to emit strong solid-state fluorescence. However, most traditional organic fluorophores often contain planar π-conjugated aromatic rings and thus emit very weak fluorescence or no fluorescence in the solid state due to strong intermolecular π–π stacking interactions,2 which seriously limits their applications in MC materials. The fluorescent molecules with a twisted molecular conformation have the most promising potential to be developed as MC materials because the twisted molecular conformation can not only effectively avoid common aggregation-caused fluorescence quenching phenomenon and endue them with strong solid-state emission, but also help the molecules to form a loose packing pattern which is easily altered upon external force stimuli, accompanied by the changes of solid-state fluorescence colors.3 To make the best use of the great treasure trove of traditional fluorescent molecular frameworks for obtaining MC-active materials, a good strategy is to properly modify these molecular skeletons so that they have twisted molecular conformations, however, up to now, clear guidelines are still lacking, which deserve a further study and exploration.
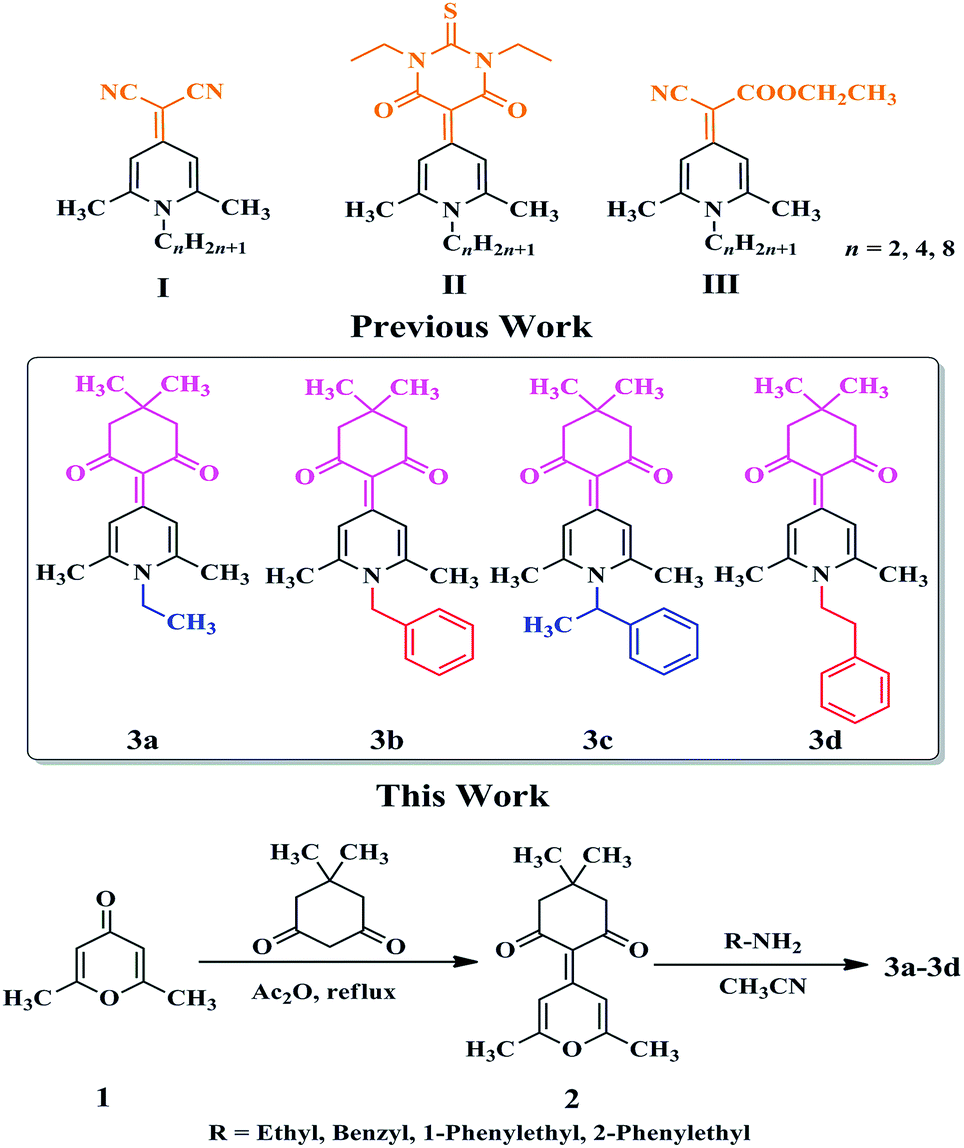
1,4-Dihydropyridine cycle is a traditional building skeleton for the design and synthesis in the field of various fluorescent materials.4 Especially, when a variety of alkyl groups were introduced into the nitrogen atom on the 1,4-dihydropyridine ring, the resulting compounds often showed a twisted molecular conformation and emitted fluorescence in the solid or aggregated state,5 which was very beneficial to obtain various solid-state stimuli-responsive fluorescent materials with MC, thermochromic, vapochromic, or acidochromic properties.6 Recently, we reported that some N-alkylated 1,4-dihydropyridine derivatives with simple structures, such as 2-(1-alkyl-2,6-dimethylpyridin-4(1H)-ylidene)malononitrile (I), 5-(1-alkyl-2,6-dimethylpyridin-4(1H)-ylidene)-1,3-diethyl-2-thioxodihydropyrimidine-4,6(1H,5H)-dione (II), and ethyl 2-(1-alkyl-2,6-dimethylpyridin-4(1H)-ylidene)-2-cyanoacetate (III) (Scheme 1), displayed MC and polymorphic properties simultaneously.7 For these compounds, the choice of the electron-withdrawing end groups played a crucial role in their MC and polymorphic properties, while the variation in alkyl chain length affected only the number of crystal polymorphs. Just recently, a 1,4-dihydropyridine compound using 5,5-dimethylcyclohexane-1,3-dione as an electron-withdrawing end group, namely 3a (Scheme 1), was obtained in our group, which was found to be MC-inactive. What we were interested in was how to develop new MC-active 1,4-dihydropyridine derivatives by a simple structural modification of this compound. Considering that a large steric hindrance was often conducive to enhancing the degree of distortion of molecular conformations and thus resulting in the formation of looser stacking modes, several groups with large steric effect, such as benzyl, 1-phenylethyl, and 2-phenylethyl group were introduced to replace the ethyl group in 3a to give 3b, 3c, and 3d (Scheme 1), respectively. Herein, the introduction of a phenyl ring was not only beneficial to lead to the more twisted molecular conformations of these compounds, but also might lead to the formation of crystalline forms, which might come from the alteration of the molecular stacking modes and intermolecular interactions using the possible C–H⋯π bonds.8 Single crystals of 3a–3d were obtained and they were all confirmed to have twisted molecular conformations. It should be noticed that although a twisted molecular conformation often contributes to the formation of MC phenomenon, but it is sometimes not a decisive factor. In these cases, 3d containing 2-phenylethyl group exhibited reversible MC property, whereas 3c with 1-phenylethyl group was MC-inactive. In particular, 3b with 2-phenylethyl group had two different crystalline forms, namely blue-emitting 3b-B and green-emitting 3b-G. Grinding could change the solid-state fluorescence color of 3b-B from blue to green, but not for 3b-G. X-Ray diffraction (XRD) and Differential scanning calorimetry (DSC) experiments demonstrated that the phase transformation between different crystalline states was responsible for the reversible MC properties of 3b-B and 3d. These results suggested that N-substituted groups showed significant effects on the potential MC properties of these compounds.
 |
| | Scheme 1 Chemical structures of 1,4-dihydropyridine derivatives and synthetic routes to 3a–3d. | |
Experimental
Measurements and materials
NMR spectra were performed using a Bruker DRX 500 NMR spectrometer with CDCl3 as the solvent. Mass spectrometry spectra were recorded using a Finnigan MAT95XP mass spectrometer. Elemental analyses (C, H, and N) were acquired on an Elementar Vario MICRO analyzer. Emission spectra were performed using a HITACHI F-7000 fluorometer. Solid-state absorption spectra were performed using a Perkin-Elmer Lambda 25 spectrometer. DSC measurements were performed with a TA-DSC Q2000 at a heating rate of 10 °C min−1. Powder XRD patterns were recorded with a Bruker D8 Advance X-ray diffractometer. The fluorescence quantum yields (ΦF) in solid state and time-resolved emission decay parameters were determined with a FluoroMax-4 (Horiba Jobin Yvon) fluorometer. Single-crystal X-ray diffraction measurements were measured by a Bruker-Nonius Smart Apex CCD diffractometer with graphite monochromated Mo Kα radiation. 2,6-Dimethyl-4H-pyran-4-one (1), 5,5-dimethylcyclohexane-1,3-dione, ethylamine, benzylamine, 1-phenylethanamine, and 2-phenylethanamine were purchased from commercial suppliers and used directly.
Synthesis of 2-(2,6-dimethyl-4H-pyran-4-ylidene)-5,5-dimethylcyclohexane-1,3-dione (2)
2,6-Dimethyl-4H-pyran-4-one (1) (2.0 g, 16.1 mmol) and 5,5-dimethylcyclohexane-1,3-dione (4 g, 28.6 mmol) were dissolved in acetic anhydride (15 mL). The mixture was heated at 140 °C for 18 h. After cooling, the reaction mixture was extracted with dichloromethane (3 × 50 mL) and then the organic phases were washed with water (3 × 50 mL), dried with anhydrous sodium sulfate. After filtration, the solvent was evaporated under reduced pressure and the residue was washed with acetone (3 × 20 mL) to afford pure compound 2. Orange solids (1.8 g), 43% yield. 1H NMR (CDCl3, 500 MHz), δ (ppm): 8.52 (s, 2H), 2.43 (s, 4H), 2.36 (s, 6H), 1.03 (s, 6H). 13C NMR (CDCl3, 125 MHz), δ (ppm): 199.0, 164.9, 153.7, 112.2, 110.6, 54.4, 29.7, 28.3, 20.5.
General procedure for 3a–3d
Compound 2 (300 mg, 1.2 mmol) and ethylamine/benzylamine/1-phenylethanamine/2-phenylethanamine (2.0 mL) were dissolved in acetonitrile (15 mL). The mixture was heated under nitrogen at 80 °C for 24 h. It was cooled to room temperature and the solvent was evaporated under reduced pressure, and then the residue was recrystallized using chloroform/petroleum ether (1![[thin space (1/6-em)]](https://www.rsc.org/images/entities/char_2009.gif) :30, v/v) to give pure compound 3a–3d. The characterization data for 3a–3d are listed as follows:
:30, v/v) to give pure compound 3a–3d. The characterization data for 3a–3d are listed as follows:
2-(1-Ethyl-2,6-dimethylpyridin-4(1H)-ylidene)-5,5-dimethylcyclohexane-1,3-dione (3a). White solids (170.8 mg), 51.3% yield. 1H NMR (CDCl3, 500 MHz), δ (ppm): 8.74 (s, 2H), 4.14 (q, J = 7.0 Hz, 2H), 2.56 (s, 6H), 2.38 (s, 4H), 1.38 (t, J = 7.0 Hz, 3H), 1.04 (s, 6H). 13C NMR (CDCl3, 125 MHz), δ (ppm): 195.7, 154.6, 147.6, 123.0, 107.8, 53.2, 44.6, 30.1, 28.4, 20.7, 14.5. MS (EI, m/z): 273.22 (M+, 100%), 258.19 (14%), 216.15 (31%), 202.16 (11%), 175.14 (88%), 149.15 (27%), 146.12 (12%), 118.09 (9%), 91.07 (5%), 77.05 (6%). Anal. calcd for C17H23NO2: C, 74.69; H, 8.48; N, 5.12. Found: C, 75.19; H, 8.43; N, 5.16.
2-(1-Benzyl-2,6-dimethylpyridin-4(1H)-ylidene)-5,5-dimethylcyclohexane-1,3-dione (3b). Pale yellow solids (299.0 mg), 73.2% yield. 1H NMR (CDCl3, 500 MHz), δ (ppm): 8.87 (s, 2H), 7.38–7.31 (m, 3H), 6.89 (d, J = 7.5 Hz, 2H), 5.34 (s, 2H), 2.47 (s, 6H), 2.42 (s, 4H), 1.07 (s, 6H). 13C NMR (CDCl3, 125 MHz), δ (ppm): 196.1, 154.9, 148.7, 133.0, 129.6, 128.6, 124.9, 122.5, 108.1, 53.3, 52.6, 30.1, 28.4, 21.1. MS (EI, m/z): 335.23 (M+, 84%), 320.20 (4%), 278.12 (9%), 244.14 (19%), 238.13 (27%), 211.16 (14%), 161.10 (4%), 92.06 (9%), 91.06 (100%), 65.05 (8%). Anal. calcd for C22H25NO2: C, 78.77; H, 7.51; N, 4.18. Found: C, 79.26; H, 7.45; N, 4.21.
2-(2,6-Dimethyl-1-(1-phenylethyl)pyridin-4(1H)-ylidene)-5,5-dimethylcyclohexane-1,3-dione (3c). Yellow-green solids (291.1 mg), 68.2% yield. 1H NMR (CDCl3, 500 MHz), δ (ppm): 8.77 (br, 2H), 7.40–7.33 (m, 3H), 7.06 (d, J = 7.5 Hz, 2H), 6.06 (q, J = 7.0 Hz, 1H), 2.68 (br, 3H), 2.40 (s, 4H), 2.11 (br, 3H), 1.98 (d, J = 7.5 Hz, 3H), 1.05 (s, 6H). 13C NMR (CDCl3, 125 MHz), δ (ppm): 196.1, 154.6, 148.8, 138.2, 129.5, 128.3, 125.1, 107.8, 59.1, 53.3, 30.1, 28.4, 22.4, 17.9. MS (EI, m/z): 349.24 (M+, 29%), 334.21 (3%), 245.14 (93%), 230.13 (5%), 189.09 (25%), 161.10 (39%), 147.08 (17%), 133.10 (9%), 105.08 (100%), 83.05 (13%), 77.04 (15%). Anal. calcd for C23H27NO2: C, 79.05; H, 7.79; N, 4.01. Found: C, 78.47; H, 7.83; N, 3.99.
2-(2,6-Dimethyl-1-phenethylpyridin-4(1H)-ylidene)-5,5-dimethylcyclohexane-1,3-dione (3d). White solids (320.9 mg), 75.2% yield. 1H NMR (CDCl3, 500 MHz), δ (ppm): 8.80 (s, 2H), 7.35–7.28 (m, 3H), 7.12 (d, J = 7.0 Hz, 2H), 4.24 (t, J = 7.0 Hz, 2H), 2.96 (t, J = 8.0 Hz, 2H), 2.52 (s, 6H), 2.37 (s, 4H), 1.03 (s, 6H). 13C NMR (CDCl3, 125 MHz), δ (ppm): 196.0, 154.5, 147.7, 135.7, 129.3, 128.4, 127.7, 122.6, 107.9, 53.3, 50.8, 35.8, 30.1, 28.4, 20.9. MS (EI, m/z): 349.26 (M+, 100%), 334.23 (12%), 292.17 (21%), 278.15 (6%), 252.16 (64%), 225.18 (29%), 207.07 (4%), 189.11 (3%), 160.10 (11%), 132.10 (6%), 105.08 (89%), 77.05 (18%). Anal. calcd for C23H27NO2: C, 79.05; H, 7.79; N, 4.01. Found: C, 79.59; H, 7.74; N, 4.04.
Results and discussion
Synthesis and features of 3a–3d
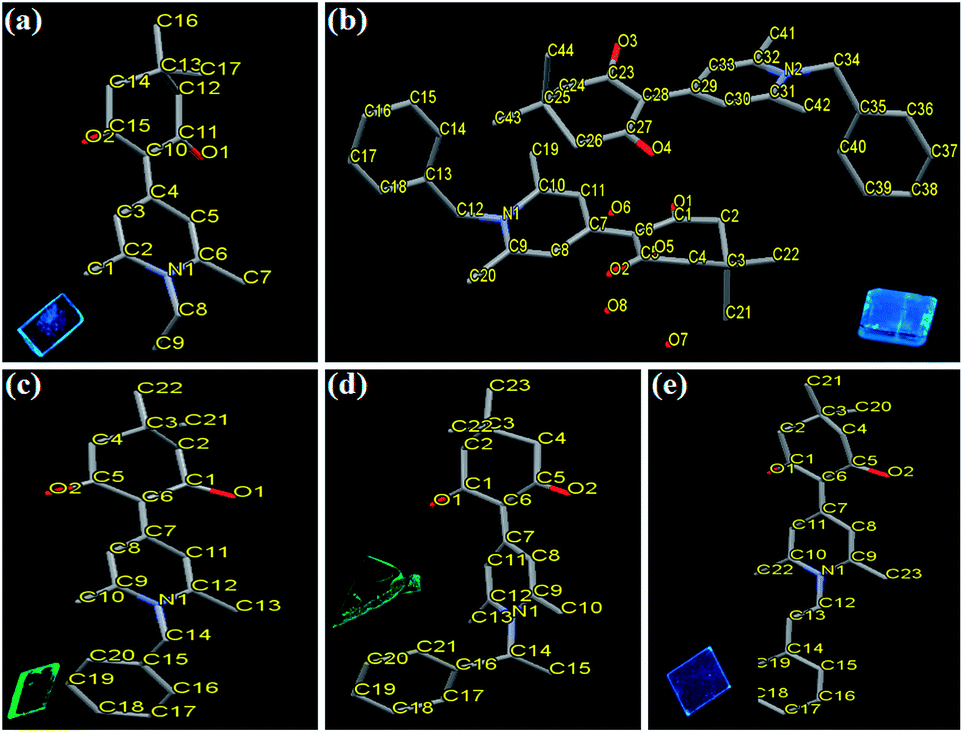
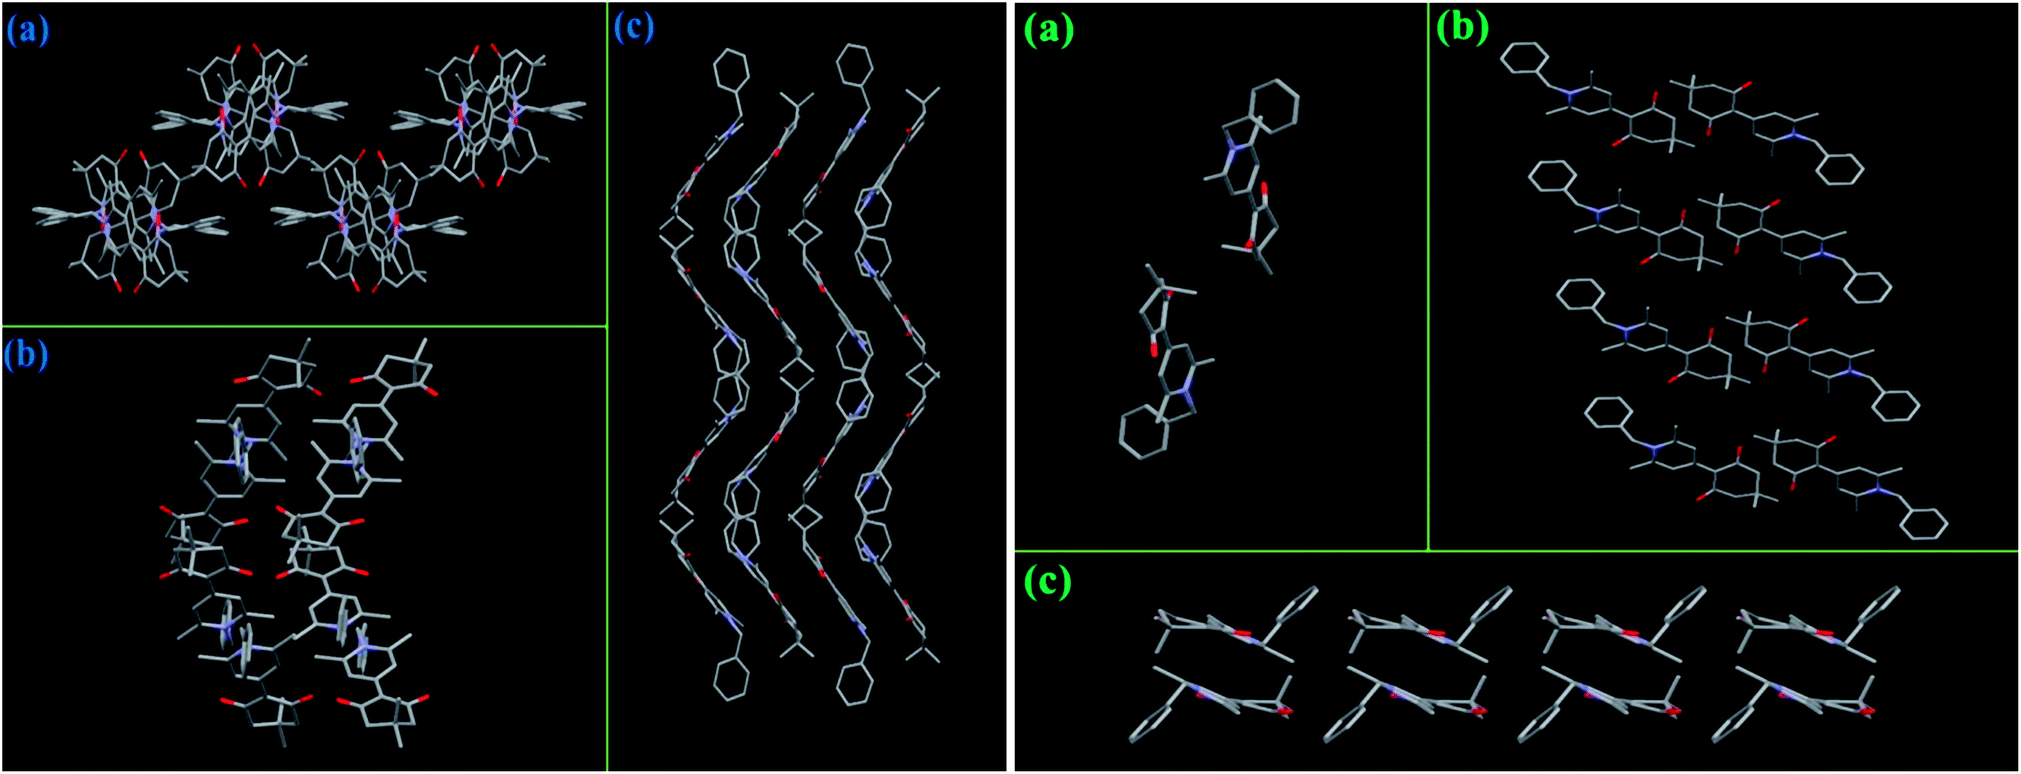
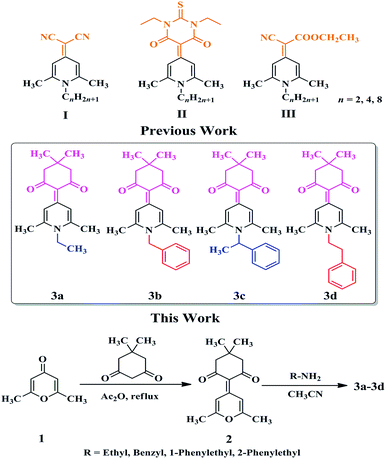
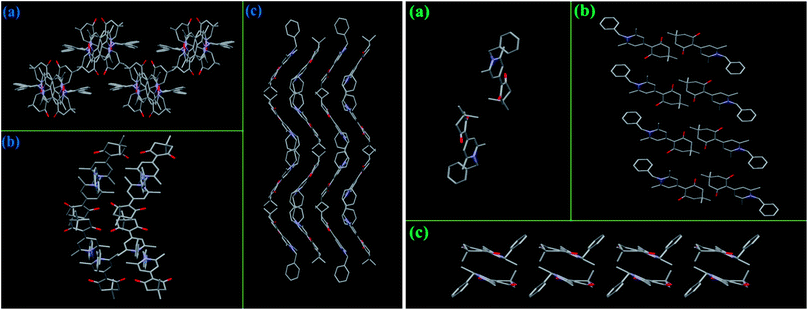
Synthetic routes of compounds 3a–3d are shown in Scheme 1. The intermediate 2-(2,6-dimethyl-4H-pyran-4-ylidene)-5,5-dimethylcyclohexane-1,3-dione (2) was synthesized by a Knoevenagel reaction of 2,6-dimethyl-4H-pyran-4-one (1) with 5,5-dimethylcyclohexane-1,3-dione in acetic anhydride with a yield of 43%. The target compounds 3a–3d were obtained from a reaction of compound 2 with ethylamine, benzylamine, 1-phenylethanamine, and 2-phenylethanamine in 51.3–75.2% yields, respectively. The chemical structures of compounds 3a–3d were all characterized by 1H NMR and 13C NMR spectroscopy, mass spectrometry, elemental analysis, and single-crystal X-ray diffraction analysis (Fig. 1).
 |
| | Fig. 1 X-ray crystallographic structures of compounds 3a–3d: (a) 3a (CCDC 1569086); (b) 3b-B (CCDC 1569087); (c) 3b-G (CCDC 1569088); (d) 3c (CCDC 1569089); (e) 3d (CCDC 1569090). Hydrogen atoms and solvent molecules are omitted for clarity. Insets show fluorescence photos of various single crystals under UV light (365 nm). | |
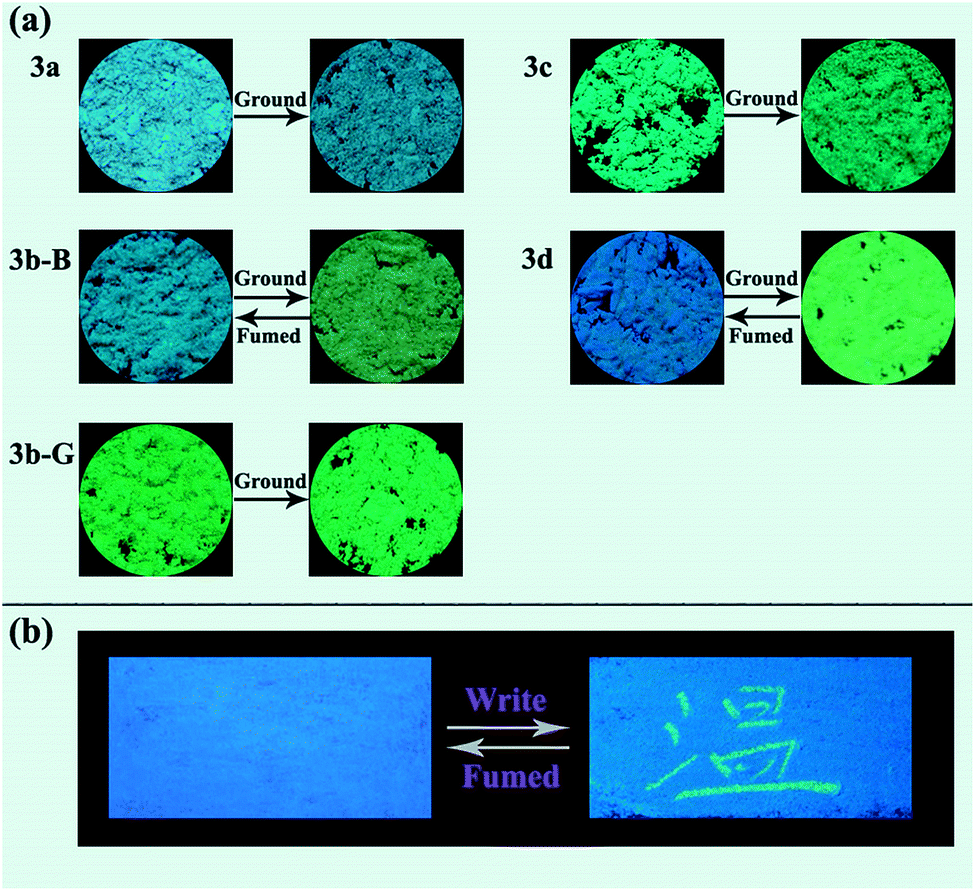
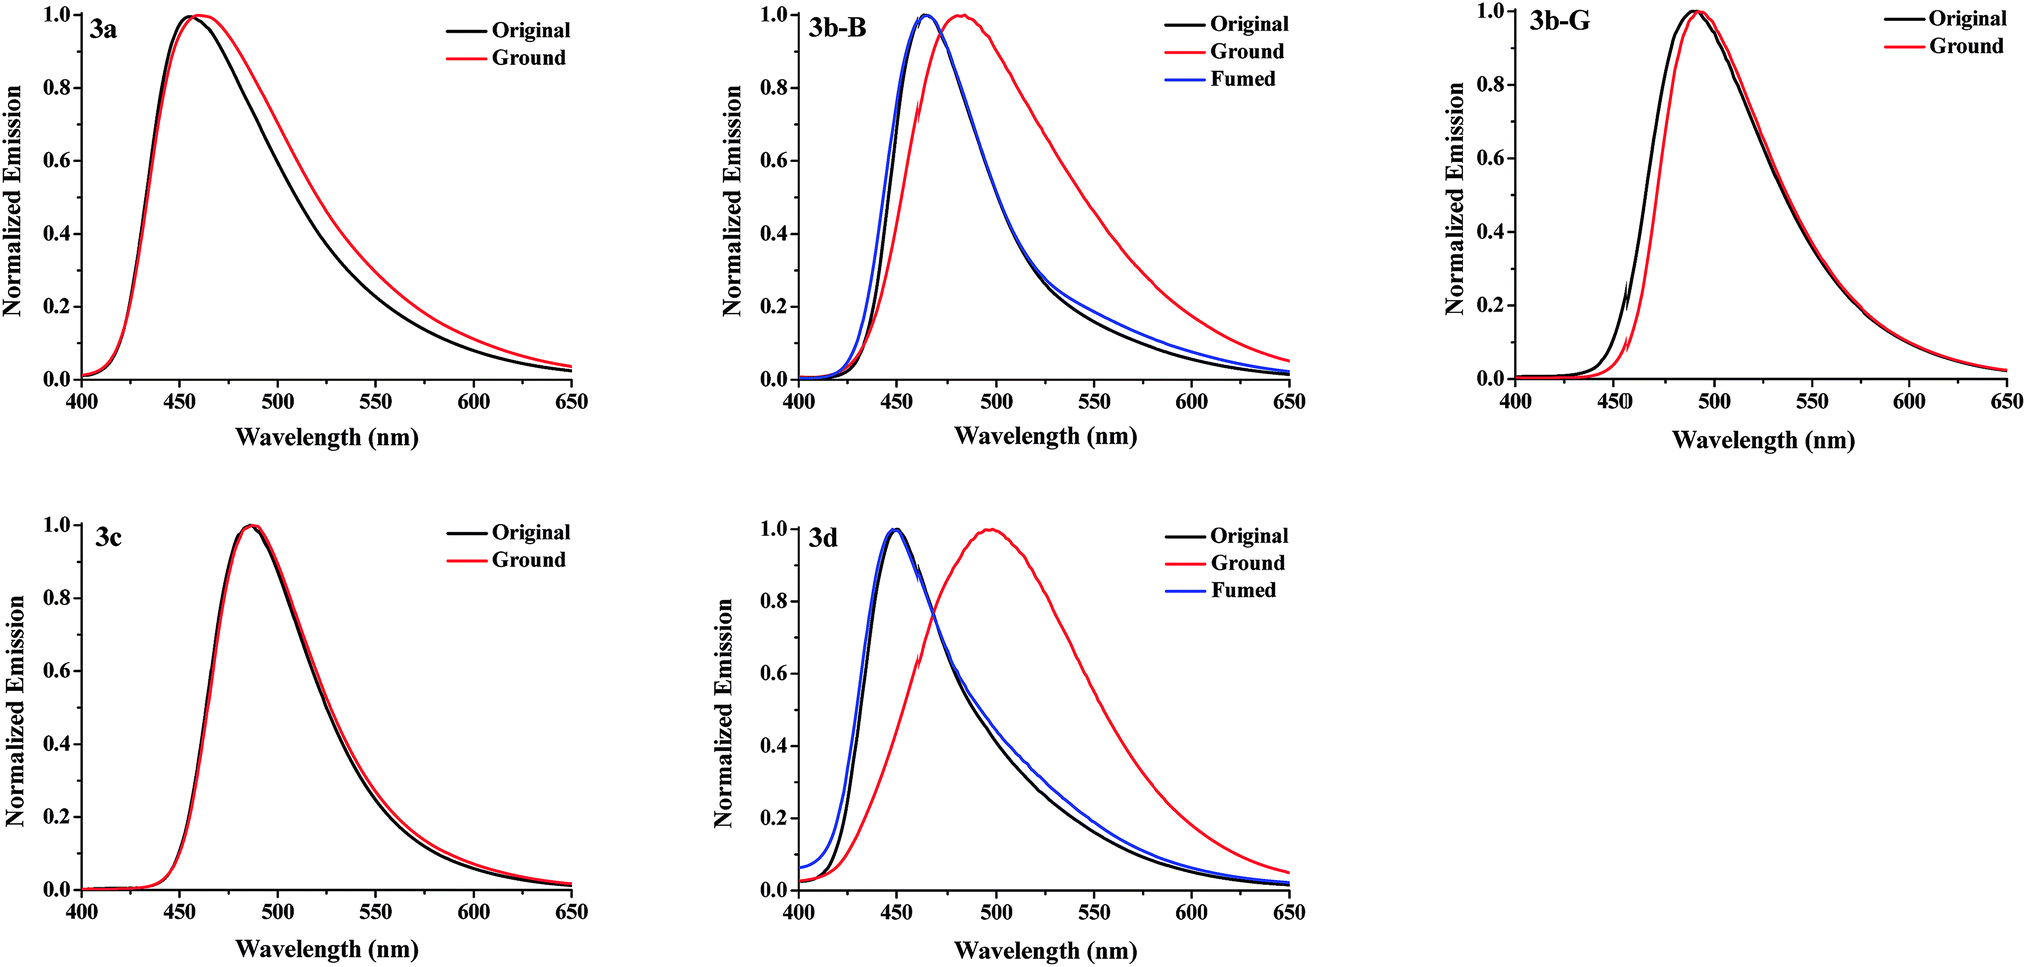
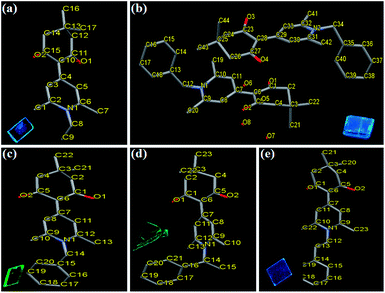
Response behaviors of the solid samples of 3a–3d under external stimuli. The solids of compounds 3a, 3c, and 3d obtained from a recrystallization using a mixed solvent of CHCl3 and petroleum ether (v/v, 1:30) were regarded as the corresponding original samples. The original samples of 3a, 3c, and 3d emitted blue, green, and blue fluorescence with a ΦF value of 8.9, 18.7, and 7.6%, and their emission wavelengths (λem) were at 455, 486, and 450 nm, respectively (Fig. 2 and Table 1). For 3b, two kinds of solid samples, blue-emitting solids 3b-B (λem = 463 nm, ΦF = 22.7%) and green-emitting solids 3b-G (λem = 490 nm, ΦF = 38.0%) were obtained by a recrystallization process using CHCl3/petroleum ether with a different volume ratio (v/v = 1:30 for 3b-B and v/v = 1:3 for 3b-G), suggesting 3b had different crystalline forms. The response behaviors of these compounds under external force were investigated (Fig. 2a and 3). When the original samples of 3a and 3c were ground in a mortar with a pestle, no obvious fluorescence color changes were observed, accordingly, their emission wavelengths were no obvious changes before and after grinding. Therefore, 3a and 3c were MC-inactive. However, after grinding, the original sample of 3d displayed a 48 nm redshift in the fluorescence spectra and a color change of the fluorescence from blue to green, indicating a highly contrast MC property. Interestingly, 3b-B and 3b-G exhibited different stimuli-responsive behaviors under external force. Grinding could not change the fluorescence color of 3b-G, whereas resulted in the fluorescent color change from blue to green as well as a 19 nm redshift in the emission wavelength for 3b-B. When the ground samples of 3d and 3b-B were fumed by ethyl acetate (EA) vapor, their fluorescence colors and fluorescent spectra returned to those of the corresponding original samples, indicating 3d and 3b-B were reversible MC-active compounds. Furthermore, when the Chinese word “Wen” was written on the surface of the original samples of 3d coated on a filter paper using a metal spatula, the color changes occurred only on the written area and the character disappeared after fuming with EA vapor, demonstrating 3d could be used as a simple and convenient rewritable fluorescent optical recording media (Fig. 2b). As mentioned above, N-substituted groups played a crucial role in determining the response behaviors of these compounds under external force stimuli. Furthermore, the solid-state absorption spectra of the original samples of 3a–3d before and after grinding were investigated (Fig. S1, ESI†). It was found that the grinding hardly affected the absorption spectra of the original samples of 3a, 3b-G, and 3c, whereas resulted in an obvious bathochromic shift in the absorption spectra of the original samples of 3b-B and 3d. Herein, the bathochromic shift observed in absorption and emission for 3b-B and 3d might be attributed to the planarization of molecular conformation and enhanced conjugation caused by the grinding treatment.9
 |
| | Fig. 2 (a) Fluorescence images of the solid samples of 3a–3d upon grinding and fuming treatments. (b) The original sample of 3d was used to write the Chinese character “Wen” with a metal spatula and then fumed using EA. All of the photographs were taken under UV light (365 nm). | |
Table 1 The emission wavelengths and decay parameters of the solid samples of 3a–3d
| Compound |
Type |
λem (nm) |
τ1a (ns) |
τ2a (ns) |
A1b |
A2b |
〈τ〉c (ns) |
ΦF |
| Fluorescence lifetime. Fractional contribution. Weighted mean lifetime. |
| 3a |
Original |
455 |
0.38 |
4.73 |
0.80 |
0.20 |
1.25 |
8.9% |
| Ground |
459 |
0.54 |
4.31 |
0.83 |
0.17 |
1.18 |
7.4% |
| 3b-B |
Original |
463 |
0.81 |
1.89 |
0.58 |
0.42 |
1.26 |
22.7% |
| Ground |
482 |
0.70 |
9.49 |
0.85 |
0.15 |
2.02 |
4.3% |
| Fumed |
463 |
0.76 |
2.29 |
0.74 |
0.26 |
1.16 |
21.8% |
| 3b-G |
Original |
490 |
1.49 |
36.50 |
0.93 |
0.07 |
3.94 |
38.0% |
| Ground |
492 |
1.39 |
33.80 |
0.92 |
0.08 |
3.98 |
30.9% |
| 3c |
Original |
486 |
1.12 |
4.87 |
0.93 |
0.07 |
1.38 |
18.7% |
| Ground |
487 |
1.08 |
3.78 |
0.86 |
0.14 |
1.46 |
13.4% |
| 3d |
Original |
450 |
0.69 |
3.03 |
0.86 |
0.14 |
1.02 |
7.6% |
| Ground |
498 |
1.18 |
24.75 |
0.84 |
0.16 |
4.95 |
5.0% |
| Fumed |
448 |
0.50 |
4.54 |
0.88 |
0.12 |
0.98 |
7.1% |
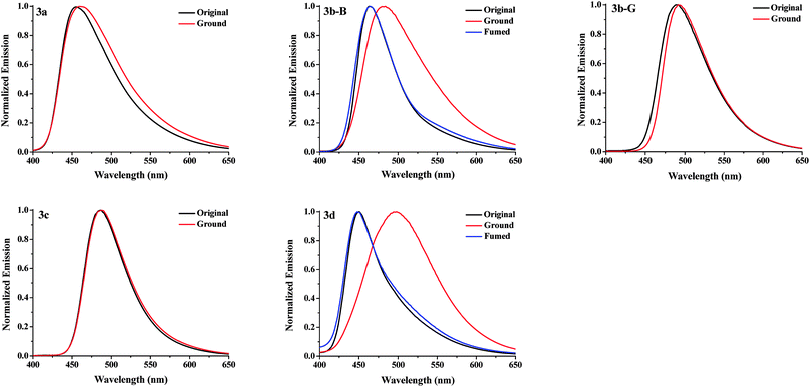 |
| | Fig. 3 Normalized fluorescence spectra of the solid samples of 3a–3d upon grinding and fuming treatments. | |
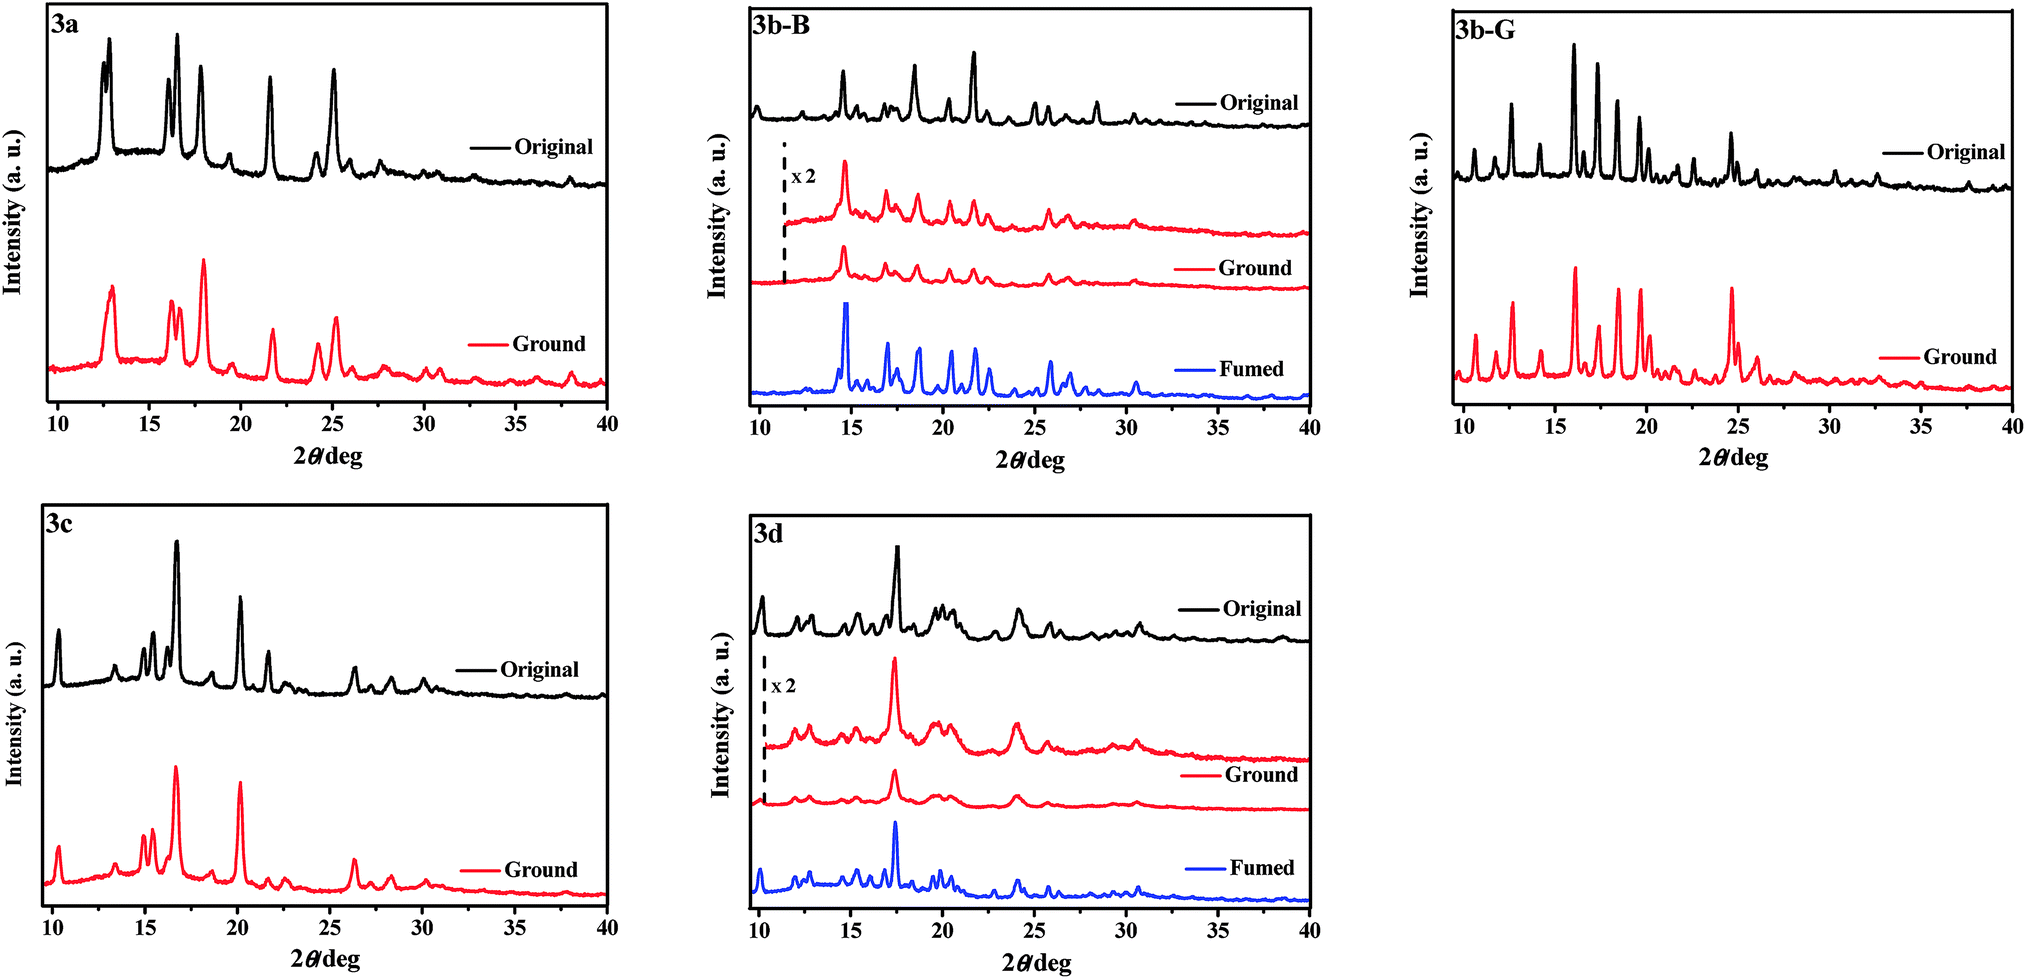
To obtain further insights into the different responsive behaviors of 3a–3d upon grinding, XRD (Fig. 4) and DSC (Fig. S2, ESI†) measurements of their various solid samples were carried out. As shown in Fig. 4, the original samples of 3a–3d were all crystalline structures because of sharp and strong diffraction peaks. After grinding, the diffraction peaks of the ground samples of 3a, 3b-G, and 3c including the 2θ values and intensities were almost identical with those of the corresponding original crystalline samples, indicating their crystalline structures were basically preserved. However, the grinding treatment led to an obvious decrease of the diffraction peaks of the original samples of 3d and 3b-B in either number or intensity, namely the grinding treatment destroyed their crystalline structures to a certain extent and their morphologies were changed, which could be used as an explanation for their fluorescence color changes before and after grinding.10 For the ground samples of 3b-B and 3d, it should be pointed out that the grinding treatment did not completely damage the crystalline structures to amorphous structures because they still had distinct diffraction peaks (Fig. 4). Furthermore, there were no cold-crystallization phenomena before the isotropic melt transition of the ground samples in the DSC curves (Fig. S2, ESI†), which further proved that they were crystalline rather than amorphous.7 Therefore, the MC properties of 3b-B and 3d should be attributed to a crystal-to-crystal transformation. After fuming, the XRD curves of the ground samples of 3d and 3b-B were in line with those of their original samples and thus the fluorescence colors were recovered again.
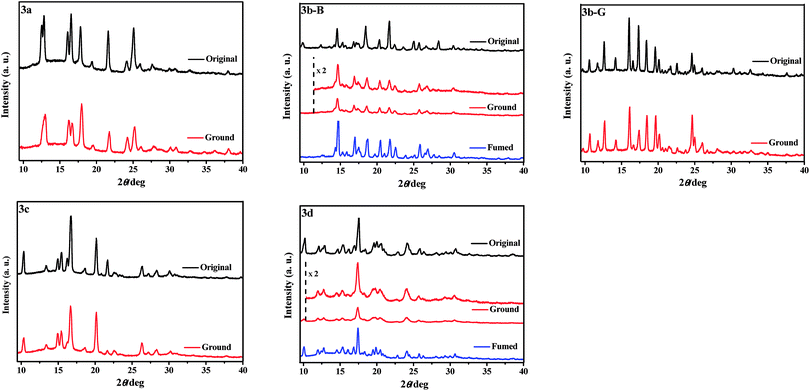 |
| | Fig. 4 XRD patterns of the solid samples of 3a–3d upon grinding and fuming treatments. | |
Considering that the changes in fluorescent spectra and colors of the MC-active compounds were often accompanied by significant changes in the fluorescent lifetime,11 the solid-state time-resolved emission decay behaviors of 3a–3d were further studied and the fluorescence decay data were illustrated in Table 1. For the MC-inactive 3a, 3b-G, and 3c, the weighted mean lifetime (〈τ〉) values of their ground samples were nearly the same as those of their original samples, whereas there were distinct changes for 3b-B and 3d with MC properties. In comparison with the original samples of 3b-B and 3d, the 〈τ〉 values of their ground samples were prolonged for 0.76 ns and 3.93 ns, respectively, which might be related to the changes of the π-electron conjugation extent of the molecules in the crystals upon grinding.12
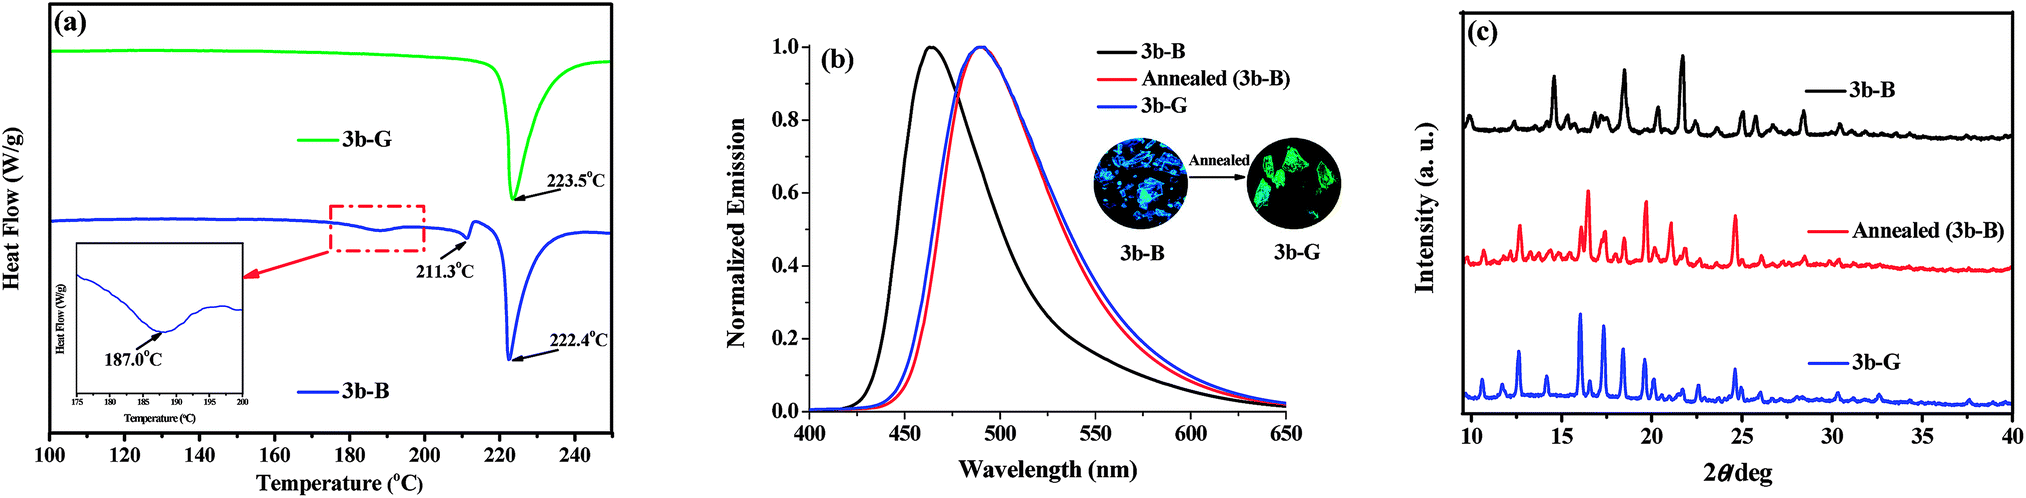
Although 3b-G (ΦF = 38.0%) and the ground sample of 3b-B (ΦF = 4.3%) both emitted green fluorescence, the former had a higher ΦF value because of higher crystalline order, which indicated that the transformation between 3b-B and 3b-G was hard to be achieved by simply grinding. Herein, the possible conversion between 3b-B and 3b-G by a thermal process was investigated. According to the results of DSC measurements (Fig. 5a), no peak was observed before the isotropic melt transition of 3b-G, indicating it was thermally stable.13 By contrast, 3b-B displayed two exothermic peaks at 187.0 and 211.3 °C. By heating of 3b-B at 187 °C for 10 min and cooling to room temperature, the resultant annealed sample emitted green fluorescence at 490 nm with a ΦF value of 31.6%, which were in good agreement with those observed in 3b-G (Fig. 5b and Table 1). Moreover, the diffraction peaks in the XRD curve of the annealed sample of 3b-B were consistent with those of 3b-G (Fig. 5c). The results indicated that 3b-B showed obvious thermochromic property and could be converted to 3b-G by annealing.
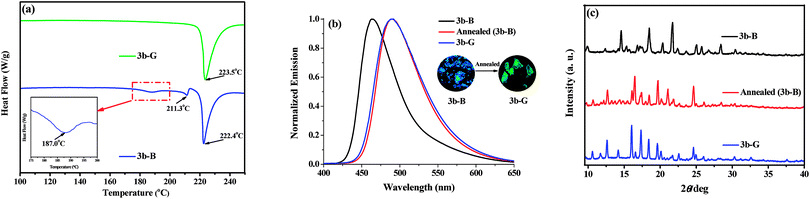 |
| | Fig. 5 (a) DSC curves of 3b-B and 3b-G. (b) Normalized fluorescence spectra of 3b-B, 3b-G, and the annealed sample of 3b-B, inset: fluorescence photographs of 3b-B before and after annealing. (c) XRD patterns of 3b-B, 3b-G, and the annealed sample of 3b-B. | |
Crystal structures of compounds 3a–3d. Single-crystal structures of all target compounds were obtained and used to interpret their solid-state photophysical properties. The crystal structures of 3a–3d were shown in Fig. 1 and the selected crystallographic data were listed in Table S1 (ESI†). Single crystals of 3a and 3c were cultured from a slow evaporation of EA/petroleum ether mixture (v/v = 1:4), and those of 3d were obtained from a slow evaporation of CHCl3/EA mixture (v/v = 1:1). The unit cells of 3a, 3c, and 3d were orthorhombic, monoclinic, and monoclinic with space group Pna21, P21, and P2(1)/c, respectively (Table S1, ESI†). For the two different crystalline forms of 3b, single crystals of 3b-B and 3b-G were obtained from a slow evaporation of EA/petroleum ether mixture with a different volume ratio (v/v = 1:6 for 3b-B and v/v = 1:3 for 3b-G). The single crystals of 3b-B and 3b-G had different unit cell, the former was monoclinic with a space group of P2(1)/c, while the latter was triclinic with a space group of P![[1 with combining macron]](https://www.rsc.org/images/entities/char_0031_0304.gif) (Table S1, ESI†). According to the results of XRD measurements, the main reflection peaks in the XRD curves of the original samples of 3a–3d agreed well with the simulated peaks of the respective single crystals (Fig. S3, ESI†). This indicated that the original samples should be mainly composed of the respective microcrystals and the investigation of the intermolecular interactions and packing patterns in the single crystals could help to explain their photophysical behaviors in the solid state.14
(Table S1, ESI†). According to the results of XRD measurements, the main reflection peaks in the XRD curves of the original samples of 3a–3d agreed well with the simulated peaks of the respective single crystals (Fig. S3, ESI†). This indicated that the original samples should be mainly composed of the respective microcrystals and the investigation of the intermolecular interactions and packing patterns in the single crystals could help to explain their photophysical behaviors in the solid state.14For crystals 3a, 3b-G, 3c, and 3d, the dihedral angles of these molecules between the 1,4-dihydropyridine and the plane containing two carbonyl groups were 12.27°, 14.66°, 20.75°, and 2.37°, respectively. In addition, the torsion angles of 3a, 3b-G, and 3d between 1,4-dihydropyridine and N-substituted group were 89.34°, 77.69°, and 86.17°, respectively. The torsion angles of 3c between 1,4-dihydropyridine and 1-phenylethyl group were 76.90° (for methyl group) and 56.68° (for benzene ring). In view of crystal 3b-B, there were two independent conformational molecules whose corresponding dihedral angles were 13.09° and 17.94°, and corresponding torsion angles were 83.20° and 77.60°, respectively. These results indicated that all these compounds in the crystals had twisted molecular conformations. As a result, the molecules of crystals 3a–3d were mainly stabilized by a variety of C–H⋯O bonds and/or C–H⋯π bonds rather than strong π–π stacking interactions (Fig. S4–S8, ESI†), indicating the emissions of these crystals should be mainly depended on the molecular conformations.15 Meanwhile, the absence of strong π–π stacking interactions was also advantageous to result in the solid-state fluorescence emissions of these compounds by avoiding the formation of various excimers and exciplexes.2
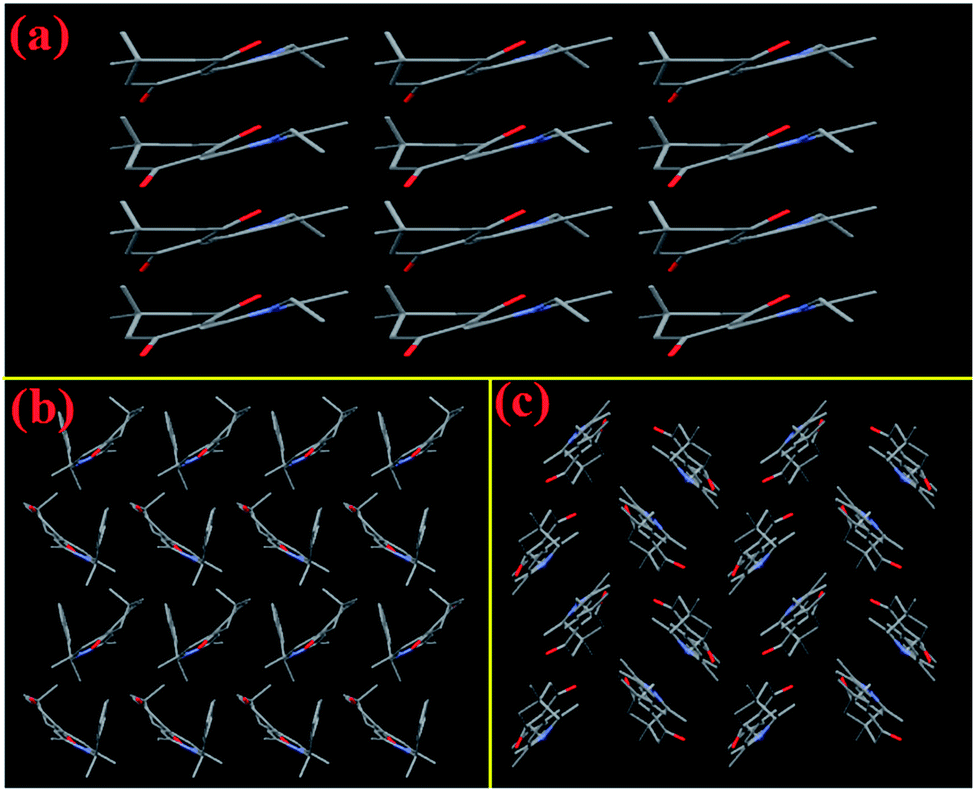
As mentioned above, the MC properties of compounds 3b-B and 3d should be ascribed to the transformation between different crystalline states. Herein, to investigate whether these target compounds could display effective MC phenomenon, two factors need to be considered, one was whether the crystalline structures of these compounds were easily destroyed; the other one was whether the molecular conformations could change as soon as the crystalline structures were damaged. For the two crystalline forms of 3b (Fig. 6), 3b-B adopted a zigzag packing pattern along the c-axis, while 3b-G displayed a lamellar stacking mode along the b-axis, as a result, the molecules in the crystal lattice of 3b-B had a bigger volume (4052.3 Å3) and a smaller density (1.218 Mg m−3) than those of 3b-G (912.55 Å3 and 1.221 Mg m−3) (Table S1, ESI†), indicating 3b-B had a looser molecular packing pattern in the crystal and thus its crystalline structure was more easily destroyed upon grinding. Moreover, one of the two independent conformational molecules of 3b-B had a bigger dihedral angle (17.94°) than 3b-G (14.66°), which indicated there was plenty of space for the molecules of 3b-B to adjust their conformations to a better π-electron conjugation in response to an external force, resulting in a 19 nm redshift in the fluorescence spectra (Table 1). In the case of 3a and 3c, their molecules in the crystals packed in a regular lamellar shape along the b-axis and a zigzag shape including a lamellar arrangement along the c-axis, respectively, while the molecules of 3d formed a relatively messy zigzag shape along the a-axis (Fig. 7). Furthermore, among these three compounds, 3d had the largest cell volume (1941.2 Å3) (Table 1). These results indicated the molecules of 3d accumulated more loosely than the molecules of 3a and 3c, and thus were more easily influenced by external forces, which could be confirmed by the XRD experimental results upon grinding (Fig. 4). In these cases, a twisted molecular conformation caused by the introduction of N-substituted groups was only one of the conditions in which these compounds might have MC properties, an easily destroyed crystal structure as well as alterable molecular conformation under external forces was more important.
 |
| | Fig. 6 Stacking modes in the crystals of 3b-B (left) and 3b-G (right): viewed along the a-axis (a), b-axis (b), and c-axis (c), respectively. Hydrogen atoms were omitted for clarity. | |
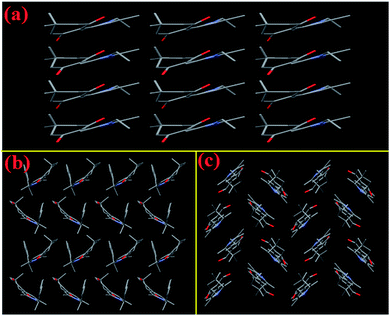 |
| | Fig. 7 Stacking modes in the single crystals of 3a along the b-axis (a), 3c along the c-axis (b), and 3d along the a-axis (a). Hydrogen atoms were omitted for clarity. | |
Conclusions
Decoration of 1,4-dihydropyridine skeleton with an electron-withdrawing 5,5-dimethylcyclohexane-1,3-dione unit through vinyl functionality yielded four fluorescent molecules with simple structure. The influence of different N-substituted groups on the potential MC properties of these compounds with twisted molecular conformations was investigated. Our finding suggested that N-substituted groups played a decisive role in determining their effective MC activities. Different from 3a with ethyl group and 3c with 1-phenylethyl group, 3d containing 2-phenylethyl group presented reversible high-contrast MC properties. Compound 3b with benzyl group had two different crystalline forms, but interestingly, blue-emitting 3b-B was MC-active, while green-emitting 3b-G was MC-inactive. XRD experiments suggested that the grinding treatment hardly affected the XRD curves of the original samples of 3a, 3b-G, and 3c, whereas could destroy the crystalline structures of the original samples of 3b-B and 3d to a certain extent and thus changed their morphologies, accompanied by the changes of solid-state fluorescence colors. Furthermore, based on the analyses of the single crystals of these compounds, it could be found that the introduction of different N-substituted groups had an important influence on the stacking modes of these compounds in the crystals. The molecules of 3a, 3b-G, and 3c had tight packing patterns in the crystals, avoiding being affected by external force, whereas, 3b-B and 3d adopted loose molecular packing patterns and thus their crystalline structures were easily destroyed upon grinding. This work presents that although the twisted molecular conformation is beneficial to the formation of MC phenomena, the crystalline structures which are easy to be destroyed as well as variable molecular conformations under external force are crucial to obtaining effective MC materials.
Conflicts of interest
There are no conflicts to declare.
Acknowledgements
This work was supported by the National Natural Science Foundation of China (No. 21572165, 21372177, and 21472140), the Zhejiang Provincial Natural Science Foundation (No. LY16B040005), and the Graduate Innovation Foundation of Wenzhou University (No. 3162016036).
Notes and references
-
(a) Y. Sagara, S. Yamane, M. Mitani, C. Weder and T. Kato, Adv. Mater., 2016, 28, 1073–1095 CrossRef CAS PubMed;
(b) S. Xue, X. Qiu, Q. Sun and W. Yang, J. Mater. Chem. C, 2016, 4, 1568–1578 RSC;
(c) S. Mukherjee and P. Thilagar, J. Mater. Chem. C, 2016, 4, 2647–2662 RSC;
(d) Z. Ma, Z. Wang, M. Teng, Z. Xu and X. Jia, ChemPhysChem, 2015, 16, 1811–1828 CrossRef CAS PubMed;
(e) S. Varughese, J. Mater. Chem. C, 2014, 2, 3499–3516 RSC;
(f) X. Q. Zhang, Z. G. Chi, Y. Zhang, S. W. Liu and J. R. Xu, J. Mater. Chem. C, 2013, 1, 3376–3390 RSC;
(g) Z. G. Chi, X. Q. Zhang, B. J. Xu, X. Zhou, C. P. Ma, Y. Zhang, S. W. Liu and J. R. Xu, Chem. Soc. Rev., 2012, 41, 3878–3896 RSC;
(h) K. M. Wiggins, J. N. Brantley and C. W. Bielawski, Chem. Soc. Rev., 2013, 42, 7130–7147 RSC;
(i) F. Ciardelli, G. Ruggeri and A. Pucci, Chem. Soc. Rev., 2013, 42, 857–870 RSC;
(j) A. Pucci and G. Ruggeri, J. Mater. Chem., 2011, 21, 8282–8291 RSC;
(k) P. Gautam, R. Maragani, S. M. Mobin and R. Misra, RSC Adv., 2014, 4, 52526–52529 RSC;
(l) T. Jadhav, B. Dhokale, Y. Patil and R. Misra, RSC Adv., 2015, 5, 68187–68191 RSC;
(m) T. Jadhav, B. Dhokale and R. Misra, J. Mater. Chem. C, 2015, 3, 9063–9068 RSC;
(n) T. Jadhav, J. M. Choi, J. Shinde, J. Y. Lee and R. Misra, J. Mater. Chem. C, 2017, 5, 6014–6020 RSC.
- Y. Hong, J. W. Y. Lam and B. Z. Tang, Chem. Commun., 2009, 4332–4353 RSC.
- J. Mei, N. L. C. Leung, R. T. K. Kwok, J. W. Y. Lam and B. Z. Tang, Chem. Rev., 2015, 115, 11718–11940 CrossRef CAS PubMed.
-
(a) Z. Guo, A. Shao and W. H. Zhu, J. Mater. Chem. C, 2016, 4, 2640–2646 RSC;
(b) A. Shao, Z. Guo, S. Zhu, S. Zhu, P. Shi, H. Tian and W. Zhu, Chem. Sci., 2014, 5, 1383–1389 RSC;
(c) C. X. Shi, Z. Q. Guo, Y. L. Yan, S. Q. Zhu, Y. S. Xie, Y. S. Zhao, W. H. Zhu and H. Tian, ACS Appl. Mater. Interfaces, 2013, 5, 192–198 CrossRef CAS PubMed.
- H. Li, Y. Guo, G. Li, H. Xiao, Y. Lei, X. Huang, J. Chen, H. Wu, J. Ding and Y. Cheng, J. Phys. Chem. C, 2015, 119, 6737–6748 CAS.
-
(a) Y. Liu, Y. Lei, M. Liu, F. Li, H. Xiao, J. Chen, X. Huang, W. Gao, H. Wu and Y. Cheng, J. Mater. Chem. C, 2016, 4, 5970–5980 RSC;
(b) Y. Lei, D. Yang, H. Hua, C. Dai, L. Wang, M. Liu, X. Huang, Y. Guo, Y. Cheng and H. Wu, Dyes Pigm., 2016, 133, 261–272 CrossRef CAS;
(c) Y. Lei, Y. Liu, Y. Guo, J. Chen, X. Huang, W. Gao, L. Qian, H. Wu, M. Liu and Y. Cheng, J. Phys. Chem. C, 2015, 119, 23138–23148 CrossRef CAS;
(d) Y. Zhou, L. Qian, M. Liu, X. Huang, Y. Wang, Y. Cheng, W. Gao, G. Wu and H. Wu, J. Mater. Chem. C, 2017, 5, 9264–9272 RSC.
- Y. Lei, Y. Zhou, L. Qian, Y. Wang, M. Liu, X. Huang, G. Wu, H. Wu, J. Ding and Y. Cheng, J. Mater. Chem. C, 2017, 5, 5183–5192 RSC.
-
(a) X. Du, F. Xu, M. S. Yuan, P. Xue, L. Zhao, D. E. Wang, W. Wang, Q. Tu, S. W. Chen and J. Wang, J. Mater. Chem. C, 2016, 4, 8724–8730 RSC;
(b) X. Luo, W. Zhao, J. Shi, C. Li, Z. Liu, Z. Bo, Y. Q. Dong and B. Z. Tang, J. Phys. Chem. C, 2012, 116, 21967–21972 CrossRef CAS.
-
(a) T. Jadhav, B. Dhokale, S. M. Mobin and R. Misra, RSC Adv., 2015, 5, 29878–29884 RSC;
(b) T. Jadhav, B. Dhokale, S. M. Mobin and R. Misra, J. Mater. Chem. C, 2015, 3, 9981–9988 RSC;
(c) A. Ekbote, T. Jadhav and R. Misra, New J. Chem., 2017, 41, 9346–9353 RSC.
- Q. Lu, X. Li, J. Li, Z. Yang, B. Xu, Z. Chi, J. Xu and Y. Zhang, J. Mater. Chem. C, 2015, 3, 1225–1234 RSC.
-
(a) X. Zhang, Z. Chi, X. Zhou, S. Liu, Y. Zhang and J. Xu, J. Phys. Chem. C, 2012, 116, 23629–23638 CrossRef CAS;
(b) X. Zhang, Z. Chi, B. Xu, C. Chen, X. Zhou, Y. Zhang, S. Liu and J. Xu, J. Mater. Chem., 2012, 22, 18505–18513 RSC.
- X. Zhang, Z. Ma, Y. Yang, X. Zhang, Z. Chi, S. Liu, J. Xu, X. Jia and Y. Wei, Tetrahedron, 2014, 70, 924–929 CrossRef CAS.
- Z. He, L. Zhang, J. Mei, T. Zhang, J. W. Y. Lam, Z. Shuai, Y. Q. Dong and B. Z. Tang, Chem. Mater., 2015, 27, 6601–6607 CrossRef CAS.
-
(a) B. Xu, J. He, Y. Mu, Q. Zhu, S. Wu, Y. Wang, Y. Zhang, C. Jin, C. Lo, Z. Chi, A. Lien, S. Liu and J. Xu, Chem. Sci., 2015, 6, 3236–3241 RSC;
(b) J. Cheng, Y. Li, R. Sun, J. Liu, F. Gou, X. Zhou, H. Xiang and J. Liu, J. Mater. Chem., 2015, 3, 11099–11110 CAS.
-
(a) Q. Qi, J. Zhang, B. Xu, B. Li, S. X. A. Zhang and W. Tian, J. Phys. Chem. C, 2013, 117, 24997–25003 CrossRef CAS;
(b) X. Mei, G. Wen, J. Wang, H. Yao, Y. Zhao, Z. Lin and Q. Ling, J. Mater. Chem. C, 2015, 3, 7267–7271 RSC;
(c) X. Gu, J. Yao, G. Zhang, Y. Yan, C. Zhang, Q. Peng, Q. Liao, Y. Wu, Z. Xu, Y. Zhao, H. Fu and D. Zhang, Adv. Funct. Mater., 2012, 22, 4862–4872 CrossRef CAS;
(d) Y. Zhang, Q. Song, K. Wang, W. Mao, F. Cao, J. Sun, L. Zhan, Y. Lv, Y. Ma, B. Zou and C. Zhang, J. Mater. Chem. C, 2015, 3, 3049–3054 RSC;
(e) K. Wang, H. Zhang, S. Chen, G. Yang, J. Zhang, W. Tian, Z. Su and Y. Wang, Adv. Mater., 2014, 26, 6168–6173 CrossRef CAS PubMed.
Footnote |
| † Electronic supplementary information (ESI) available: DSC curves, XRD curves, solid-state absorption spectra, intermolecular interactions in the crystals, and NMR spectra. CCDC 1569086–1569090. For ESI and crystallographic data in CIF or other electronic format see DOI: 10.1039/c7ra09515e |
|
| This journal is © The Royal Society of Chemistry 2017 |
Click here to see how this site uses Cookies. View our privacy policy here. 
 Open Access Article
 This Open Access Article is licensed under a
  b,
Wenxia Gaoa,
Jinchang Dinga,
Xiaobo Huang
b,
Wenxia Gaoa,
Jinchang Dinga,
Xiaobo Huang