 Open Access Article
Creative Commons Attribution 3.0 Unported Licence
Behavior of H2O surrounding NH4+ and Al3+ in NH4Al(SO4)2·12H2O by 1H MAS NMR, 14N NMR, and 27Al NMR
Ae Ran Lim *ab
*ab
aAnalytical Laboratory of Advanced Ferroelectric Crystals, Jeonju University, Jeonju 55069, Korea
bDepartment of Science Education, Jeonju University, Jeonju 55069, Korea. E-mail: aeranlim@hanmail.net; arlim@jj.ac.kr
First published on 5th December 2017
Abstract
In order to understand the thermodynamic properties and structural geometry of NH4Al(SO4)2·12H2O, we studied the magic angle spinning nuclear magnetic resonance (MAS NMR) and static NMR as a function of temperature. The changes of the chemical shifts, linewidths, resonance frequencies, and spin–lattice relaxation times for 1H, 14N, and 27Al nuclei near Td (=335 K), which is interpreted as the onset of partial thermal decomposition, are due to the structural phase transition. The changes near Td are related to the loss of H2O, which probably disrupts the forms of the octahedra of water molecules surrounding NH4+ and Al3+ ions. This mechanism above Td is related to hydrogen-bond transfer involving the breakage of the weak part of the hydrogen bond.
I. Introduction
The alums can be represented by the general formula AIBIII(SO4)2·12H2O, where A is a monovalent cation such as Na, K, Rb, Cs, or NH4, and B is a trivalent cation such as Al, Fe, or Cr.1–11 It is well known that there are a considerable number of alums AIBIII(SO4)2·12H2O that exhibit ferroelectric activity.12 The twelve water molecules are located in an octahedral coordination in two crystallographically-different areas surrounding the AI cation and the BIII ion complex. A complex network of H-bonds is one of the main features of alum structures. Current interest in these compounds lies in the fact that a number of them, particularly when AI is NH4, are ferroelectric at low temperature. NH4Al(SO4)2·12H2O crystals, one of the AIBIII(SO4)2·12H2O types, have a cubic structure and belong to the space group Pa![[3 with combining macron]](https://www.rsc.org/images/entities/char_0033_0304.gif) with Z = 4 per unit cell at room temperature. The lattice constants of NH4Al(SO4)2·12H2O crystals are a = b = c = 12.242 Å.13 The NH4+ and Al3+ ions in the NH4Al(SO4)2·12H2O crystal are each surrounded by six water molecules, as shown in Fig. 1. As in other alums, each trivalent Al3+ is surrounded by an almost regular octahedron of six water molecules, whereas the remaining six water molecules surrounding the NH4+ cation form a highly distorted octahedron. In the case of NH4Al(SO4)2·12H2O, the bond-length of Al–6H2O is 1.916 Å and the bond-length of NH4–6H2O has a mean value of 3.051 Å.14
with Z = 4 per unit cell at room temperature. The lattice constants of NH4Al(SO4)2·12H2O crystals are a = b = c = 12.242 Å.13 The NH4+ and Al3+ ions in the NH4Al(SO4)2·12H2O crystal are each surrounded by six water molecules, as shown in Fig. 1. As in other alums, each trivalent Al3+ is surrounded by an almost regular octahedron of six water molecules, whereas the remaining six water molecules surrounding the NH4+ cation form a highly distorted octahedron. In the case of NH4Al(SO4)2·12H2O, the bond-length of Al–6H2O is 1.916 Å and the bond-length of NH4–6H2O has a mean value of 3.051 Å.14
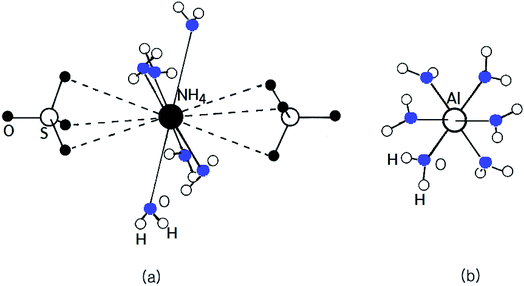 | ||
| Fig. 1 The cubic structure of NH4Al(SO4)2·12H2O single crystals at room temperature. (a) Six water molecules surrounding NH4+ and (b) six water molecules surrounding Al3+. | ||
The phase transition temperature of NH4Al(SO4)2·12H2O crystals at low temperature has been reported to be 58 K and 71 K on cooling and heating, respectively.9,13 According to previous reports, NH4Al(SO4)2·12H2O melts congruently at 367.13 K with a phase transition enthalpy of 122.2 kJ mol−1.11 In addition, the phase transition temperatures were reported as 370 K, 390 K, and 495 K using differential scanning calorimetry (DSC) by our group.15 Furthermore, the mass loss begins in the vicinity of 335 K (=Td), which is interpreted as the onset of partial thermal decomposition. On the other hand, the quadrupole coupling constants for 14N and 27Al in NH4Al(SO4)2·12H2O crystals have been reported to be 202 kHz and 446 kHz at room temperature, respectively.16–19 The 1H spin–lattice relaxation time T1 in the laboratory frame and spin–lattice relaxation time T1ρ in the rotating frame of NH4Al(SO4)2·12H2O below 200 K have been studied by Svare et al.,20 and were explained in terms of the hopping of NH4+ between two positions with different orientations and electron dipole moments.19 In addition, the nuclear magnetic resonance (NMR) spectrum and the spin–lattice relaxation times in the laboratory frame for 1H and 27Al of NH4Al(SO4)2·12H2O crystals above 180 K were previously reported; the changes in the temperature dependences of the relaxation times near Td were related to the loss of H2O, which probably disrupts the forms of the octahedral of water molecules surrounding Al3+.15 Although these interesting properties have been studied by many methods, those related to the thermodynamic properties at high temperature have not yet been reported.
In the present study, the chemical shift, linewidth, and spin–lattice relaxation time, T1ρ, in the rotating frame of NH4Al(SO4)2·12H2O were measured as a function of temperature using 1H magic angle spinning (MAS) NMR, focusing on the role of NH4 and H2O. In addition, the 14N NMR spectra in NH4Al(SO4)2·12H2O single crystals as a function of temperature were discussed in order to elucidate the structural geometry. At high temperature, we use these results to analyze the behavior of NH4+ and Al3+ surrounded by six water molecules, respectively, from the results of 1H MAS NMR, 14N NMR here obtained, and the 27Al NMR previously reported. The connection between the crystal structure and the thermal properties of NH4Al(SO4)2·12H2O is discussed.
II. Experimental procedure
Single crystals of NH4Al(SO4)2·12H2O were prepared by the slow evaporation of an aqueous solution. The single crystals are transparent, colorless, and hexagonally-shaped.1H MAS NMR spectra and the spin–lattice relaxation time T1ρ in the rotating frame were obtained at the Larmor frequency of 400.13 MHz using a Bruker 400 MHz NMR spectrometer at the Korea Basic Science Institute, Western Seoul Center. Chemical shifts were referred with respect to tetramethylsilane (TMS). Powdered samples were placed in a 4 mm CP/MAS probe, and the MAS rate was set to 10 kHz for 1H MAS measurement to minimize spinning sideband overlap. 1H T1ρ values were determined using a π/2–t sequence by varying the duration of the spin-locking pulses. The widths of the π/2 pulses used for measuring the T1ρ values of 1H were 3.6 μs below 340 K and 4.35 μs above 350 K.
In addition, the 14N NMR spectra of the NH4Al(SO4)2·12H2O single crystals in the laboratory frame were measured using a Unity INOVA 600 NMR spectrometer at the Korea Basic Science Institute, Western Seoul Center. The static magnetic field was 14.1 T, and the Larmor frequency was set to ω0/2π = 43.342 MHz. The 14N NMR experiments were performed using a solid-state echo sequence: 4.5 μs–t–4.5 μs–t. The temperature dependent NMR measurements were obtained over the temperature range 180–400 K. The samples were maintained at a constant temperature by controlling the nitrogen gas flow and the heater current.
III. Experimental results and discussion
A. 1H MAS NMR
The 1H MAS NMR spectrum in NH4Al(SO4)2·12H2O was measured as a function of temperature. The 1H MAS NMR spectra shows only one peak at a chemical shift of δ = 6.6 ppm at room temperature, as shown in Fig. 2. There are ammonium protons and water protons of two kinds in the NH4Al(SO4)2·12H2O structure. In our experimental results, the proton signals due to the ammonium and water protons cannot be distinguished; the four ammonium protons and the twenty-four water protons should yield two superimposed lines with intensity in a theoretical ratio of 1![[thin space (1/6-em)]](https://www.rsc.org/images/entities/char_2009.gif) :
:![[thin space (1/6-em)]](https://www.rsc.org/images/entities/char_2009.gif) 6. The signal due to the ammonium protons might include the signal due to the water protons with a broad linewidth. The abrupt change in the chemical shift near 335 K (=Td), interpreted as the onset of partial thermal decomposition, may be due to the breaking of N–H bonds in NH4 or loss of H2O.
6. The signal due to the ammonium protons might include the signal due to the water protons with a broad linewidth. The abrupt change in the chemical shift near 335 K (=Td), interpreted as the onset of partial thermal decomposition, may be due to the breaking of N–H bonds in NH4 or loss of H2O.
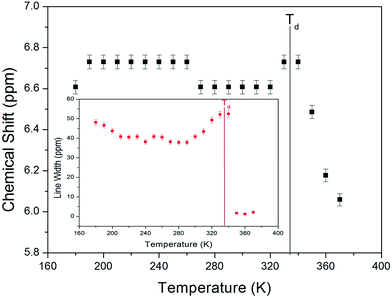 | ||
| Fig. 2 Chemical shift of 1H MAS NMR spectrum in NH4Al(SO4)2·12H2O as a function of temperature (inset: line width of 1H MAS NMR spectrum in NH4Al(SO4)2·12H2O as a function of temperature). | ||
The full width at half maximum (FWHM) of the 1H MAS NMR signal as a function of temperature is shown in the inset in Fig. 2. As the temperature increases, the FWHM near Td decreases in a stepwise shape. This stepwise narrowing is generally caused by internal motions, which have a temperature dependence that is related to that observed for the chemical shift. The shape of the line abruptly changes with increasing temperature from the Gaussian shape of a rigid lattice to a Lorentzian shape. The linewidth below Td is severely broadened because of the overlap of the ammonium protons and water protons. Above Td, the linewidth undergoes an abrupt drop, and the linewidth becomes much narrower. This mechanism above Td is related to hydrogen-bond transfer involving the breakage of the weak part of the hydrogen bond.
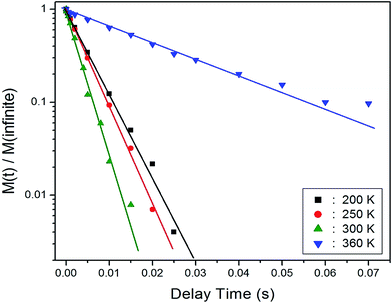
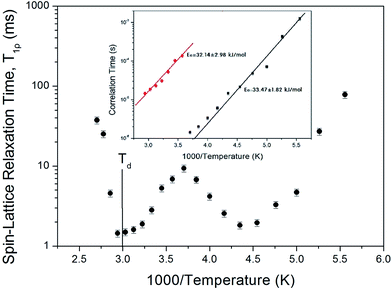
The recovery traces for the resonance line of 1H in NH4Al(SO4)2·12H2O are represented by a single exponential function of M(t) = M(∞)exp(−t/T1ρ), where M(t) is the magnetization as a function of the spin-locking pulse duration t, and M(∞) is the total nuclear magnetization of 1H at thermal equilibrium.21 Fig. 3 shows the recovery traces fitted with the single exponential function for delay times ranging from 0.001 ms to 70 ms at 200, 250, 300, and 360 K. The recovery traces for the 1H nuclei vary with the delay time. These recovery traces also varied depending upon the temperature. From the slopes of the recovery traces, the 1H spin–lattice relaxation time, T1ρ, in the rotating frame is obtained in Fig. 4 as a function of inverse temperature. As for the chemical shift, the T1ρ values of 1H are significantly different with the temperature. This indicates that the configuration of 1H in the NH4 and H2O is strongly dependent on the temperature. The significant difference in the T1ρ values indicates that NH4Al(SO4)2·12H2O is strongly affected, which is mainly the result of structural changes involving water molecules. The proton T1ρ data show evidence of a change near Td, which coincides with the measured changes in the 1H chemical shift. The 1H T1ρ values are strongly dependent the temperature, i.e., distinct molecular motions are present as the temperature changes. Below Td, the relaxation time undergoes two minimum of 1.81 ms at 230 K and 1.44 ms at 340 K, respectively.
The T1ρ values are related to the rotational correlation time τC, which directly measures the rate of molecular motion. The experimental value of T1ρ can be expressed in terms of τC using a molecular motion suggested by the Bloembergen–Purcell–Pound (BPP) theory. T1ρ for a spin–lattice interaction of molecular motion is given by22–24
| T1ρ−1 = (n/20)(γHγNħ/rH−N3)2[4g(ω1) + g(ωH − ωN) + 3g(ωN) + 6g(ωH + ωN) + 6g(ωH)], | (1) |
| g(ω1) = τC/[1 + ω12τC2], |
| g(ωH − ωN) = τC/[1 + (ωH − ωN)2τC2], |
| g(ωN) = τC/[1 + ωN2τC2], |
| g(ωH + ωN) = τC/[1 + (ωH + ωN)2τC2], and |
| g(ωH) = τC/[1 + ωH2τC2]. |
τC = τo![[thin space (1/6-em)]](https://www.rsc.org/images/entities/char_2009.gif) exp(−Ea/RT), exp(−Ea/RT),
| (2) |
![[thin space (1/6-em)]](https://www.rsc.org/images/entities/char_2009.gif) τC vs. 1000/T plot, which is shown inset in Fig. 4. For tumbling motion, we obtained the values Ea = 33.47 ± 1.82 kJ mol−1 and Ea = 32.14 ± 2.98 kJ mol−1 for the low- and high-temperature, respectively. These values are considered equal within the error range.
τC vs. 1000/T plot, which is shown inset in Fig. 4. For tumbling motion, we obtained the values Ea = 33.47 ± 1.82 kJ mol−1 and Ea = 32.14 ± 2.98 kJ mol−1 for the low- and high-temperature, respectively. These values are considered equal within the error range.
B. 14N NMR
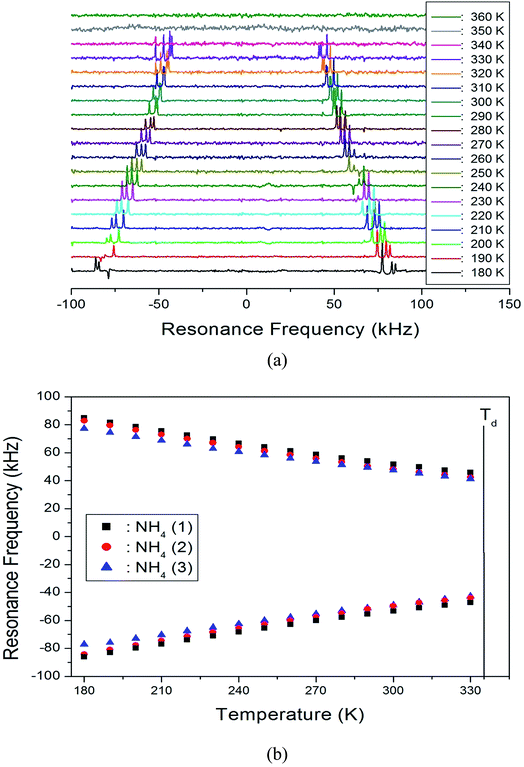
In order to obtain information concerning the possible distortion surrounded the 14N ion, the NMR spectrum of 14N (I = 1) was obtained using static NMR at a Larmor frequency of ω0/2π = 43.342 MHz, as a function of temperature. Two resonance lines were expected from the quadrupole interactions of the 14N nucleus. The magnetic field was applied along the crystallographic axis. The in situ 14N NMR spectra and the resonance frequency in NH4Al(SO4)2·12H2O single crystals are plotted in Fig. 5(a and b), as a function of temperature. The 14N NMR spectra of the three groups of two resonance lines for 14N are attributed to the NH4. The lines represented by the same color indicate the same pairs for 14N, as shown in Fig. 5(b). According to the crystallography results previously reported, the NH4 tetrahedron appears to be slightly elongated along a 3-fold symmetry axis; the NH4+ ions have a longer N–H distance and shorter N–H distance.25 The results of the three groups of 14N show that the tetrahedral symmetry for NH4+ ion is not highly symmetric and that the stronger distortion of the crystallography is indicated. In addition, this splitting of the 14N resonance lines slightly decreases with increasing temperature. Note that temperature-dependent changes in the 14N resonance frequency are generally attributed to changes in the structural geometry, indicating a change in the quadrupole coupling constant of the 14N nuclei. In addition, the 14N signal near Td disappears, and this phenomenon may be related to the ammonium ions dissociating.C. 27Al NMR
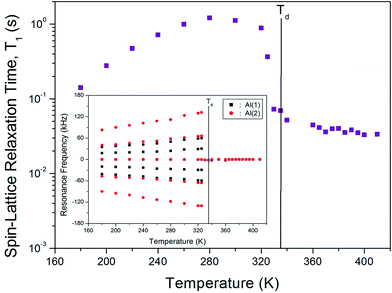
The NMR spectrum of 27Al (I = 5/2) consists of a central line and four satellite resonance lines. The NH4Al(SO4)2·12H2O crystal structure is cubic, so a single resonance line is expected for the 27Al nuclei. However, the NMR spectrum of 27Al in NH4Al(SO4)2·12H2O single crystals below Td shows two groups of five resonance lines, as shown inset in Fig. 6. Moreover, only one 27Al resonance line above Td is obtained. The two types of magnetically inequivalent Al nuclei, Al(1) and Al(2), are present in the unit cell. Although the structure of the NH4Al(SO4)2·12H2O crystal is cubic, the environment of the Al sites surrounded by water molecules is not cubic; the water molecules surrounding Al3+ form a distorted octahedron. The presence of only one 27Al resonance line near Td is due to the structural phase transition. On the other hand, the temperature dependence of the resonance frequency of 14N decreases with increasing temperature, whereas those of 27Al have an opposite tendency to the usual decrease with increasing temperature.The magnetization recovery of 27Al does not follow a single exponential, but can be represented by a combination of three exponential functions:15,26
[M(∞) − M(t)]/M(∞) = 0.06![[thin space (1/6-em)]](https://www.rsc.org/images/entities/char_2009.gif) exp(−0.8W1t) − 0.85 exp(−0.8W1t) − 0.85![[thin space (1/6-em)]](https://www.rsc.org/images/entities/char_2009.gif) exp(−1.5W1t) − 0.09 exp(−1.5W1t) − 0.09![[thin space (1/6-em)]](https://www.rsc.org/images/entities/char_2009.gif) exp(−0.33W1t), exp(−0.33W1t),
| (3) |
The 27Al spin–lattice relaxation time, T1, in the laboratory frame was measured in the temperature range of 180–420 K. The T1 for 27Al in this single crystal show very strong temperature dependences, as shown in Fig. 6. The T1 for the Al(1) and Al(2) sites cannot be distinguished because of the overlap of the two central resonance lines for the Al(1) and Al(2) nuclei. T1 near Td is an abrupt drop, and T1 above Td is nearly constant with temperature. The change in the temperature dependence of T1 near Td is related to the beginning of the loss of H2O. This drop is related to the loss of H2O, and the forms of the octahedra of water molecules surrounding Al3+ are probably disrupted by the loss of H2O.
IV. Conclusion
The thermodynamic properties and structural geometry of NH4Al(SO4)2·12H2O focusing on the role of NH4 and H2O, were investigated by 1H MAS NMR, static 14N NMR, and 27Al NMR as a function of temperature. The changes in the temperature dependences of chemical shifts, line widths, spin–lattice relaxation times, and resonance frequency near Td are related to changes in the symmetry of the octahedra of water molecules about NH4+ and Al3+; these changes are related to the loss of H2O, which probably disrupts the forms of the octahedra of water molecules surrounding NH4+ and Al3+. The structural changes due to the loss of H2O are significant at Td, and the transformation at Td is due to the breaking of hydrogen bonds. This mechanism above Td is related to hydrogen-bond transfer involving the breakage of the weak part of the hydrogen bond.Conflicts of interest
There are no conflicts to declare.Acknowledgements
This research was supported by the Basic Science Research program through the National Research Foundation of Korea (NRF), funded by the Ministry of Education, Science, and Technology (2016R1A6A1A03012069 and 2015R1A1A3A04001077).References
- V. K. Sabirov, J. Struct. Chem., 2015, 56, 698 CrossRef CAS.
- S. You, Y. Zhang and Y. Zang, J. Cryst. Growth, 2015, 411, 24 CrossRef CAS.
- C. L. Chang, S.-Y. Jeong and Y. K. Paik, J. Appl. Phys., 2013, 113, 17E105 CrossRef.
- C. L. Chang, S.-Y. Jeong and Y. K. Paik, Appl. Magn. Reson., 2013, 44, 1245 CrossRef CAS.
- N. Kubota and M. Onosawa, J. Cryst. Growth, 2009, 311, 4525 CrossRef CAS.
- M. Boujelben, M. Toumi and T. Mhiri, Ann. Chimie Sci. Matériaux, 2008, 33, 379 CrossRef CAS.
- Y. M. Korchak, V. B. Kapustyanyk, M. V. Partyka and V. P. Rudyk, J. Appl. Spectrosc., 2007, 74, 289 CrossRef CAS.
- B. Pacewska and J. Pysiak, J. Therm. Anal., 1991, 37, 1389 CrossRef CAS.
- R. Bohmer, P. Lunkenheimer, J. K. Vij and I. Svare, J. Phys.: Condens. Matter, 1990, 2, 5433 CrossRef.
- S. Radhakrishna, B. V. R. Chowdari and A. K. Viswanath, J. Chem. Phys., 1977, 66, 2009 CrossRef CAS.
- F. Gronvold and K. K. Meisingset, J. Chem. Thermodyn., 1982, 14, 1083 CrossRef.
- A. Sekine, M. Sumita, T. Osaka and Y. Makita, J. Phys. Soc. Jpn., 1988, 57, 4004 CrossRef CAS.
- A. M. Abdeen, G. Will, W. Schafer, A. Kirfel, M. O. Bargouth and K. Recker, Z. Kristallogr., 1981, 157, 147 CAS.
- A. C. Larson and D. T. Cromer, Acta Crystallogr., 1967, 22, 793 CrossRef CAS.
- A. R. Lim, H.-G. Moon and J.-H. Chang, Chem. Phys., 2010, 371, 91 CrossRef CAS.
- W. G. Segleken and H. C. Torrey, Phys. Rev., 1973, 38, 1255 Search PubMed.
- N. Weiden and A. Weiss, Berichte der Bunsengesellschaft für physikalische Chemie, 1974, 78, 1031 CAS.
- W. C. Bailey and H. C. Story, J. Chem. Phys., 1974, 60, 1952 CrossRef CAS.
- S. Sinha and R. Srinivasan, Pramana, 1984, 22, 345 CrossRef CAS.
- I. Svare and R. M. Holt, Solid State Commun., 1979, 29, 851 CrossRef CAS.
- A. Abragam, The Principles of Nuclear Magnetism, Oxford University Press, 1961 Search PubMed.
- J. L. Koenig, Spectroscopy of Polymers, Elsevier, New York, 1999 Search PubMed.
- A. R. Lim, AIP Adv., 2016, 6, 35307 CrossRef.
- A. R. Lim, J. Mol. Struct., 2017, 1146, 324 CrossRef CAS.
- D. T. Cromer and M. I. Kay, Acta Crystallogr., 1967, 22, 800 CrossRef CAS.
- E. R. Andrew and D. T. Tunstall, Proc. Phys. Soc., London, 1961, 78, 1 CrossRef CAS.
| This journal is © The Royal Society of Chemistry 2017 |

