DOI:
10.1039/C7RA09470A
(Paper)
RSC Adv., 2017,
7, 49015-49023
Cochinchinenin C, a potential nonpolypeptide anti-diabetic drug, targets a glucagon-like peptide-1 receptor
Received
28th August 2017
, Accepted 12th October 2017
First published on 18th October 2017
Abstract
The glucagon-like peptide-1 (GLP-1) receptor is currently being explored as a therapeutic target for anti-diabetic drugs. GLP-1 analogs possess therapeutic effects similar to those of other anti-diabetic drugs such as guanidine and sulfonylureas but do not cause hypoglycemia and gastrointestinal discomfort. GLP-1 has the ability to reduce blood glucose in a glucose-dependent manner. Several GLP-1 analog agonists have been developed. However, polypeptide drugs are easily degraded by DPP4 in vivo. Therefore, the focus is now on the development of nonpolypeptide anti-diabetic drugs targeting the GLP-1 receptor. In this study, computer-aided drug design was applied to search for potential molecules of this type. Cochinchinenin C, extracted from sangusis draconi, interacted well with GLP-1 receptor via hydrophobic interaction, which was confirmed by fluorescence spectroscopy and molecular simulation. In cell experiments, it was demonstrated that pancreatic beta cells promoted insulin secretion upon treatment with cochinchinenin C, and increases of intracellular cAMP and ATP levels also occurred, indicating GLP-1 receptor activation and glucose metabolism. These results showed that cochinchinenin C has potential for the development of drugs for treating diabetes.
1 Introduction
Type 2 diabetes mellitus, the most common type of diabetes mellitus, is one of the most prevalent noncommunicable diseases globally. According to a report from the International Diabetes Federation, there are more than 415 million diabetes patients worldwide. It has also been estimated that there will be more than 642 million of such patients by 2040. Diabetes occurs in adults due to insulin resistance and inadequate insulin secretion, which result in elevated blood glucose levels.1,2 Drugs for treating diabetes based on different targets have been developed for the treatment of type 2 diabetes mellitus. Currently, the most widely used therapeutic drugs include guanidine and sulfonylureas, but they also have disadvantages.3,4 For example, guanidine causes the adverse effect of gastrointestinal discomfort, while sulfonylureas can cause hypoglycemia owing to a sustained effect of insulin secretion.5 Hence, researchers are looking for safer, more curative diabetes drugs with fewer side effects. Glucagon-like peptide-1 receptor (GLP-1R) belongs to the glucagon receptor subfamily in the G-protein-coupled receptor B family, which is distributed in pancreatic cells, and the gastrointestinal, cardiovascular, pulmonary, and central nervous systems.6,7 In early 1979, an incretin called GLP-1 was identified, which is a peptide secreted by Langerhans cells derived from the end of the jejunum, ileum, and colon. GLP-1 do not promote formation of insulin, but promote excretion of the hormone.8 One of the main disadvantages of GLP-1 analogs is that they do cause gastrointestinal discomfort like guanidine,9,10 but GLP-1 analogs have the better therapeutic effect. As a glucose-dependent hormone, GLP-1 does not exhibit hypoglycemic effects when the body's blood sugar level is normal. A study found that GLP-1 activated intracellular cAMP in a glucose-dependent manner and then promoted the synthesis of PDX-1 transcription factors, finally promoting the secretion of insulin.11 A series of GLP-1 analog agonists have been developed, such as exendin-4, eventide, and liraglutide.12,13 However, these GLP-1 receptor agonists are easily degraded by DPP4 in vivo and lose their efficacy.14 Therefore, the exploration of nonpeptide GLP-1 receptor agonists has gradually become a focus in the development of GLP-1 receptor agonists. Research on nonpeptide GLP-1 receptor agonists is currently underway. In support of this, Wang et al. established a high-throughput drug screening model for searching for potential nonpeptide GLP-1 receptor agonists.
Sangusis draconis, derived from Daemonorops spp., is mainly composed of flavonoids. Among them, more than 60% of active compounds belong to dihydrochalcone, including cochinchinenin C (Fig. 1)15. Sangusis draconis has numerous pharmacological functions, such as anti-blood-stasis, anticoagulation, and blood-sugar-lowering effects.16,17 Increasing research is now focusing on how sangusis draconis can play a role in the treatment of diabetes. Zhang et al. used a rat hyperglycemia model to reveal that sangusis draconis had a good hypoglycemic effect and could increase insulin secretion.18 Research on the mechanism behind sangusis draconis's hypoglycemic effect is currently ongoing.
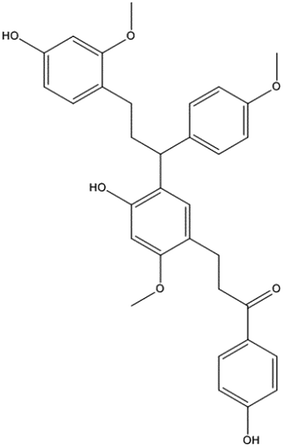 |
| | Fig. 1 The molecular structure of cochinchinenin C. | |
As the structures of biological macromolecules are continually being determined and computer science continues to develop, computer-aided drug design (CADD) has become widely used in the research and development of leading compounds.19,20 According to the structure of the drug target, the interaction between a small-molecule drug and the target protein can be studied by the molecular docking technique, and then the structure of the small molecule can be optimized. Hence, in this study, the interaction between cochinchinenin C and GLP-1 receptor was first determined through computer simulation. Then, this interaction was verified by fluorescence spectroscopy. The levels of insulin secretion, intracellular ATP, cAMP, and glucose in medium and mRNA gene insulin secretion were also determined after incubation of cochinchinenin C in a glucose-dependent manner. Finally, we proposed that cochinchinenin C is a potential nonpeptide GLP-1 receptor agonist.
2 Material and methods
2.1 Materials
The recombinant protein GLP1 receptor was purchased from Creative BioMart and used without further purification, configured as 25 mM. Cochinchinenin C was purchased from National Institutes for Food and Drug Control, and the stock solution of Cochinchinenin C (CC) was prepared in DMSO at 0.01 mol L−1. Here, 50 mM Tris–HCl buffer was used to adjust the pH to 7.4. KRB buffer was composed of 129 mM NaCl, 4.8 mM KCl, 1.2 mM MgSO4, 1.2 mM KH2PO4, 2.5 mM CaCl2, 5 mM NaHCO3, 10 mM HEPES, and 0.1% BSA, pH 7.4.
2.2 Molecular docking
The structure of GLP1 receptor (4ZGM) was obtained from the PDB database (http://www.rcsb.org/pdb). The molecular structure of cochinchinenin C was obtained from the PubChem database (https://pubchem.ncbi.nlm.nih.gov). Discovery Studio 4.1 software was used to simulate the interaction between cochinchinenin C and GLP1 receptor.
2.3 Three-dimensional and two-dimensional fluorescence spectrometry
Three-dimensional fluorescence spectra were obtained at a constant GLP1 receptor concentration (0.025 μmol L−1) in the absence or presence of cochinchinenin C (0.05 μmol L−1). Two-dimensional fluorescence spectra were also obtained at a constant GLP-1 receptor concentration (0.025 μmol L−1) in the absence or presence of cochinchinenin C (0–0.045 μmol L−1). Emission spectra were recorded from 290 to 500 nm when excitation was applied at 280 nm. F0 and F represent the fluorescence intensity of GLP-1 receptor in the absence and presence of cochinchinenin C at an emission wavelength of 340 nm, respectively. Other experimental parameters were as follows: slit width, 5 nm; and voltage, 950 V.
2.4 The quenching mechanism
Stern–Volmer quenching constant (Ksv) and bimolecular quenching rate constant (Kq). Fluorescence spectrometry was performed at different temperatures (300, 305, and 310 K) to obtain the fluorescence spectra. Here, the Stern–Volmer equation (eqn (1)) was used,| | |
F0/F = 1 + Ksv[C] = 1 + Kqτ0[C],
| (1) |
where the slope of the equation represents the Stern–Volmer quenching constant (Ksv). Eqn (2) was also used to calculate Kq:(τ0 is the average lifetime of the protein without quencher, τ0 = 10−8 s).
Binding constant (Ka) and the number of binding sites (n). Eqn (3) was used:| |
lg[(F0 − F)/F] = lg![[thin space (1/6-em)]](https://www.rsc.org/images/entities/char_2009.gif) Ka + nlg[C], Ka + nlg[C],
| (3) |
plotted to lg[C] with lg[(F0 − F)/F], and a linear equation was obtained. The slope of the equation is the number of binding sites (n) and the intercept of the equation is lgKa, from which Ka can be obtained.
Thermodynamic parameters. Eqn (4) was used:| | |
lnKa = −ΔH/RT + ΔS/R,
| (4) |
(T, absolute temperature; R, gas constant = 8.3145 J mol−1 K−1). Plotted to 1/T with lnKa and obtained the linear equation. The slope of the equation is −ΔH/R, and the intercept of the equation is ΔS/R. The enthalpy change (ΔH) and entropy change (ΔS) were calculated. ΔG can be calculated from the following equation: ΔG = ΔH − TΔS.
2.5 Ins-1 cell culture
Ins-1 cells, a rat pancreatic β-cell line purchased from ATCC (US state), were cultured in DMEM high-glucose medium with 10% fetal bovine serum (FBS), 100 U mL−1 penicillin, 100 μg mL−1 streptomycin, 10 mmol L−1 HEPES, 2 mmol L−1 L-glutamine, 1 mmol L−1 sodium pyruvate, and 50 μmol L−1 β-mercaptoethanol at 37 °C in a humidified atmosphere and 5% CO2. The culture medium was replaced every 2 days and passaged every four days following trypsinization. The subculture cells were seeded at a density of 5.0 × 10⁵ cells per mL.
2.6 Insulin secretion
To measure insulin secretion, Ins-1 cells were first seeded onto 24-well plates and cultured for 48 h to approximately 80–90% confluence. The cells were then washed twice with KRB buffer and starved for 2 h in KRB buffer. Next, cells were incubated in fresh KRB buffer containing 10−8 mol L−1 cochinchinenin C at different glucose concentrations (0, 5, 10, 20, and 30 mM). Cellular supernatant was sampled for insulin secretion. Insulin was measured using Iodine [125I]− Insulin Radioimmunoassay Kit (Shanghai Xinfan Biotechnology Co., Ltd.).
2.7 Cell viability
To determine cell viability, Ins-1 cells were seeded onto 96-well plates, where they were incubated in culture medium containing 10−8 mol L−1 cochinchinenin C for different incubation times (1, 2, 4, and 8 h). Cell viability was measured using Cell Counting Kit-8 (CCK-8) (Sangon Biotech (Shanghai) Co., Ltd.).
2.8 Intracellular cAMP and ATP levels
To measure the intracellular levels of cAMP and ATP, Ins-1 cells were seeded onto 96-well plates, where they were washed twice with KRB buffer and starved for 2 h in KRB buffer. Then, the cells were incubated in fresh KRB buffer containing 10−8 mol L−1 cochinchinenin C at different glucose concentrations (0, 5, and 20 mM) for 2 h. Intracellular cAMP was measured using the cAMP-Glo™ Assay Kit and the ATP level was determined using the CellTiter-Glo® Luminescent Kit (Promega Corporation).
2.9 Glucose absorption
To assay glucose absorption, Ins-1 cells were seeded onto 24-well plates, where they were incubated in fresh KRB buffer containing 10−8 mol L−1 cochinchinenin C at different glucose concentrations (0, 5, and 20 mM) for 4 and 8 h. Cellular supernatant was sampled to detect the change of glucose content in the medium. Cellular supernatant were measured using Glucose Assay Kit (Sigma-Aldrich).
2.10 Gene mRNA expression
The relative expression of genes associated with insulin secretion was determined by quantitative RT-PCR using the Bio-Rad CFX96 PCR System. All data are expressed as the ratio of the target gene to β-actin expression.
The primer sequences used for PCR were as follows: pdx-1,5′-aaatccaccaaagctcacgc-3′ (forward) and 5′-aagttgagcatcactgccagc-3′ (reverse); ins, 5′-gacccgcaagtgccacaa-3′ (forward) and 5′-tccacaagccacgcttctg-3′ (reverse); and β-actin, 5′-cccatctatgagggttacgc-3′ (forward) and 5′-tttaatgtcacgcacgatttc-3′ (reverse).
2.11 Statistical analysis
All statistical analyses were conducted using the software IBM SPSS Statistical 20. Data were analyzed using one-way ANOVA. The threshold for statistical significance was set at P < 0.05. Results are presented as mean ± SD.
3 Results and discussion
3.1 The interaction between cochinchinenin C and GLP1 receptor
In our study, the interaction between cochinchinenin C and GLP-1 receptor was first determined based on molecular docking. As seen in Fig. 2A, cochinchinenin C could bind to the extracellular domain of the GLP1 receptor. The site of action of cochinchinenin C–GLP-1 receptor was further analyzed. Cochinchinenin C mainly bound to amino acid residues Ser31, Leu32, Thr35, Val36, Tyr88 and Trp39 of the GLP-1 receptor through hydrophobic interactions (Fig. 2B and C). Hydrogen bonds also formed between cochinchinenin C and GLP-1 receptor (Table 1). As one of the small-molecule GLP-1 agonists, Boc5 was discovered. It was reported that Boc5 has the ability to increase the intracellular level of cAMP.21 Hence, the interaction between Boc5 and GLP-1 receptor was measured to compare the result for cochinchinenin C–GLP-1 receptor (Fig. 2D–F). Surprisingly, it could be found that amino acid residues Trp39, Trp88 and Leu32 were also the key residues between Boc5 and GLP-1 receptor. What's more, hydrophobic interactions and hydrogen bonds were also formed between Boc5 and GLP-1 receptor (Table 2). Therefore, it could be seen that cochinchinenin C might be the potential agonist of GLP-1 receptor.
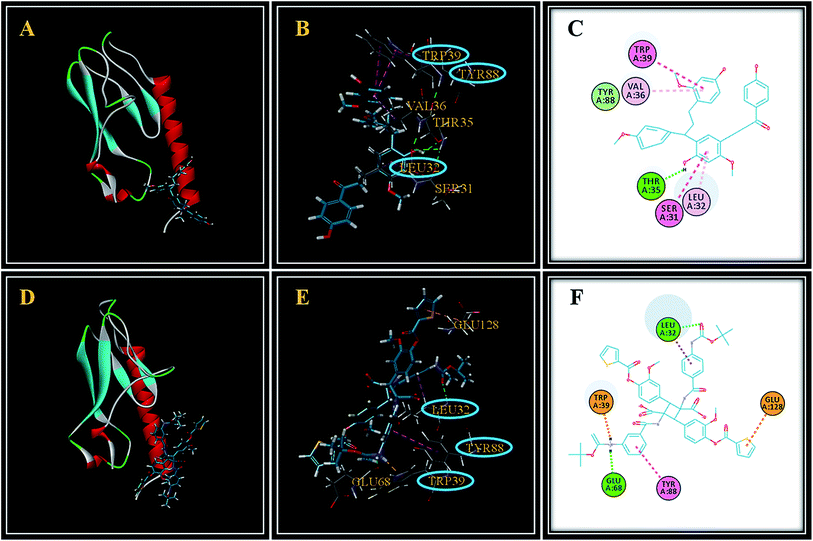 |
| | Fig. 2 Interaction between drugs and GLP-1 receptor through molecular docking. (A–C) Cochinchinenin C–GLP-1 receptor (D–F) Boc5–GLP-1 receptor. | |
Table 1 Parameters of the interaction between cochinchinenin C and GLP-1 receptor
| Acting force |
Bond length (Å) |
From |
To |
| 4.74948 |
Hydrophobic |
GLP1R:TRP39 |
CC |
| 5.02218 |
Hydrophobic |
GLP1R:TRP39 |
CC |
| 4.94458 |
Hydrophobic |
GLP1R:SER31:C,O; LEU32:N |
CC |
| 4.34227 |
Hydrophobic |
CC |
GLP1R:LEU32 |
| 4.84843 |
Hydrophobic |
CC |
GLP1R:VAL36 |
| 2.19292 |
Hydrogen bond |
CC |
GLP1R:THR35:OG1 |
Table 2 Parameters of the interaction between BOC5 and GLP-1 receptor
| Acting force |
Bond length (Å) |
From |
To |
| 2.30382 |
Hydrogen bond |
GLP1R:LEU32:HN |
BOC5 |
| 1.96945 |
Hydrogen bond |
BOC5 |
GLP1R:GLU68:O |
| 2.38363 |
Hydrogen bond |
BOC5 |
GLP1R:TRP39 |
| 4.80812 |
Electrostatic |
GLP1R:GLU128:OE2 |
BOC5 |
| 2.85583 |
Hydrophobic |
GLP1R:LEU32:HB2 |
BOC5 |
| 5.68481 |
Hydrophobic |
GLP1R:TYR88 |
BOC5 |
Based on the results of molecular docking analysis, further study of the interaction between cochinchinenin C and GLP-1 receptor was performed by three-dimensional fluorescence spectroscopy. As shown in Fig. 3A, there were two characteristic fluorescence peaks upon excitation at 230 nm and 280 nm. The luminescence at the excitation at 230 nm resulted from the structure of the protein polypeptide chain,22 while that at the excitation at 280 nm resulted from spontaneous fluorescence amino acid residues, tyrosine, tryptophan, and phenylalanine.23 However, cochinchinenin C has very weak fluorescence in solution. Hence, the fluorescence of GLP-1 receptor can be used as a probe to determine the interaction between cochinchinenin C and GLP-1 receptor based on the change of fluorescence intensity. The fluorescence peak at 347 nm upon excitation at 280 nm was selected. The fluorescence peak position remained unchanged after adding cochinchinenin C, but the fluorescence intensity decreased by about 53.9% (Fig. 3B). This showed that cochinchinenin C affected the fluorescence intensity of the GLP-1 receptor. Therefore, it was confirmed that cochinchinenin C did indeed interact with GLP-1 receptor. The interaction between cochinchinenin C and GLP-1 receptor was also studied by two-dimensional fluorescence spectroscopy. The fluorescence of GLP-1 receptor decreased upon the addition of cochinchinenin C, which showed that there was an interaction between cochinchinenin C and GLP-1 receptor (Fig. 3C).
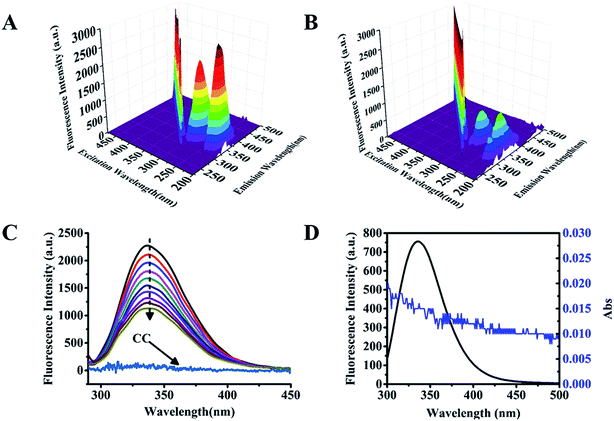 |
| | Fig. 3 Interaction between cochinchinenin C and GLP-1 receptor through spectral method. (A and B) GLP-1 receptor's three-dimensional fluorescence spectroscopy in the presence or absence of cochinchinenin C. (C) Two-dimensional fluorescence spectroscopy, keeping GLP-1 receptor' concentration constant (0.025 mol L−1) while varying the cochinchinenin C concentration from 0 mol L−1 to 0.045 mol L−1; fluorescence intensity of cochinchinenin C (0.025 mol L−1) alone, line CC. (D) Overlap of the fluorescence spectra of GLP-1 receptor (0.025 mol L−1) and the absorption spectra of cochinchinenin C (0.05 mol L−1). | |
The overlap integral of the fluorescence emission spectra of GLP-1 receptor and the UV-vis spectra of cochinchinenin C (Fig. 3D) was calculated to obtain the critical energy transfer distance R0. The following formula was used to determine the efficiency of nonradiative energy transfer E between GLP-1 receptor and cochinchinenin C: E = 1 − F/F0 = (R0)6/((R0)6 + (r)6), where F and F0 are the fluorescence GLP-1 receptor intensity in the presence and absence of cochinchinenin C. The distance r between GLP-1 receptor and cochinchinenin C could be calculated according to Forster's theory.24 These parameters could be obtained: E = 0.39%, r = 2.88 nm. The donor–acceptor distance between cochinchinenin C and the tryptophan residue distance R0 = 2.79, which was less than 7 nm, and 0.5R0 < r < 1.5R0, indicating that nonradiative energy transfer occurred between cochinchinenin C and GLP-1 receptor.
3.2 Quenching mechanism of the interaction between cochinchinenin C and GLP-1 receptor
Two-dimensional fluorescence spectroscopy was performed at different temperatures (300, 305, and 310 K) while varying the concentration of cochinchinenin C from 0 to 0.045 μmol L−1 (Fig. 4). As shown in Table 3, the Ksv value of cochinchinenin C–GLP-1 receptor gradually increased with increasing temperature. This suggested that the fluorescence quenching between cochinchinenin C and GLP-1 receptor might be dynamic because molecules moved faster in the solution with increasing temperature, which increased the probability of a collision between the excited-state fluorescence molecule and the quenching agent. In addition, the binding constant Ka and the number of binding sites n between cochinchinenin C and GLP-1 receptor were calculated. The results revealed that the binding constant between cochinchinenin C and GLP-1 receptor increased with increasing temperature and the binding constant is approximately 1.
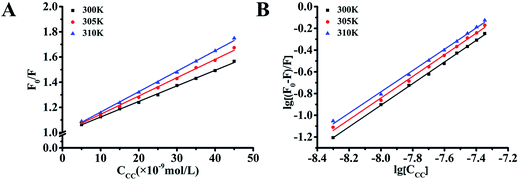 |
| | Fig. 4 Thermodynamic parameters of the interaction between cochinchinenin C and GLP-1 receptor. (A) Stern–Volmer curves of GLP-1 receptor fluorescence quenched cochinchinenin C. (B) Double-log plots of cochinchinenin C quenching effect on GLP-1 receptor's fluorescence. | |
Table 3 Quenching constant Ksv, quenching rate constant Kq, binding constant Ka, and binding site n of cochinchinenin C with GLP1 receptor
| Compound |
T (K) |
Ksv (×106 L mol−1) |
Kq (×1014 L mol−1) |
Ka (×106 L mol−1) |
n |
| |
300 |
1.24 |
1.24 |
7.05 |
0.99 |
| Cochinchinenin C |
305 |
1.45 |
1.45 |
7.12 |
0.99 |
| |
310 |
1.62 |
1.62 |
7.16 |
0.98 |
The thermodynamic parameters of the interaction between cochinchinenin C and GLP-1 receptor could be calculated using the following equation: lnKa = −ΔH/RT + ΔS/R. ΔG could also be calculated using the following equation: ΔG = ΔH − TΔS. As shown in Table 4, enthalpy change (ΔH) and entropy change in the process of binding between cochinchinenin C and GLP-1 receptor were obtained, namely, ΔH > 0, ΔS > 0. Based on the thermodynamics regular of the acting force between drug and biomacromolecule,25 it was indicated that hydrophobic force was the main factor in the binding between cochinchinenin C and GLP-1 receptor, which is consistent with the results from molecular simulation. Then, the Gibbs free energy of cochinchinenin C–GLP-1 receptor was calculated to be less than 0, which proved that the interaction was spontaneous.
Table 4 Thermodynamic parameters of cochinchinenin C–GLP1 receptor interaction
| Compound |
T (K) |
ΔH (K J−1 mol) |
ΔG (K J−1 mol) |
ΔS (J mol−1 K−1) |
| |
300 |
|
−40.52 |
|
| Cochinchinenin C |
305 |
18.90 |
−41.51 |
198.05 |
| |
310 |
|
−42.50 |
|
3.3 Effect of cochinchinenin C on the conformation of GLP-1 receptor
Synchronous fluorescence is usually used to determine the effects of drugs on the conformation of a target protein.26 The synchronous fluorescence spectra of a protein upon addition of a compound at Δλ = 15 and 60 nm show the spectral characteristics of tyrosine and tryptophan residues, respectively. In this experiment, the synchronous fluorescence spectra of GLP-1 receptor upon addition of cochinchinenin C at Δλ = 15 and 60 nm were obtained at a constant GLP-1 receptor concentration (0.025 mol L−1), while varying the concentration of cochinchinenin C from 0 to 0.045 μmol L−1, as shown in Fig. 5A and B. In synchronous fluorescence spectra of GLP-1 receptor upon the addition of cochinchinenin C at Δλ = 15, the maximum excitation wavelength showed a blue shift accompanied by fluorescence quenching. When Δλ = 60 nm, the maximum excitation wavelength hardly changed and the fluorescence intensity was still quenched. In summary, the degree of fluorescence quenching at Δλ = 60 nm was higher than that at Δλ = 15 nm, and it was also inferred that the fluorescence quenching of tryptophan residues was much greater than that of tyrosine residues. It was revealed that the fluorescence quenching between cochinchinenin C and GLP-1 receptor was mainly caused by the effect of cochinchinenin C on tryptophan residues. When Δλ = 15 nm, the maximum excitation wavelength showed a red shift because the microenvironment of tyrosine residues in the GLP-1 receptor was affected by the addition of cochinchinenin C. Therefore, the results showed that cochinchinenin C affected the conformation of the GLP-1 receptor.
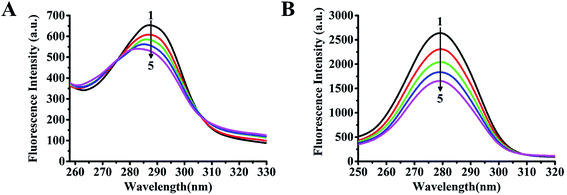 |
| | Fig. 5 Synchronous fluorescence of the interaction between cochinchinenin C and GLP-1 receptor. (A) Δλ = 15 nm; (B) Δλ = 60 nm. | |
3.4 Effect of cochinchinenin C on insulin secretion and cell activity of Ins-1 cells
In this experiment, the effect of cochinchinenin C on insulin secretion was first measured at different glucose concentrations. Glucose-stimulated insulin secretion (GSIS) is an important element on the function of β-cell and for the cure of type 2 diabetes mellitus. As shown in Fig. 6A, cochinchinenin C significantly promoted insulin secretion in medium with 10 and 20 mM glucose. When the glucose concentration was 10 mM in medium, the promotion of insulin secretion in the cochinchinenin C-treatment group reached the highest value (3.79 ± 0.18 IU mL−1), which was about 1.35-fold higher than that in the control group. In contrast, when the glucose concentration was 30 mM in medium, insulin secretion was inhibited in the cochinchinenin C-treatment group. It could be speculated that the function of pancreatic beta cell was affected in such a high glucose concentration. Liu et al. found that geniposide, a potential anti-diabetic drug targeting for GLP-1 receptor, also inhibited insulin secretion at the condition of 33 mM glucose.27 Therefore, it could be obtained that cochinchinenin C enhanced the promotion of insulin secretion in the presence of low or moderately high glucose concentration.
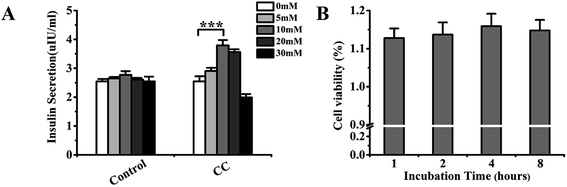 |
| | Fig. 6 Effect of cochinchinenin C on insulin secretion and cell viability of Ins-1 cells. (A) Effect of cochinchinenin C on insulin secretion at the condition of different glucose concentration. (B) The cell viability of Ins-1 cells with the incubation of cochinchinenin C compared with the control group. (n = 5, ***P < 0.005). | |
Cell activity tests are usually applied to estimate cytotoxicity upon treatment with drugs. Cell Counting Kit-8 (CCK-8) enables the sensitive determination of cell viability via cell proliferation and cytotoxicity assays based on the change of mitochondrial dehydrogenase to formazan. Specifically, cell proliferation and cytotoxicity could be determined through the detection of OD at 450 nm. In this experiment, cell viability was measured upon incubation for 1, 2, 4, and 8 h after adding 10−8 M cochinchinenin C to the culture medium (Fig. 6B). The results showed that the survival rate of Ins-1 cells increased with increasing incubation time. Therefore, it was revealed that cochinchinenin C exhibited almost no toxicity to cells and could be used in further experiments.
3.5 Mechanism of the effect of cochinchinenin C on insulin secretion in Ins-1 cells
Intracellular cAMP levels are commonly measured to determine whether extracellular signaling molecules are associated with cell surface receptors.28,29 Patients are judged to be suffering from diabetes mellitus if their blood glucose concentration is greater than or equal to 7 mmol L−1. Hence, 5 and 20 mM glucose levels were used in this experiment. The intracellular cAMP content was determined after incubation of cochinchinenin C for 2 h, so as to estimate whether cochinchinenin C activated the GLP-1 receptor on the cell surface. As shown in Fig. 7A, the content of cAMP increased with increasing glucose concentration upon cochinchinenin C treatment, but lower than the Ex-4 group which is a GLP-1 receptor agonist. Therefore, it could be determined that the level of cAMP increased owing to the combination with GLP-1 receptor, then activated adenylate cyclase and finally caused the increase of intracellular cAMP.
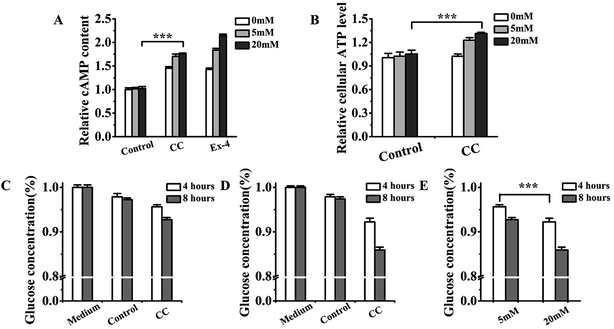 |
| | Fig. 7 Effect of cochinchinenin C on intracellular cAMP content, ATP level, and glucose absorption. (A) The change of intracellular cAMP content with the treatment of cochinchinenin C. (B) The change of intracellular ATP level with the treatment of cochinchinenin C. (C–E) The decrease of glucose concentration in medium was detected with the effect of cochinchinenin C. (C) 5 mM glucose-treated group; (D) 20 mM glucose-treated group; (E) comparison of capacity about glucose absorption in 5 mM glucose-treated group with 20 mM glucose-treated group. (n = 5, ***P < 0.005). | |
In pancreatic beta cells, the level of intracellular ATP plays a critical role in insulin secretion.30 The increase in ATP/ADP ratio leads to the closure of ATP-sensitive K channels (KATP), causes the influx of calcium ions, and ultimately produces insulin secretion. Fig. 7B shows that the intracellular ATP level increased with increasing glucose concentration in the culture medium upon treatment with cochinchinenin C. Comparing the condition of 5 mM glucose with 20 mM glucose, the intracellular ATP level clearly increased with 20 mM glucose. The promotion of insulin secretion was related to the increase of intracellular ATP level. Furthermore, glucose content in cellular supernatant was measured before and after the treatment with cochinchinenin C.
As shown in Fig. 7C–E, upon treatment with cochinchinenin C for 4 and 8 h, glucose in cellular supernatant decreased at the conditions of 5 and 20 mM, respectively, which suggested that cochinchinenin C has the ability to promote glucose absorption. The glucose absorption by Ins-1 cells upon treatment with cochinchinenin C was also compared between the 5 and 20 mM conditions. Cochinchinenin C clearly promoted glucose absorption in the 20 mM condition upon incubation for 4 h. Hence, it could be concluded that elevated intracellular ATP levels were dependent on the constant metabolism of glucose in the medium upon treatment with cochinchinenin C. Because of the activation of GLP-1 receptor, some of the ATP generated by glucose metabolism changed into cAMP.
3.6 Effect of cochinchinenin C on the gene expression related to insulin secretion
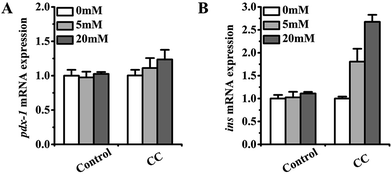
In this experiment, the gene mRNA expression of Ins-1 cells was determined upon incubation with cochinchinenin C. Pdx-1, a transcription factor encoded by the pdx-1 gene, plays an important role in the development and differentiation of pancreatic cells.31,32 It can promote the proliferation of pancreatic beta cells. GLP-1 has been reported to promote Pdx-1 expression in a glucose-dependent manner. Upon treatment with cochinchinenin C, gene mRNA expression related to insulin secretion was measured. As shown in Fig. 8, the gene mRNA expression of pdx-1 and ins increased upon treatment with cochinchinenin C. In addition, the expression of pdx-1 and ins was clearly enhanced by the treatment with cochinchinenin C compared with that in the control group under the condition of a glucose concentration of 20 mM. Therefore, it could be speculated that cochinchinenin C affected the expression of genes related to insulin secretion, thereby promoting such secretion.
 |
| | Fig. 8 Effect of cochinchinenin C on gene mRNA expression. | |
As a class of B G protein-coupled receptor, GLP-1 receptor has an ability to mediate the action of GLP-1, which is useful in diabetes treatment. Cochinchinenin C, extracted from sangusis draconis, might be the potential GLP-1 receptor agonist through molecular docking, spectral experiment and cell experiment. Currently, the development of computer-aided drug design provides us with more convenience to estimate the interaction between drugs with target protein. Hence, the exploration of new drug discovery has become more rapidly than before. Fluorescence spectroscopy, a general method, was commonly applied to estimate the interaction between drug and biomolecule based on the changing of fluorescence. The results from spectrum could verify the interaction between cochinchinenin C and GLP-1 receptor obtained from computational simulation. Besides spectrum and molecular docking, the efficacy and mechanism of cochinchinenin C were also determined. Generally, the treatment of diabetes was dependent on how to control blood sugar. Glucose-stimulated insulin secretion is an important element on the function of β-cell. It is exciting to find that cochinchinenin C have the ability to promote insulin secretion with the increasing of blood sugar and also stop the efficacy at the normal blood sugar. What's more, the increasing of cAMP infers the activation of GLP-1 receptor with the incubation of cochinchinenin C. There were also obtained the results of the increase of ATP level, the absorption of glucose and the enhancement of gene about insulin secretion with the effect of cochinchinenin C. Since cochinchinenin C has the well therapeutic effect, new diabetes drug based on the structure of cochinchinenin C will be developed. The optimization of molecular structure, improvement in water solubility, enhancement of efficacy and reduction of side effects will be the focus for us to expand further researches in the future.
4 Conclusions
In this study, it could be obtained that cochinchinenin C interacted well with GLP-1 receptor agonist based on fluorescence spectrometry and molecular docking. In addition, cell experiments showed that cochinchinenin C activated the GLP-1 receptor and then enhanced intracellular cAMP level. Hence, we proposed that cochinchinenin C might be a potential nonpeptide GLP-1 receptor agonist.
Most of anti-diabetic drugs targeting for GLP-1 receptor were peptide agonists, such as exendin-4, eventide, and liraglutide. Although they have better therapeutic effect, the disadvantages of peptide agonists were that they could be easily degraded by DPP4 and needed to be injected intravenously or subcutaneously which might cause pain for patients. Therefore, the exploration of nonpeptide GLP-1 receptor agonist become popular in research field for anti-diabetic drug. The aim of our study is to determine whether there is an interaction between cochinchinenin C and GLP-1 receptor in vitro. Actually, further experimental works including the interaction between cochinchinenin C and GLP-1 receptor in vivo should be designed. At the moment, the high-throughput screening model for GLP-1 receptor agonist is being established. With deep exploration, it is a hope that nonpeptide GLP-1 receptor agonist will be a more superior anti-diabetic drug choice and bring patients better therapeutic effect.
Conflicts of interest
There are no conflicts to declare.
Acknowledgements
The authors wish to thank Prof. Yonghua Ji from Shanghai University, School of life Sciences for supporting the molecular modeling software (Discovery Studio 4.1). This study was supported by a grant from the National Key Technology Support Program of China (No. 2013BAD12B06) and The National Key research and Development Program of China (No. 2016YFD0501101), and the experimental apparatus were provided by Experimental Center for Life Sciences of Shanghai University.
References
- A. D. Assoc, Diabetes care, 2011, 34, S62–S69 CrossRef PubMed.
- Z. Fu, E. R. Gilbert and D. Liu, Curr. Diabetes Rev., 2013, 9, 25–53 CrossRef PubMed.
- E. Renstrom, S. Barg, F. Thevenod and P. Rorsman, Diabetes, 2002, 51, S33–S36 CrossRef CAS PubMed.
- M. B. Shaghafi, D. G. Barrett, F. S. Willard and L. E. Overman, Bioorg. Med. Chem. Lett., 2014, 24, 1031–1036 CrossRef CAS PubMed.
- J. E. Schopman, A. C. R. Simon, S. J. M. Hoefnagel, J. B. L. Hoekstra, R. J. P. M. Scholten and F. Holleman, Diabetes/Metab. Res. Rev., 2014, 30, 11–22 CrossRef CAS PubMed.
- D. Tornehave, P. Kristensen, J. Romer, L. B. Knudsen and R. S. Heller, J. Histochem. Cytochem., 2008, 56, 841–851 CrossRef CAS PubMed.
- E. C. Tibaduiza, C. Chen and M. Beinborn, J. Biol. Chem., 2001, 276, 37787–37793 CAS.
- J. M. Egan, C. Montrose-Rafizadeh, Y. Wang, M. Bernier and J. Roth, Endocrinology, 1994, 135, 2070–2075 CrossRef CAS PubMed.
- A. A. Tahrani, A. H. Barnett and C. J. Bailey, Nat. Rev. Endocrinol., 2016, 12, 566–592 CrossRef CAS PubMed.
- A. Uccellatore, S. Genovese, I. Dicembrini, E. Mannucci and A. Ceriello, Diabetes Ther., 2015, 6, 239–256 CrossRef CAS PubMed.
- A. R. Meloni, M. B. DeYoung, C. Lowe and D. G. Parkes, Diabetes, Obes. Metab., 2013, 15, 15–27 CrossRef CAS PubMed.
- C. Alarcon, B. Wicksteed and C. J. Rhodes, Diabetologia, 2006, 49, 2920–2929 CrossRef CAS PubMed.
- J. Nagakura, T. Yamakawa, M. Taguri, H. Tsuchiya, E. Shigematsu, J. Suzuki, S. Morita, K. Kadonosono and Y. Terauchi, Endocr. J., 2016, 63, 239–247 CrossRef CAS PubMed.
- C. F. Deacon, M. A. Nauck, M. Toft-Nielsen, L. Pridal, B. Willms and J. J. Holst, Diabetes, 1995, 44, 1126–1131 CrossRef CAS PubMed.
- D. Gupta, B. Bleakley and R. K. Gupta, J. Ethnopharmacol., 2008, 115, 361–380 CrossRef CAS PubMed.
- C. M. Hu, J. S. Li, K. P. Cheah, C. W. Lin, W. Y. Yu, M. L. Chang, G. C. Yeh, S. H. Chen, H. W. Cheng and C. S. Choy, Diabetes Res. Clin. Pract., 2011, 94, 417–425 CrossRef PubMed.
- J. Y. Fan, T. Yi, C. M. Sze-To, L. Zhu, W. L. Peng, Y. Z. Zhang, Z. Z. Zhao and H. B. Chen, Molecules, 2014, 19, 10650–10669 CrossRef PubMed.
- R. Zhang, Tradit. Chin. Drug Res. Clin. Pharmacol., 2002, 13, 3 Search PubMed.
- A. Tropsha and J. Bajorath, J. Med. Chem., 2016, 59, 1 CrossRef CAS PubMed.
- C. H. Reynolds, Curr. Pharm. Des., 2014, 20, 3380–3386 CrossRef CAS PubMed.
- F. Lin and R. X. Wang, J. Mol. Model., 2009, 15, 53–65 CrossRef CAS PubMed.
- B. Niu, M. Zhang, P. Du, L. Jiang, R. Qin, Q. Su, F. Chen, D. Du, Y. Shu and K. C. Chou, OncoTargets Ther., 2017, 8, 57149–57162 Search PubMed.
- X. Chen, K. Qian and Q. Chen, Eur. J. Med. Chem., 2015, 93, 492–500 CrossRef CAS PubMed.
- T. Forster and O. Sinanoglu, Modern Quantum Chemistry, 1996, pp. 93–138 Search PubMed.
- P. D. Ross and S. Subramanian, Biochemistry, 1981, 20, 3096–3102 CrossRef CAS PubMed.
- L. Zhang, B. Liu, Z. Li and Y. Guo, Luminescence, 2015, 30, 686–692 CrossRef CAS PubMed.
- J. H. Liu, L. X. Guo, F. Yin, Y. L. Zhang, Z. X. Liu and Y. W. Wang, PLoS One, 2013, 8(10), e78315 CAS.
- F. Schwede, O. G. Chepurny, M. Kaufholz, D. Bertinetti, C. A. Leech, O. Cabrera, Y. M. Zhu, F. Mei, X. D. Cheng, J. E. M. Fox, P. E. MacDonald, H. G. Genieser, F. W. Herberg and G. G. Holz, Mol. Endocrinol., 2015, 29, 988–1005 CrossRef CAS PubMed.
- E. P. Smith, Z. B. An, C. Wagner, A. G. Lewis, E. B. Cohen, B. L. Li, P. Mahbod, D. Sandoval, D. Perez-Tilve, N. Tamarina, L. H. Philipson, D. A. Stoffers, R. J. Seeley and D. A. D'Alessio, Cell Metab., 2014, 19, 1050–1057 CrossRef CAS PubMed.
- G. W. Cline, R. L. Pongratz, X. J. Zhao and K. K. Papas, Biochem. Biophys. Res. Commun., 2011, 415, 30–35 CrossRef CAS PubMed.
- C. M. McKinnon and K. Docherty, Diabetologia, 2001, 44, 1203–1214 CrossRef CAS PubMed.
- X. L. Wang, C. M. Cahill, M. A. Pineyro, J. Zhou, M. E. Doyle and J. M. Egan, Endocrinology, 1999, 140, 4904–4907 CrossRef CAS PubMed.
|
| This journal is © The Royal Society of Chemistry 2017 |
Click here to see how this site uses Cookies. View our privacy policy here. 
 Open Access Article
 This Open Access Article is licensed under a Creative Commons Attribution-Non Commercial 3.0 Unported Licence
 *
*


