
 Open Access Article
 This Open Access Article is licensed under a
 Creative Commons Attribution 3.0 Unported Licence
Surface tension sensor meshes for rapid alcohol quantification
E. J. Falde,
J. Wang and
M. W. Grinstaff*
and
M. W. Grinstaff*
Departments of Biomedical Engineering, Chemistry, and Medicine, Boston University, Boston, MA 02215, USA. E-mail: mgrin@bu.edu
First published on 25th October 2017
Abstract
A surface tension sensor detects alcohol in solution by determining the transition of a liquid droplet from a non-wetted to a wetted state. Results from testing commercial wines are presented along with the fabrication of electrospun two-layer polymeric sensor arrays, which exhibit controlled wettability.
1 Introduction
Quantification of alcohol by volume (ABV) in alcoholic beverages is required for commercial sales and is also of significant interest for winemakers. Alcohol quantification is traditionally performed using densitometry, though, increasingly, high performance liquid chromatography (HPLC) and Fourier transform infrared spectroscopy (FTIR) are supplanting its use.1,2 However, these instruments are expensive and require trained staff, making rapid and accurate alcohol determination impractical for small-to-medium scale winemakers or for measurements in the cellar from fermentation barrels or tanks.Ethanol contributes the greatest reduction in surface tension of wine,3,4 beer,5,6 and spirits.7,8 In wine, a multivariate analysis found that surface tension alone predicts alcohol content to the same degree as a model incorporating levels of protein, sugar, and tannins.4 Surface tension is the basis of alcohol determination in vinometers, thin tubes in which the capillary rise is measured, but these devices lack accuracy when not extremely clean or when sugars are present.9 More accurate and repeatable surface tension measurements generally require expensive and difficult to use tensiometers. Here we report an alternative method using a simple surface tension sensor composed of an electrospun polymeric mesh on which a droplet of liquid will either remain ‘beaded up’ with a high contact angle or be rapidly absorbed. This difference in wetting state, highlighted by a color change, allows rapid, instrument-free quantification of alcohol content using only small volumes.
2 Materials and methods
2.1 Mesh sensor manufacture and characterization
The poly(glycerol-co-ε-caprolactone) (PGC–OH) and hydrophobic poly(glycerol monostearate-co-ε-caprolactone) (PGC–C18) were synthesized as described by Wolinsky et al.,10 with Mw of 54 and 39 kDa, and dispersities of 1.36 and 1.57, respectively. Electrospinning solutions were dissolved in 5![[thin space (1/6-em)]](https://www.rsc.org/images/entities/char_2009.gif) :1 chloroform:methanol at 150 mg mL−1, and pumped through a 20 ga. blunt needle at 3 mL h−1, while applying 12–20 kV. First the indicator solution of 5% bromocresol purple, 5% PGC–OH and 90% PCL was electrospun for 10 minutes, then the PGC–C18 blend indicated in Table 1 was electrospun for the prescribed time. The aluminium collector is a grounded cylinder that rotates and translates to increase mesh area and uniformity. The meshes were characterized by SEM and contact angle measurements.
:1 chloroform:methanol at 150 mg mL−1, and pumped through a 20 ga. blunt needle at 3 mL h−1, while applying 12–20 kV. First the indicator solution of 5% bromocresol purple, 5% PGC–OH and 90% PCL was electrospun for 10 minutes, then the PGC–C18 blend indicated in Table 1 was electrospun for the prescribed time. The aluminium collector is a grounded cylinder that rotates and translates to increase mesh area and uniformity. The meshes were characterized by SEM and contact angle measurements.
| Mesh | PGC–C18 (%) | Electrospin time (min) | Water adv. CA (°) | 9% Ethanol adv. CA (°) |
|---|---|---|---|---|
| #1 | 3.75 | 6 | 141.9 ± 4 | 131.4 ± 2.4 |
| #2 | 3.0 | 15 | 144 ± 2 | 135.5 ± 4 |
| #3 | 3.75 | 7 | 147 ± 1 | 136 ± 6 |
| #4 | 4.0 | 5 | 147.9 ± 0.4 | 143 ± 4 |
| #5 | 3.75 | 8 | 149 ± 6 | 144 ± 2.6 |
2.2 Experimental setup
A Nikon D3200 SLR camera with a macro lens was set on a tripod with mesh sensors on black cardboard for taking photographs. Using a set timer, pictures were obtained every 15 seconds. Several different commercial wines were used for all studies (Table 2). For the data presented in Fig. 2, ethanol was added to commercial wines to obtain an ABV% of 15.5 and 16%. The yellow, non-wetted sensors are easily distinguished from the orange, wetted sensors.| Vintner | Type/region/grape | Year | ABV (%) |
|---|---|---|---|
| D. Violon | Côtes du Rhône | 2014 | 12.5 |
| Machadinho | Vinho Tinto | 2014 | 13.0 |
| Old Moon | Zinfandel | 2013 | 13.5 |
| Casillero del Diablo | Cabernet Sauvignon | 2014 | 13.5 |
| Pagos de Tahola | Rioja | 2007 | 14.0 |
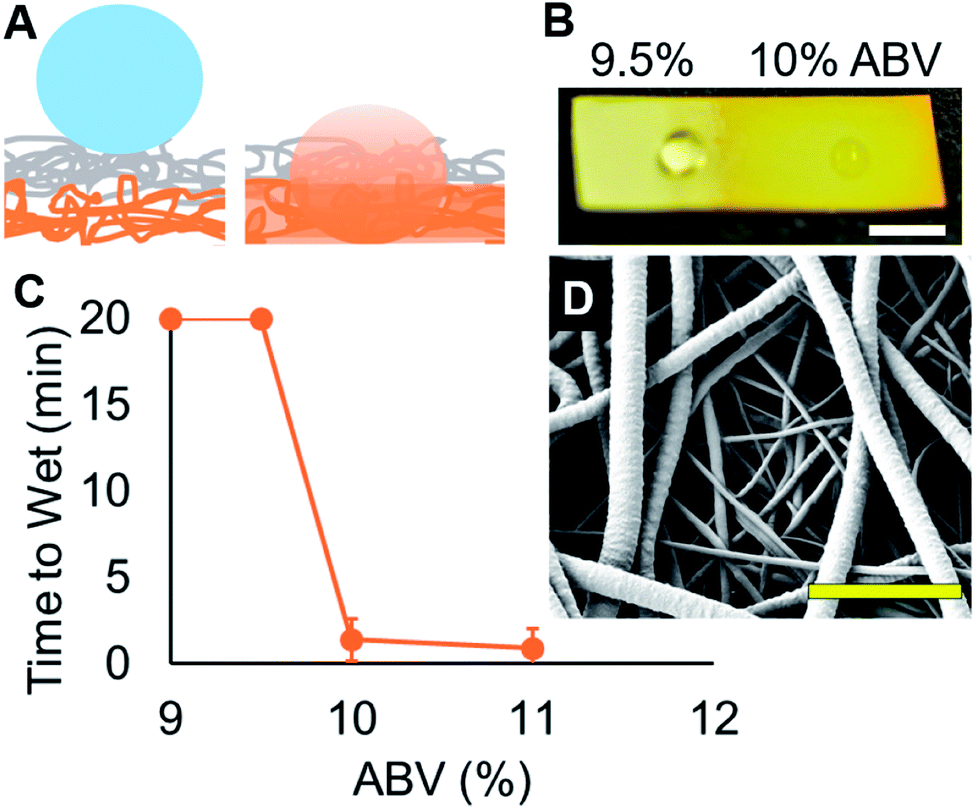 | ||
| Fig. 1 (A) Profile of alcohol sensor with upper ‘responsive’ layer that allows wetting at a specific surface tension and lower ‘indicator’ layer that facilitates wetting and provides a color change (light orange). (B) Discrimination between a 9.5% (left) and 10% (right) ethanol water solution on Mesh #1 (scale bar = 3 mm) with 5 μL droplets. (C) The wetting response of sensor Mesh #1 can resolve a 0.5% ABV difference in ethanol water solutions. Wetting time was capped at 20 minutes, error bars represent ± SD, n = 3. (D) SEM image of a representative sensor mesh structure (scale bar = 15 μm). | ||
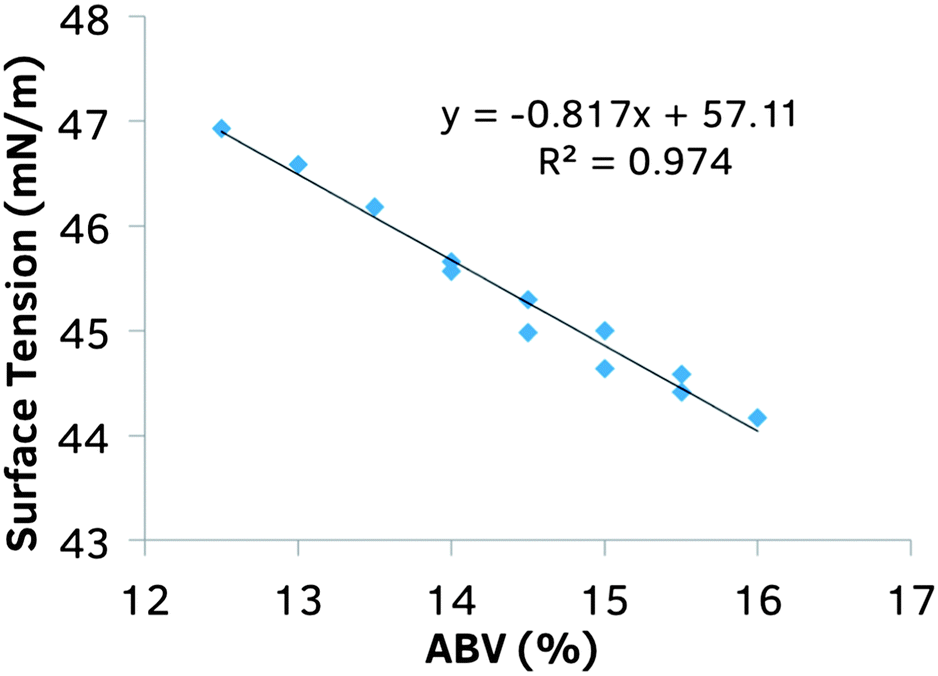 | ||
| Fig. 2 The relationship between surface tension and alcohol content (ABV%) for commercial wines. | ||
3 Results and discussion
These sensors function by exploiting the transition in wetting states of liquids near the critical surface tension on porous material. Contact angle is a function of surface hydrophobicity and air–liquid surface tension. Rough surfaces such as electrospun meshes exhibit exaggerated apparent contact angles when fully wetted or when partially wetted, as described by the Wenzel and Cassie–Baxter states, respectively.11 The partially wetted state accounts for the remarkable properties of superhydrophobic materials, which have been the subject of much research recently.12–21 The transition between these two wetting states occurs at a specific surface tension and triggers a large change in apparent contact angle, and is the basis for the mechanism of our sensors. The alcohol sensors (Fig. 1A) are composed of (A) an upper ‘responsive’ layer that allows wetting of liquids only below a specific surface tension, and (B) a hydrophilic lower ‘indicator’ layer that wets completely and provides a color change from the dissolution of the incorporated dye, bromocresol purple. This color change is indicative of the Cassie–Baxter (non-wetted) to Wenzel (wetted) states. An array of these sensors with responsive layers tuned to different critical surface energies allows the quantification of the liquid surface tension, and hence, the alcohol content. Wine alcohol content is strongly correlated with surface tension, as shown in Fig. 2, and as previously reported.4The sensor meshes were composed of the biocompatible and biodegradable polymers: poly(ε-caprolactone) (PCL) (70–90 kDa), doped with varying amounts of hydrophilic PGC–OH or hydrophobic PGC–C18. The bottom indicator layer (Fig. 1A, orange) facilitates wetting as all contact angles were <90° with ethanol water solutions containing greater than 9% ABV. The polymer solutions for preparing the responsive layers (Fig. 1A, grey) were between 3 and 5% PGC–C18 dissolved at 150 mg mL−1, and were electrospun at the same time as the indicator layer for the first 30 seconds (to prevent delamination), then for varying times afterwards, between 5 and 15 minutes. Five different meshes with varying hydrophobicity were fabricated to span the relevant range. The detailed electrospinning parameters, and contact angles (both with water and 9% ethanol) are listed in Table 1. As geometry (mesh thickness, fiber diameters, porosity) and material hydrophobicity both influence surface energy, water and ethanol apparent contact angles were both measured for Meshes #1–5 to resolve differences in surface tension. Meshes that exhibit higher contact angles (and therefore have lower critical surface tensions) are designed to detect higher alcohol contents.
Surface tensions of the test wines were measured in quintuplicate by the Wilhelmy plate method on a Kruss K11 tensiometer using flame-cleaned glass cover slips. Contact angles were recorded on video by a Kruss DSA100 goniometer using Laplace-Young fitting and all droplets are 3 μL at 21–23 °C. Model wines were commercial wines with labeled alcohol by volume (ABV) of 12.5–14.0%. Details on the wine types can be found in Table 2. Three μL droplets were added to meshes, and photographed every 15 seconds using manual settings. The time-to-wet is defined as the time after droplet addition to <90° apparent contact angle and orange color change, as shown in Fig. 1, 3 and 4.
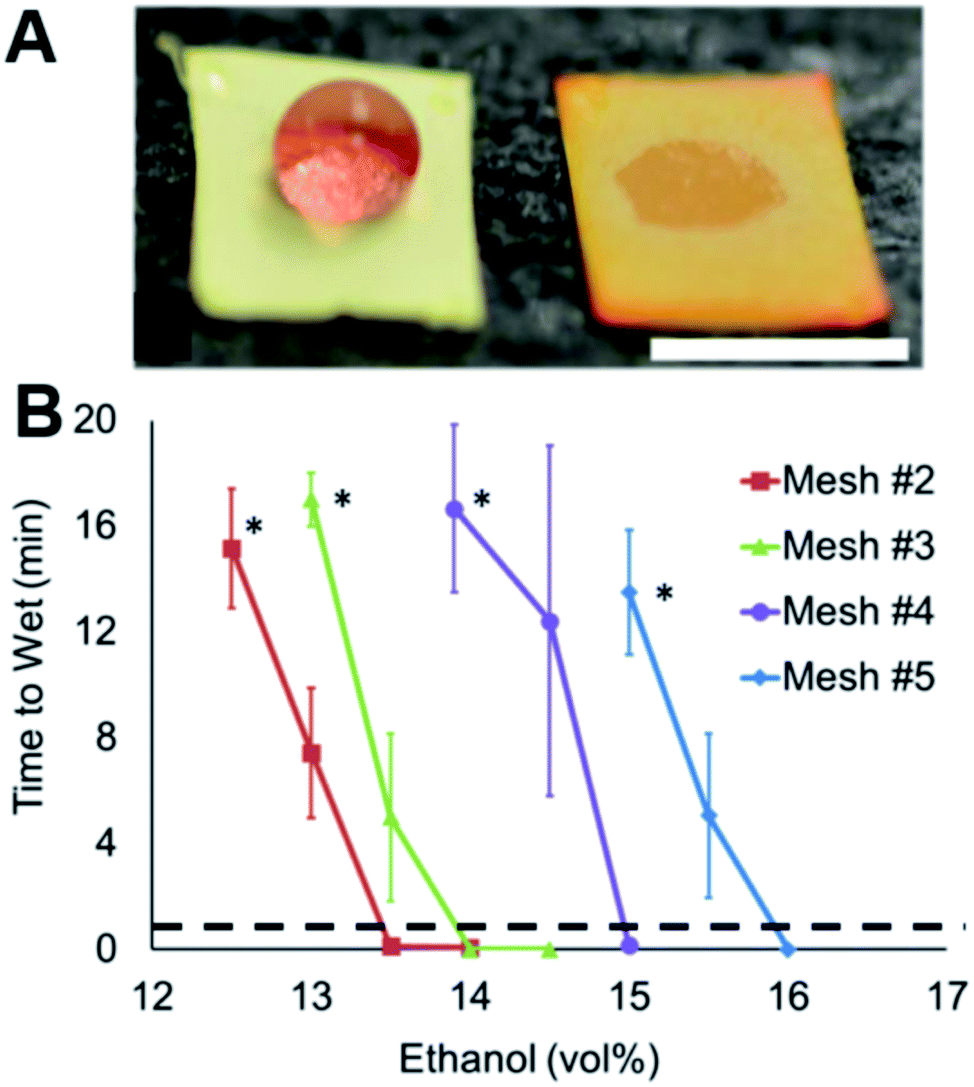 | ||
| Fig. 3 (A) Discrimination of commercial wines at 13.5 and 14.0% alcohol on Mesh #3 (scale bar = 3 mm). (B) The wetting response of four sensor meshes to alcohol content, each sensor resolving 1% ABV, n ≥ 3, error bars denote ± SEM. The dashed line represents 30 seconds, the time at which the wetted/non-wetted response was observed. The (*) denotes a difference from zero, p < 0.005. | ||
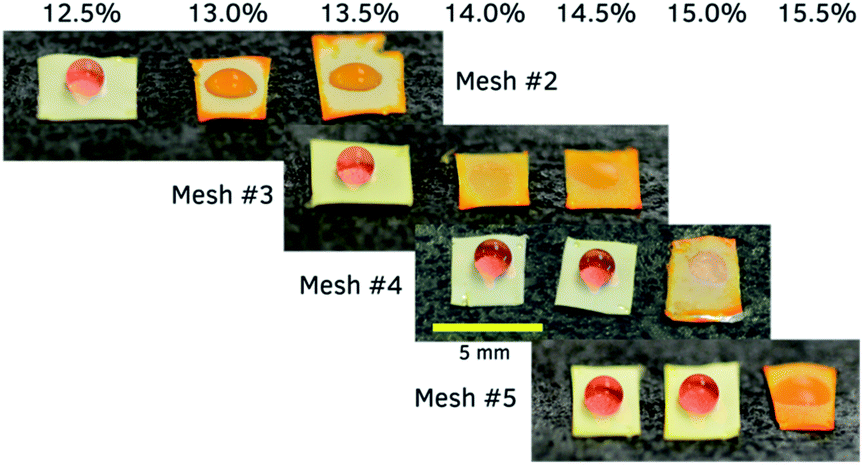 | ||
| Fig. 4 Alcohol sensors resolve 0.5% ABV differences in commercial wines. Droplets of 3 μL were added to each sensor. Photographs of the sensors are one minute after droplet addition. The non-wetting droplets remained for >5 min. | ||
As demonstrated in Fig. 1B, a clear change in wetting state is observed between 9.5% ABV and 10% ABV ethanol water solutions and further highlighted by a slight color change on Mesh #1. Fig. 1C shows the results from using the mesh to resolve the difference between a metastable non-wetting Cassie–Baxter state to a rapidly wetting Wenzel state with only a 0.5% change in the alcohol content. The structure of a representative sensor mesh is shown in Fig. 1D. The top responsive layer is of controlled thickness and composed of 2–3 micrometer diameter fibers with a specific hydrophobic PGC–C18 content, while the bottom indicator layer is composed of hydrophilic nanofibers with PGC–OH and bromocresol purple dye. If droplets from an unknown sample are placed on an array of sensors (with varying amounts of the hydrophobic PGC–C18 in the top responsive layer) that wet at different surface tensions, the alcohol content in the sample is determined, as discussed below.
Four meshes of varying construction are wetted by wines of different alcohol contents, as shown in Fig. 3. Mesh #3 resolves a 0.5% alcohol difference in a wine (Fig. 3A). The combination of the three other meshes (Fig. 3B) allows determination of alcohol content to <1% ABV between 12.5 and 15.5% ABV. The robustness of the system is demonstrated with non-wetted droplets remaining non-wetted for up to 16 minutes, allowing greater discrimination between wetted and non-wetted states while an accurate response can be discerned as quickly as 30 seconds. This specific senor array can not detect ABV below or above 12.5 and 15.5%, respectively. The alcohol contents shown here assume the commercially reported values are precise.
Example photos of this visible change in wetting states on the alcohol sensor meshes are shown in Fig. 4. Sensor meshes with increasing hydrophobicity are wetted by wines of increasing alcohol contents, at which point the wine dissolves the bromocresol purple dye in the lower layer and turns the sensor orange. In every case the wetting occurred within 30 seconds, and the non-wetting droplets remained for at least 5 minutes. This time difference is sufficient to be discerned without a timer, and the color change allows detection of wetting by a naked eye. Collectively using four of these sensors enables determination of alcohol content in an unknown wine sample with a droplet of wine added to each sensor and observing the color change after 30 seconds. Thus, an experimenter, blinded to wine type and alcohol content, used the sensor array to determine the ABV of the unknown wine. The sensor array correctly determined the wine as having an ABV between 14.0 and 15.0%. The wine was revealed to be Carol Shelton Old Vine Monga Zin 2014, 14.5% ABV.
A thorough study of the effects of responsive layer thickness, fiber diameter, polymer blend, humidity and temperature on wetting rates is ongoing to further elucidate the subtle changes that give rise to the resulting mesh performances. For example, a 14.0% ABV ethanol solution in water decreases by ∼0.4 mN m−1 for every 3 °C increase, equivalent to ∼0.5% ABV,7 so temperature must be accounted for or controlled in the final device. Additionally, proper handling is required as scratches to the surface or contamination will affect the performance. Electrospinning is a well-controlled, robust commercialized manufacturing process and as such supports the use of this fabrication method. We recently reported a point-of-care diagnostic sensor based on surface tension for fat determination in breast milk with a set of polymeric meshes with different surface properties,22 and together all of these results document the generality of our approach. Our results also suggest that materials with high porosity and well-controlled geometry may exhibit similar sensitivity, and therefore, encourages the investigation of additional fabrication methods to prepare new surface tension sensors for analysis of varied aqueous and non-aqueous solutions. Finally, this sensor design based on observing the wetting phenomena complements other visible (e.g., colorimetric) detection systems, from the common pregnancy test to sophisticated devices for analyte identification using chemical compound arrays via molecular fingerprinting.23–30
4 Conclusions
In wine, the phenolics and terpenes along with the sugars and acids define the character of the wine and the resulting nuances of flavors. The alcohol content in wine also influences the sensory profile of the wine – with flavor intensities and balance being greatest at specific alcohol percentages.31 Accurate determination of alcohol content is essential for winemakers to maximize flavors and comply with labeling requirements. However, the current methods for measuring alcohol content require trained personnel or expensive equipment and are not amenable for easy use in the field, i.e., point-of-cask analogous to point-of-care32–35 for medical diagnostics. The strong correlation between alcohol content and surface tension enables facile and rapid quantification of alcohol using an array of polymeric mesh sensors with controlled wettability.Conflicts of interest
There are no conflicts to declare.Acknowledgements
This work was supported in part by the National Science Foundation (DMR-1410450), Graduate Research Fellowship GRF DGE-1247312 (JW), and National Institutes of Health T32 EB006359 (MWG, JW). NMR facilities at Boston University are supported by the NSF (CHE-0619339). MWG purchased all alcohol containing solutions, and ensured of their proper disposal at the completion of the experiments.References
- R. Bauer, H. Nieuwoudt, F. F. Bauer, J. Kossmann, K. R. Koch and K. H. Esbensen, Anal. Chem., 2008, 80, 1371–1379 CrossRef CAS PubMed.
- M. Friedel, C.-D. Patz and H. Dietrich, Food Chem., 2013, 141, 4200–4207 CrossRef CAS PubMed.
- A. Dussaud, G. B. Han, L. T. Minnassian-Saraga and M. Vignes-Adler, J. Colloid Interface Sci., 1994, 167, 247–255 CrossRef CAS.
- P. Glampedaki, E. Hatzidimitriou, A. Paraskevopoulou and S. Pegiadou-Koemtzopoulou, J. Food Compos. Anal., 2010, 23, 373–381 CrossRef CAS.
- D. M. Lynch and C. W. Bamforth, J. Food Sci., 2002, 67, 2696 CrossRef CAS.
- C. W. Bamforth, J. Inst. Brew., 2004, 110, 259 CrossRef CAS.
- G. Vazquez, E. Alvarez and J. M. Navaza, J. Chem. Eng. Data, 1995, 40, 611–614 CrossRef CAS.
- N. D. McMillan, V. Lawlor, J. Nolan, W. Y. Lo, R. Harnedy and M. ONeill, Colloids Surf., A, 1998, 143, 421–427 CrossRef CAS.
- P. Jackisch, Journal, 1985, 260 Search PubMed.
- J. B. Wolinsky, W. C. I. Ray, Y. L. Colson and M. W. Grinstaff, Macromolecules, 2007, 40, 7065–7068 CrossRef CAS.
- J. Bico, U. Thiele and D. Quéré, Colloids Surf., A, 2002, 206, 41–46 CrossRef CAS.
- E. J. Falde, S. T. Yohe, Y. L. Colson and M. W. Grinstaff, Biomaterials, 2016, 104, 87–103 CrossRef CAS PubMed.
- Y. Wang and X. Gong, J. Mater. Chem. A, 2017, 5, 3759–3773 CAS.
- Q. Wen and Z. Guo, Chem. Lett., 2016, 45, 1134–1149 CrossRef CAS.
- B. Su, Y. Tian and L. Jiang, J. Am. Chem. Soc., 2016, 138, 1727–1748 CrossRef CAS PubMed.
- S. Wang, K. Liu, X. Yao and L. Jiang, Chem. Rev., 2015, 115, 8230–8293 CrossRef CAS PubMed.
- J. T. Simpson, S. R. Hunter and T. Aytug, Rep. Prog. Phys., 2015, 78, 086501 CrossRef PubMed.
- X. Feng and L. Jiang, Adv. Mater., 2006, 18, 3063–3078 CrossRef CAS.
- X.-M. Li, D. Reinhoudt and M. Crego-Calama, Chem. Soc. Rev., 2007, 36, 1350–1368 RSC.
- H. Bellanger, T. Darmanin, D. Givenchy, E. Taffin and F. Guittard, Chem. Rev., 2014, 114, 2694–2716 CrossRef CAS PubMed.
- S. Movafaghi, W. Wang, A. Metzger, D. D. Williams, J. D. Williams and A. K. Kota, Lab Chip, 2016, 16, 3204–3209 RSC.
- E. J. Falde, S. T. Yohe and M. W. Grinstaff, Adv. Healthcare Mater., 2015, 4, 1654–1657 CrossRef CAS PubMed.
- J. R. Askim, M. Mahmoudi and K. S. Suslick, Chem. Soc. Rev., 2013, 42, 8649–8682 RSC.
- S. M. Borisov and O. S. Wolfbeis, Chem. Rev., 2008, 108, 423–446 CrossRef CAS PubMed.
- K. C. Persaud, Mater. Today, 2005, 8, 38–44 CrossRef CAS.
- S. E. Stitzel, M. J. Aernecke and D. R. Walt, Annu. Rev. Biomed. Eng., 2011, 13, 1–25 CrossRef CAS PubMed.
- V. Piriya, P. Joseph, S. Daniel, S. Lakshmanan, T. Kinoshita and S. Muthusamy, Mater. Sci. Eng., C, 2017, 78, 1231–1245 CrossRef PubMed.
- W. Guan, W. Zhou, J. Lu and C. Lu, Chem. Soc. Rev., 2015, 44, 6981–7009 RSC.
- Z. Hu, B. Deibert and J. Li, Chem. Soc. Rev., 2014, 43, 5815–5840 RSC.
- A. W. Martinez, S. T. Phillips, M. J. Butte and G. M. Whitesides, Angew. Chem., Int. Ed., 2007, 46, 1318–1320 CrossRef CAS PubMed.
- E. S. King, R. L. Dunn and H. Heymann, Food Quality and Preference, 2013, 28, 235–243 CrossRef.
- V. Gubala, L. F. Harris, A. J. Ricco, M. X. Tan and D. E. Williams, Anal. Chem., 2012, 84, 487–515 CrossRef CAS PubMed.
- A. K. Yetisen, M. S. Akram and C. R. Lowe, Lab Chip, 2013, 13, 2210–2251 RSC.
- F. B. Myers and L. P. Lee, Lab Chip, 2008, 8, 2015–2031 RSC.
- J. Hu, S. Wang, L. Wang, F. Li, B. Pingguan-Murphy, T. J. Lu, F. Xu and M. M. Abbott, Biosens. Bioelectron., 2014, 54, 585–597 CrossRef CAS PubMed.
| This journal is © The Royal Society of Chemistry 2017 |