 Open Access Article
Creative Commons Attribution 3.0 Unported Licence
Schottky defects induced effects on the behaviors of high velocity shock compression of MgO
Chuanguo Zhang ad,
Xianlong Wangab,
Jie Zhangab,
Kaishuai Yangab,
Ya Chengab,
Zhi Zeng*abd,
Xianming Zhouc and
Haiqing Lind
aKey Laboratory of Materials Physics, Institute of Solid State Physics, Chinese Academy of Sciences, Hefei 230031, China. E-mail: zzeng@theory.issp.ac.cn; Fax: +86-0551-65591434; Tel: +86-0551-65591407
bUniversity of Science and Technology of China, Hefei 230026, China
cInstitute of Fluid Physics, National Key Laboratory of Shock Wave and Detonation Physics, Mianyang 621900, China
dBeijing Computational Science Research Center, Beijing 100084, China
First published on 22nd September 2017
Abstract
Molecular dynamics (MD) simulation was performed on high velocity plane shock compression of sodium chloride MgO along [100] lattice direction using a long-range coulombic potential. It was found that the shock compressions of MgO revealed three distinct regions depending on piston velocities, i.e., single elastic shock wave, two-wave structure consisting of an elastic wave followed by a plastic deformation wave, and single plastic deformation shock wave. The critical pressure of 120 GPa was obtained for the transition from elastic to plastic deformation under the high strain rate of 1010 s−1. For getting a better understanding the experimental results, we also investigated the effects of Schottky defects in MgO single crystal on the Hugoniot Elastic Limit (HEL), the velocity of shock wave and the critical piston velocity (CPV) resulting in plastic deformation. Our results demonstrated that the HEL decreases from 120 GPa to 100 GPa, and the CPV decreases a little from 2.8 km s−1 to 2.2 km s−1. Significantly, a double yielding phenomenon occurs for shock wave propagating in MgO sample with Schottky defects, i.e., homogeneous nucleation of dislocations accompanied by vacancy emission of dislocations, which has never been reported before. This work helps to clarify the contradictory results of HEL of MgO in the literature and to understand the plastic deformation mechanism of MgO.
1 Introduction
Magnesium oxide (MgO) is an abundant mineral in the Earth's lower mantle,1 therefore, its high-temperature and high-pressure properties are critical for understanding the Earth's interiors sufficiently. Furthermore, MgO is also widely used as pressure scale in static compression experiments2–4 due to its high stability at extreme conditions, high-temperature and high-pressure. Thus, it is required to obtain an accurate description of the equation of state (EOS) of MgO. To discuss the EOS of MgO from the Hugoniot data, it is necessary to clarify the effect of shear strength of material which usually can be discussed based on its Hugoniot Elastic Limit (HEL) during shock. However, to date, the HEL of MgO along crystallographic [100] direction is still in contradiction in the literatures.5–8 The reason for the experimentally reported controvertial MgO HELs are still unknown. Both strain rate and defects of MgO may affect the measured HELs.Plane shock loading on MgO experimentally showed the splitting of shock waves,7 i.e., an elastic wave followed by a plastic deformation wave. Within the pressure of 1.4 terapascals (TPa), two phase transitions were observed by shock compression experiments:9 MgO firstly transfers from sodium chloride to cesium chloride crystal at 0.36 TPa while a metallic liquid phase appears under the pressure higher than 0.60 TPa. Despite great importance in technology and nature of MgO, many open questions remain, mostly related to the underlying atomistic processes, such as plastic deformation mechanism. It is a challenging subject to experimentally explore the microscopic information including plastic deformation mechanisms during shock loading process. Computer material simulations are particularly useful and powerful for problems that may be inaccessible to direct experimental studies, such as extreme of pressure. MD simulations and density functional theory (DFT) were widely used to clarify the MgO properties, such as melting mechanism,10–12 equation of state of MgO13 and phase diagram.14 Within our best knowledge, up to now, there is no MD simulation about the MgO shock compression due to its complicate behaviors. Moreover, despite that defects have significant effects on dynamic materials properties and processes,15–18 including high strain rate loading, studies along this line on MgO are rare. On the one hand, high level concentration of vacancies will form in materials serviced under extreme environment due to the irradiation of neutrons or high-energy particles.19 On the other hand, the effects of defects in materials are normally entangled and it is desirable to separate their individual contributions in a research. In this work, using MD simulations, we illustrate the simplest individual case, the effects of Schottky defects on the shock response of MgO single crystal. Understanding the mechanical deformation of MgO with Schottky defects should help in the design of materials with improved mechanical properties.
There are several literatures focusing on a single void collapse16,17,20–24 or a collection of voids interaction25 in both face-centered cubic (fcc) or body-centered cubic (bcc) metals at high strain rates. Dislocations induced by loading are emitted from void surfaces as shear loops, with their interactions leading to hardening.24 The individual void serves as dislocation sources, whose efficiency is further enhanced by their collective interaction eventually leading to very high dislocation densities.25 This work focuses on dislocation activity and the resulting stress relaxation in MgO single crystal sample with Schottky defects, which has not been discussed in depth.15 We have studied the effects of Schottky defects on the elastic–plastic transition of MgO single crystal under high strain rate shock compression by large scale MD simulations, in order to elucidate the influence of Schottky defects on the shock wave propagation and the deformation mechanism of MgO. Our results indicate that Schottky defects in MgO single crystal can affect the HEL, and a double yielding phenomenon occurs for shock wave propagating in MgO sample with Schottky defects. This work clarify the contradictory results of MgO HEL in the literature and present the plastic deformation mechanism of MgO.
2 Methodology of the simulations
The dynamics of shock wave propagation along [100] lattice direction in MgO single crystal at 1000 K are investigated with large-scale non-equilibrium MD simulations performed with software package LAMMPS.26 The simulated specimens are about 84.336 nm, 16.952 nm and 16.952 nm along the Cartesian x-, y-, and z-axes containing 2![[thin space (1/6-em)]](https://www.rsc.org/images/entities/char_2009.gif) 547
547![[thin space (1/6-em)]](https://www.rsc.org/images/entities/char_2009.gif) 200 atoms. A small slab model (63.146 nm × 16.952 nm × 16.952 nm, containing 1
200 atoms. A small slab model (63.146 nm × 16.952 nm × 16.952 nm, containing 1![[thin space (1/6-em)]](https://www.rsc.org/images/entities/char_2009.gif) 907
907![[thin space (1/6-em)]](https://www.rsc.org/images/entities/char_2009.gif) 200 atoms) is also created to eliminate the size effects. All simulations are performed with periodic boundary conditions in x, y and z directions, and a vacuum layer of 4.662 nm is created along shock direction. Plane shocks are simulated along x-axis with [100] lattice direction. The plane shock waves are produced by slamming a piston with a certain velocity, i.e., the piston velocity (Up), and propagate with velocity Us in MgO material. The piston velocity Up is equal to the particle velocity (up) behind the shock wave. Velocity profiles are analyzed to obtain Us. The relationship between Up and Us is represented in the Hugoniot curve. The shock profiles which include particle velocity, stresses, mass density and atomic displacement in the yz plane are calculated along the system in the x direction.
200 atoms) is also created to eliminate the size effects. All simulations are performed with periodic boundary conditions in x, y and z directions, and a vacuum layer of 4.662 nm is created along shock direction. Plane shocks are simulated along x-axis with [100] lattice direction. The plane shock waves are produced by slamming a piston with a certain velocity, i.e., the piston velocity (Up), and propagate with velocity Us in MgO material. The piston velocity Up is equal to the particle velocity (up) behind the shock wave. Velocity profiles are analyzed to obtain Us. The relationship between Up and Us is represented in the Hugoniot curve. The shock profiles which include particle velocity, stresses, mass density and atomic displacement in the yz plane are calculated along the system in the x direction.
Identification of defects is done using the centrosymmetry parameter27 and the dislocation extraction algorithm (DXA).28 The latter enables one to identify line and surface defects and to measure dislocation densities. Visualization and analysis of atomistic simulation data are performed using OVITO.29 The prerequisite condition for the success of MD simulation is the availability of reliable interatomic potentials describing the interaction between atoms in the crystalline lattice. The empirical potential form30 is applied according to the work of Lewis and Catlow, as shown in the following expression:
 | (1) |
| A (eV) | ρ (nm) | C (eV nm6) | |
|---|---|---|---|
| Mg–Mg | 0.0 | 0.1000 | 0.0 |
| Mg–O | 821.6 | 0.03242 | 0.0 |
| O–O | 22![[thin space (1/6-em)]](https://www.rsc.org/images/entities/char_2009.gif) 764.4 764.4 |
0.01490 | 2.037 × 10⁻⁵ |
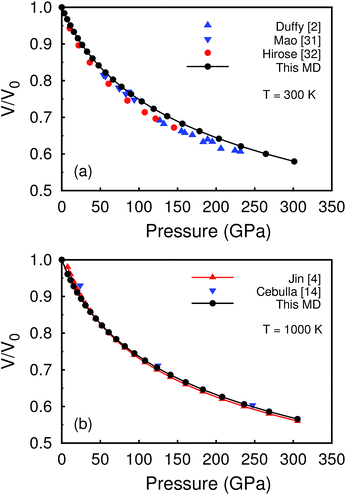 | ||
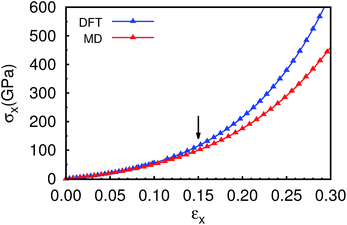
| Fig. 2 The P–V EOS of MgO calculated via MD method compared to the results of experiments and other computational models at (a) 300 K and (b) 1000 K, respectively. | ||
3 Results and discussion
3.1 Hugoniot Us − Up curve
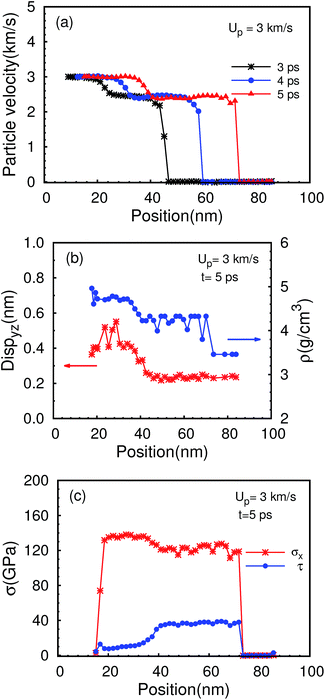
For particle velocity distribution as shown in Fig. 3(a), two wave structures are identified, i.e., an elastic wave is followed by a plastic wave, which has well reproduced the experimental detected phenomenon,7 where they also found two-wave structure along [100] crystallographic shock compression. The average displacement of atoms perpendicular to the impact direction is a useful quantity to distinguish elastic wave from plastic wave. In Fig. 3(b), the displacement in the yz plane increases distinctly along the impact direction. The distribution of mass density also reflects the differences among undisturbed area, elastic area and the plastic deformation area. As shown in Fig. 3(b) blue points, the mass density is about 3.46 g cm−3 ahead the shock front, which is the mass density of MgO in ordinary state at 1000 K, while it increases to 4.4 g cm−3 and 4.7 g cm−3 in the elastic area and plastic area, respectively. It is also noted from Fig. 3(c) that the maximum shear stress (τ) in the plastic deformation region releases to a value of 10 GPa via dislocation nucleation and slipping of {110} [110] system, and the profile of the longitude stress (σx) also exhibits clearly three areas, i.e., the undisturbed area, the elastic area and the plastic area.The shock front velocity Us is defined by following the drop in the particle velocity profile as shown in Fig. 3(a). Fig. 4 exhibits the Hugoniot Us − Up relationship of the pristine MgO single crystal and the MgO single crystal with 0.1% Schottky defects along [100] crystallographic shock orientation. In this section, we only discuss the Hugoniot Us − Up relationship of the pristine MgO single crystal, and leave the discussion on the Schottky defects to the next section. Note that Up and Us refer the piston velocity and the velocity of shock waves, respectively. We find that the shock compressions of MgO show three distinct regions depending on Up. At the beginning, when the piston owns a velocity below 2.8 km s−1, it only generates elastic deformation as indicated by the left red arrow in Fig. 4. Start from 2.8 km s−1 until 7.0 km s−1, a well-defined two-wave structure generates, consisting of an elastic wave followed by a plastic deformation wave. Then when the piston velocity goes above 7.0 km s−1, as indicated by the right red arrow in Fig. 4, the plastic deformation shock wave overdrives the single elastic shock wave. Usually, the formula, Us = C0 + λup, describes the relationship between velocities of shock waves and particle velocities behind the shock front within limits. Here C0 represents the velocity of elastic longitudinal wave, up represents the particle velocity which is the same as the piston velocity (Up), λ is a constant. Consequently, we get the velocity of longitudinal elastic wave C0 (8.65 km s−1) and the constant λ (2.094) by fitting the data of Us and Up in the region of single elastic shock wave following this linear function. We should be aware of that C0 is consistent with sound velocity (9.12 km s−1) calculated from the elastic constant of MgO.34 For the region of two-wave structure, it is interesting that the velocity of elastic wave increases slightly with increase of the piston velocity. Two obvious characteristics are obtained from Fig. 4 by comparing the Hugoniot Us − Up relationship of the pristine MgO single crystal and the experimental results. First, the velocity of the plastic wave is much lower than that of the experimental results for the case of lower piston velocities in particular, whereas the difference will gradually decrease to about 1.0 km s−1 with increase of piston velocity. Second, the pristine MgO sample has a much higher value of the CPV compared to that of the experimental results, i.e., 2.8 km s−1 indicated by the left red arrow relative to 0.6–0.8 km s−1 indicated by the back arrow. Possible reasons for these differences are the strain rate of compression and the effects of defects in MgO materials.
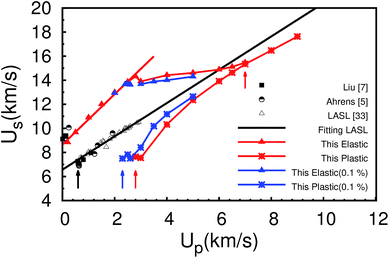 | ||
| Fig. 4 The Hugoniot curve of MgO single crystal along [100] crystallographic shock orientation obtained by MD simulations at 1000 K, compared to experimental data Liu,7 Ahrens5 and LASL,33 which were measured by the methods of velocity interferometer system for any reflector (VISAR), inclined-mirror and flash-gap, respectively. Red triangle points and red star points represent elastic shock wave and plastic deformation shock wave in the pristine MgO single crystal in our work; blue triangle points and blue star points represent elastic shock wave and plastic deformation shock wave in MgO single crystal with 0.1% Schottky defects. The right red arrow represents the piston velocity with which plastic wave velocity exceeds elastic wave velocity. The black arrow, the left red arrow and the blue arrow represent the critical piston velocity (CPV) resulting in plastic deformation for the experimental results5 and our MD simulations of the pristine MgO single crystal and the MgO single crystal with 0.1% Schottky defects, respectively. | ||
3.2 Hugoniot elastic limit of MgO under [100] shock compression
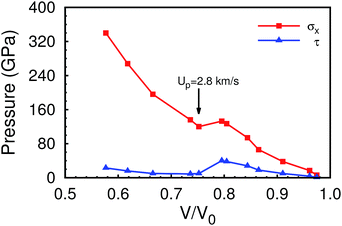
For clarifying the critical pressure of elastic and plastic deformation, the shock Hugoniot P–V curve is presented in Fig. 5. We can find that an inflection point exists at the V/V0 = 0.75 corresponding to normal pressure of 120 GPa and the piston velocity of 2.8 km s−1. The maximum shear stress (τ) decreases to near zero at the inflection point due to the plastic deformation, which indicates that the HEL of MgO is 120 GPa. While Liu et al. reported that the HEL of MgO under [100] shock direction were 4.3, 4.1, and 2.9 GPa at final stresses of 16.3, 22.0, and 31.7 GPa, respectively.7 It is acceptable that the HEL of MgO is as high as 120 GPa under specific conditions. Sarva et al. used a modified split Hopkinson bar to perform the high strain rate tests in silicon carbide (SiC).35 Their results showed that the strain rate sensitivity of the compressive strength of SiC material was very strong. A marked increase is observed in the compressive strength at strain rates greater than 100 s−1. We evaluated the strain rate of our MD compression simulations, which is up to 1010 s−1, whereas the strain rate is only 106 s−1 from the shock compression results of experimental group using bore-keyed powder gun method. Hence, it may be acceptable that the HEL is as high as 120 GPa under the high strain rate of 1010 s−1. We note that a difference exists in the HEL of MgO measured by different experimental groups.5–8 This difference is likely due to the strain rate on the MgO samples during compression.3.3 The Hugoniot Us − Up relationship and the HEL changing due to Schottky defects
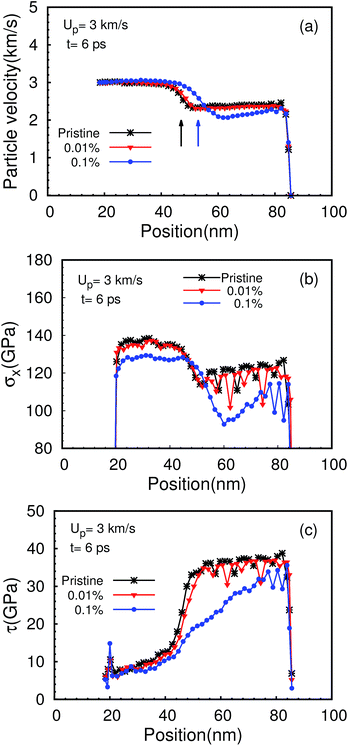
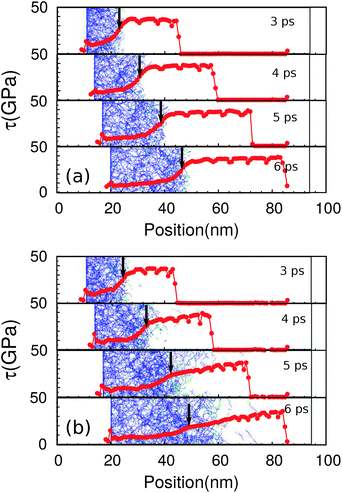
As mentioned above, one of the reasons to bring the discrepancy between experimental and simulated results might be from defects induced effects. We then focus on the effects of Schottky defects on the Hugoniot Us − Up relationship and the HEL of MgO. When considering the effects of preexisting voids on dislocation nucleation in shocked fcc solids, Hatano found that the HEL drastically decreases to 15% of the perfect crystal when the void radius is 3.4 nm.36 One question is arising that how about the effects of Schottky defects in MgO on the Hugoniot Us − Up relationship and the HEL. Normally the “equilibrium” Schottky defects concentration in MgO single crystal is very low at 1000 K and its effect is expected to be negligible. However, high vacancy concentration up to 1% can be metastably preserved via proper processing, e.g., thin film growth37 and ion irradiation.38 Furthermore, by studying the effects of Schottky defects, we can deduce which effects, the strain rate or the Schottky defects, play a dominant role in changing of the Us − Up relationship and the HEL of MgO. High vacancy concentration may facilitate considerably heterogeneous nucleation of plasticity and voids spall damage even within MD time and size scales. Hence we introduce Schottky defects of only 0.01% and 0.1% atomic concentration in the MgO single crystal to investigate the effects of defects. Fig. 6 shows the distribution of the particle velocity, the normal stress and the maximum shear stress of MgO single crystal without and with Schottky defects. Comparing the MgO impaction simulations, it presents the following characteristics. First, the velocity of plastic wave increases as indicated by the positions of those shock wave front in Fig. 6(a). Second, the stress strength of the shock wave decreases compared to that of the pristine MgO single crystal in Fig. 6(b). According to Minshall,39 the “normal pressure” of the elastic precursor is defined as the HEL. Therefore, our results demonstrated that the HEL decreases to 100 GPa for the MgO sample with 0.1% Schottky defects. Third, the release of the maximum shear stress (τ) takes place in advance in Fig. 6, which implies a new mechanism of plastic deformation for MgO sample with Schottky defects. We will discuss this new mechanism deeply in the next section. For comparison, we also plot the Hugoniot Us − Up relationship of the MgO sample with 0.1% Schottky defects as shown in Fig. 4. We can see that the velocity of elastic shock wave in MgO single crystal with 0.1% Schottky defects changes little compared to those of MgO single crystal without Schottky defects. The velocity of plastic wave increases and moves closer to the experimental Hugoniot data, but it still differs greatly with the experimental results reported by Ahrens5 and Marsh.33 We also note that the CPV resulting in plastic deformation decreases from 2.8 km s−1 (indicated by the left red arrow) to 2.2 km s−1 (indicated by the blue arrow). Furthermore, the HEL decreases from 120 GPa to 100 GPa. Whereas the CPV and the HEL are still much higher than the experimental value of 0.6–0.8 km s−1 (ref. 5 and 7) and no more than 10 GPa,5–7 respectively. Therefore, the high value of the CPV and the HEL mainly result from the high strain rate of the shock compression compared to the effects of Schottky defects. Furthermore, even well annealed Cu single crystals have a dislocation density of 105 to 108 cm−2, leading to a low experimental HEL.40 Therefore, dislocation sources, such as Schottky defects, could be an alternative explanation to the departure of the calculated single crystal Hugoniot with respect to the experimental Hugoniot.3.4 Deformation mechanism of MgO with Schottky defects
To understand the effects of Schottky defects on the Hugoniot Us − Up relationship and the HEL of MgO, we will discuss the deep insight of Schottky defects into the deformation mechanism of MgO. The decrease of shear stress corresponds to the plastic behavior, which is very complicate for MgO including dislocation activity, phase transformation and melting. Here we only focus on the plastic deformation mechanism of dislocation activity. The maximum shear stress (τ) decreases sharply as indicated by the black arrows in Fig. 7(a), while dislocations nucleate homogeneously when the shock wave travels through the material. Dislocations nucleate, grow and crisscross into a dislocation network, most of which are composed of 1/2〈110〉 pristine dislocations, a small number of 1/6〈112〉 Schottky dislocations as well as others. We also note that dislocation–dislocation interactions leads to the development of a three-dimensional pattern of intersecting loops in all available {110}〈110〉 slip planes with a large number of junctions. Most importantly, a double yielding phenomenon occurs in MgO sample with 0.1% Schottky defects, which is obviously different from the deformation behavior of the pristine MgO single crystal. Seeing the right part of the black arrow from Fig. 7(b), dislocations emitted from preexisting vacancies appear ahead of the shock front, which is in controversial to the clear region of Fig. 7(a). After initial stages of heterogeneous nucleation from the sources at 4–5 ps, there are two regions, that is the homogeneous and heterogeneous dislocation nucleation regions, divided by the black arrows in Fig. 7(b). The region of heterogeneous dislocation nucleations shows lower dislocation density than the region of homogeneous nucleation at 6 ps. Seen from the last frame of Fig. 7(b), the first slow decrease of the maximum shear stress corresponds to the vacancy emission dislocation, which has never been reported before, and the second decrease corresponds to the homogeneous nucleation of dislocations behind the shock front. The threshold stress of vacancy emission dislocation is less than that of dislocation homogeneous nucleation, leading to the vacancy emission of dislocations occurs first. Note that the width of shock front becomes wider compared to that of the pristine MgO single crystal sample due to this double yielding phenomenon. We find that vacancies (including monovacancies or bivacancies) serve as the nucleation sites for the shear planes and facilitate their growth. The elevated free energy and “free volume” associated with vacancies allow lower energy barrier for nucleation of local shear and the formation of dislocations. Fig. 8 illustrates the processes of dislocation nucleation, growth and expansion from a case of vacancy cluster V2. First, positions of the atoms around V2 are disturbed due to the shock compression from the frame (a) to (c). Then, a dislocation nucleates from the surface of the disturbed V2 in the frame (d), grows gradually and finally forms a dislocation loop from the frame (e) to (f). As a result, the shear planes are irregularly spaced due to the randomness of vacancies. For the case of shock wave propagating in MgO sample with 0.01% Schottky defects, this double yielding phenomenon is not obvious. Therefore, a critical concentration of Schottky defects is required for localized shearing to emit dislocations from Schottky defects.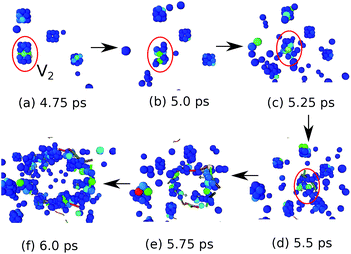 | ||
| Fig. 8 Series of snapshots of the MgO sample in the region of heterogeneous dislocation nucleations. The shock proceeds from the left to the right with Up = 3.0 km s−1 in the MgO sample of 0.1% Schottky defects. The arrows show the evolution of atomistic configurations. The centrosymmetry parameter27 is used for color coding. Only defective Mg atoms (vacancy surfaces and dislocations) of a part of the MgO sample are shown with centrosymmetry parameter ranging from 0.05 nm2 to 0.28 nm2. Nucleation of dislocation from the surface of the two vacancies in the red circle (a–c) is marked in the frame (d) at 5.5 ps. The last three frames indicate the evolution of a dislocation loop, including the nucleation (d), growth (e) and expansion (f). | ||
4 Conclusion
In summary, high velocity and strain rate shock compressions of MgO for [100] shock direction are investigated by MD simulations. We found that the shock compression of MgO shows three distinct regions, i.e., single elastic shock wave, two-wave structure consisting of an elastic wave followed by a plastic deformation wave and single plastic deformation shock wave. The results exhibit that the HEL of pristine MgO single crystal is 120 GPa for crystallographic [100] direction under the high strain rate of 1010 s−1. We also investigated the effects of Schottky defects on the Hugoniot Us − Up relationship and the HEL of MgO. First, the velocity of the plastic wave increases and moves closer to the experimental results. Second, the CPV decreases a little from 2.8 km s−1 to 2.2 km s−1. Third, the HEL decreases from 120 GPa to 100 GPa. Whereas the CPV and the HEL are still much higher than the experimental value of 0.6–0.8 km s−1 and no more than 10 GPa, respectively. The main factor leading to the discrepancy between our simulations and the experimental results is attributed to the strain rate in comparison with the effects of the defects. Most importantly, the double yielding phenomenon occurs for shock wave propagating in MgO sample with Schottky defects, i.e., homogeneous nucleation of dislocations accompanied by vacancy emission of dislocations, which has never been reported before. This work sheds light on clarifying the contradictory results of HEL of MgO in the literature and understanding the plastic deformation mechanism of MgO. The methodology of this study can be used to study the mechanical response of materials, which have a significant potential for use under extreme environment, such as irradiation condition resulting in high level concentration of vacancies.Conflicts of interest
There are no conflicts of interest to declare.Acknowledgements
This work was supported by the China Postdoctoral Science Foundation under Grant No. 2016M590586; the National Science Foundation of China under Grant No. 11605231, 11674329, 11504381, 11534012 & NSAF U1230202; the calculations were partly performed in Center for Computational Science of CASHIPS, the ScGrid of Supercomputing Center and Computer Network Information Center of Chinese Academy of Sciences, and partly using Tianhe-2JK computing time award at the Beijing Computational Science Research Center (CSRC).References
- M. Murakami, Y. Ohishi, N. Hirao and K. Hirose, Earth Planet. Sci. Lett., 2009, 277, 123–129 CrossRef CAS.
- T. S. Duffy, R. J. Hemley and H. K. Mao, Phys. Rev. Lett., 1995, 74, 1371–1374 CrossRef CAS PubMed.
- Z. Q. Wu, R. M. Wentzcovitch, K. Umemoto, B. Li, K. Hirose and J. Zheng, J. Geophys. Res., 2008, 113, B06204 CrossRef.
- K. Jin, X. Z. Li, Q. Wu, H. Y. Geng, L. C. Cai, X. M. Zhou and F. Q. Jing, J. Appl. Phys., 2010, 107, 113518 CrossRef.
- T. J. Ahrens, J. Appl. Phys., 1966, 37, 2532–2541 CrossRef CAS.
- D. E. Grady, in High Pressure Research: Applications in Geophysics, Academic Press, New York, 1977, p. 389 Search PubMed.
- X. Liu, T. Mashimo, K. Ogata, T. Kinoshita, T. Sekine, X. M. Zhou and W. J. Nellis, J. Appl. Phys., 2013, 114, 243511 CrossRef.
- G. D. Stevens, L. R. Veeser, P. A. Rigg and R. S. Hixson, AIP Conf. Proc., 2006, 845, 1353–1356 CrossRef CAS.
- R. S. McWilliams, D. K. Spaulding, J. H. Eggert, P. M. Celliers, D. G. Hicks, R. F. Smith, G. W. Collins and R. Jeanloz, Science, 2012, 338, 1330–1333 CrossRef CAS PubMed.
- D. Alfè, Phys. Rev. Lett., 2005, 94, 235701 CrossRef PubMed.
- A. Aguado and P. A. Madden, Phys. Rev. Lett., 2005, 94, 068501 CrossRef PubMed.
- Z. J. Liu, X. W. Sun, Q. F. Chen, L. C. Cai, X. M. Tan and X. D. Yang, Phys. Lett. A, 2006, 353, 221–225 CrossRef CAS.
- M. Matsui, J. Chem. Phys., 1998, 108, 3304–3309 CrossRef CAS.
- D. Cebulla and R. Redmer, Phys. Rev. B: Condens. Matter Mater. Phys., 2014, 89, 134107 CrossRef.
- S. N. Luo, T. C. Germann and D. L. Tonks, J. Appl. Phys., 2010, 107, 056102 CrossRef.
- Y. Tang, E. M. Bringa, B. A. Remington and M. A. Meyers, Acta Mater., 2011, 59, 1354–1372 CrossRef CAS.
- Y. Tang, E. M. Bringa and M. A. Meyers, Acta Mater., 2012, 60, 4856–4865 CrossRef CAS.
- E. Q. Lin, H. J. Shi and L. S. Niu, Modell. Simul. Mater. Sci. Eng., 2014, 22, 035012 CrossRef.
- B. P. Uberuaga, R. Smith, A. R. Cleave, F. Montalenti, G. Henkelman, R. W. Grimes, A. F. Voter and K. E. Sickafus, Phys. Rev. Lett., 2004, 92, 115505 CrossRef CAS PubMed.
- T. Hatano, Phys. Rev. Lett., 2004, 92, 015503 CrossRef PubMed.
- J. Marian, J. Knap and M. Ortiz, Acta Mater., 2005, 53, 2893–2900 CrossRef CAS.
- R. E. Rudd, Philos. Mag., 2009, 89, 3133–3161 CrossRef CAS.
- E. M. Bringa, S. Traiviratana and M. A. Meyers, Acta Mater., 2010, 58, 4458–4477 CrossRef CAS.
- C. J. Ruestes, E. M. Bringa, A. Stukowski, J. F. R. Nieva, G. Bertolino, Y. Tang and M. A. Meyers, Scr. Mater., 2013, 68, 817–820 CrossRef CAS.
- P. Erhart, E. M. Bringa, M. Kumar and K. Albe, Phys. Rev. B: Condens. Matter Mater. Phys., 2005, 72, 052104 CrossRef.
- S. Plimpton, J. Comput. Phys., 1995, 117, 1–19 CrossRef CAS.
- C. L. Kelchner, S. J. Plimpton and J. C. Hamilton, Phys. Rev. B: Condens. Matter Mater. Phys., 1998, 58, 11085 CrossRef CAS.
- A. Stukowski, V. V. Bulatov and A. Arsenlis, Modell. Simul. Mater. Sci. Eng., 2012, 20, 085007 CrossRef.
- A. Stukowski, Modell. Simul. Mater. Sci. Eng., 2010, 18, 015012 CrossRef.
- G. V. Lewis and C. R. A. Catlow, J. Phys. C: Solid State Phys., 1985, 18, 1149–1161 CrossRef CAS.
- H. K. Mao and P. M. Bell, J. Geophys. Res., 1979, 84, 4533–4536 CrossRef CAS.
- K. Hirose, N. Sata, T. Komabayashi and Y. Ohishi, Phys. Earth Planet. Inter., 2008, 167, 149–154 CrossRef CAS.
- S. P. Marsh, LASL Shock Hugoniot Data, University of California Press, Berkeley, CA, 1980, p. 312 Search PubMed.
- S. V. Sinogeikin and J. D. Bass, Phys. Earth Planet. Inter., 2000, 120, 43–62 CrossRef CAS.
- S. Sarva and S. Nemat-Nasser, Mater. Sci. Eng., A, 2001, 317, 140–144 CrossRef.
- T. Hatano, Phys. Rev. Lett., 2004, 93, 085501 CrossRef PubMed.
- C. E. Botez, W. C. Elliott, P. F. Miceli and P. W. Stephens, Phys. Rev. B: Condens. Matter Mater. Phys., 2002, 66, 075418 CrossRef.
- M. Nastasi, J. W. Mayer and J. K. Hirvonen, Ion-Solid Interactions: Fundamentals and Applications, Cambridge University, Cambridge, 2004 Search PubMed.
- S. Minshall, in Response of metals to high velocity deformation, ed. P. G. Shewmon and V. R. Zackay, Interscience, New York, 1961, pp. 249–274 Search PubMed.
- O. E. Jones and J. D. Mote, J. Appl. Phys., 1969, 40, 4920–4928 CrossRef CAS.
| This journal is © The Royal Society of Chemistry 2017 |

