
 Open Access Article
 This Open Access Article is licensed under a Creative Commons Attribution-Non Commercial 3.0 Unported Licence
Study of hydrate formation in gas-emulsion multiphase flow systems
Chaoyu Ruan ,
Lin Ding,
Bohui Shi*,
Qiyu Huang and
Jing Gong
,
Lin Ding,
Bohui Shi*,
Qiyu Huang and
Jing Gong
National Engineering Laboratory for Pipeline Safety, MOE Key Laboratory of Petroleum Engineering, Beijing Key Laboratory of Urban Oil and Gas Distribution Technology, China University of Petroleum-Beijing, Beijing 102249, People's Republic of China. E-mail: bh.shi@cup.edu.cn
First published on 13th October 2017
Abstract
As the oil & gas industry moves into deep water, hydrate has been a major hazard to the deep sea flow assurance. The objective of this work is to study the hydrate formation kinetics in a gas-emulsion multiphase flow system. A series of experiments were carried out with different gas/liquid flow rates using a high pressure flow loop. Results showed that the experimental data were remarkably reproducible in the flow loop system. It was found that as the gas flow rate and liquid flow rate increased, the hydrate formation induction time increased and the critical supercooling degree decreased. The gas/liquid flow rates exhibited little effect on the hydrate formation amount. As the liquid hold-up increased, both the induction time and the critical supercooling degree increased at first and then decreased. In addition, the hydrate formation amount remained almost constant when the liquid hold-up was higher than 20%.
1 Introduction
Gas hydrates are ice-like crystals formed by gas and water molecules under low temperature and high pressure conditions.1 Due to their special forming conditions, it is easy for hydrates to form in oil & gas transportation pipelines, especially for deep-sea transportation pipelines which have a relatively high operating pressure and low operating temperature. Methods have been proposed in the past few decades to prevent hydrate formation and plugging, such as thermal insulation, depressurization, hydrate inhibitor injection and so on. Currently, the most commonly used method is thermodynamic hydrate inhibitor (THI) injection,2,3 which can raise the hydrate equilibrium curve apparently and thus make the operating conditions unsuitable for hydrates to form. This method has been in use for decades in oil & gas field production. However, the economic costs of the THI method are high, especially when the water cut increases at the late stage of the field production. An alternative method is the hydrate plugging risk control strategy, in which we allow hydrate to form but control its agglomeration degree to avoid hydrate plugging.4 In the hydrate plugging risk control method, hydrate formation properties are a key point that need to be studied, such as the induction time, the formation rate and the maximum formation amount and so on.The hydrate formation properties can be influenced by many operating parameters such as the pressure, temperature, chemical additives and flow rates and so on. The influence of operating pressure, temperature and chemical additives have been studied by many researchers and coincident conclusions have been obtained: high operating pressure and low operating temperature can shorten the hydrate formation induction time, as this can provide a relative higher driving force;5–12 injection of kinetic hydrate inhibitor (KHI) and anti-agglomerate (AA) can both prolong the hydrate formation time.13–16 It has also been reported that the increase in salinity can shift the phase equilibrium curve more toward the inhibited zone.17 But for the influence of the flow rates, relative literatures are few and no consensus have been achieved so far.
Gaillard et al.18 studied the hydrate formation kinetics on a hydrate flow loop with 1 inch diameter and 22 m length. The influence of the operating conditions such as pressure, liquid flow velocity, and the cooling temperature ramping on hydrate formation kinetics were studied. Results showed that the hydrate growth rate and water conversion rate increased with the increasing pressure and the increasing flow rate. However, the cooling rate showed no influence on the formation kinetics.
Jensen et al.19 studied the hydrate formation kinetics using a stainless steel hydrate equilibrium cell. They compared well agitated systems with the poor agitated systems and found that low stirring rates were expected to exhibit poorer reproducibility. Meanwhile, the induction time measured under poor agitated systems would be slightly prolonged compared to that under well agitated conditions. They explained that this was because higher stirring rates gave lower surface energies, which would promote hydrate nucleation process.
Sheng Dai et al.20 studied the hydrate formation process under quiescent and dynamic conditions respectively. They demonstrated that induction time of hydrate formation followed a log-normal distribution. Through comparison of the experimental results, they found that the mechanical vibration facilitated nucleation but it did not suppress the inherent stochastic nature of nucleation. In addition, their results showed that the acceleration could better adjust the hydrate formation induction times than vibration frequency, amplitude, or velocity.
Lv et al.21 conducted a series of hydrate formation experiments in w/o emulsion systems using a high pressure flow loop. The hydrate formation induction time was found to be shorter in high supercooling degree and high supersaturation degree. In addition, their results showed that the induction time decreased first and then increased with the increasing liquid flow rate, which was different with the results of Selim. Lv et al. attributed this phenomenon to the two functions of the increasing liquid flow rate: on one hand the increasing flow rate could increase the mixing intensity as argued by Selim et al., on the other hand the increasing flow rate could also promote the friction heat generation, which weakened the system's cooling efficiency. This result indicates one of the differences between flow loop experiments and stirred vessel experiments: the friction heat of fluid flow is non-ignorable in flow loop experiments.
Li et al.22 conducted hydrate formation experiments in a stainless steel vessel and found that as the agitation rate increased the hydrate formation induction time decreased first, and then increased again as the agitation rate increased further. Also, they revealed that the hydrate formation rate increased but the total formation amount decreased with the increasing agitation rate.
Selim et al.23 studied the hydrate induction time a stress/strain controlled rheometer and found that the hydrate formation induction time increased with the increasing temperature and decreased with increasing pressure, which is the same with the results of other researchers. Also, they conducted the experiments at different flow shear rates and found that higher shear rate could lead to shorter hydrate formation induction time, which could be due to the higher mixing intensity.
These studies uncovered some related law of hydrate formation with different flow rates (or agitation rates) in single phase systems. For some special operating conditions, however, it is very common that the gas and liquid product form a multiphase flow, especially the under-sea oil & gas production and transportation systems, in which the hydrates are easy to form. Therefore, it is very important to clarify the hydrate formation kinetics in multiphase flow systems. In this work, the influences of different gas/liquid flow rates and different liquid loading on hydrate formation were studied.
2 Experimental section
2.1. High pressure hydrate flow loop
The experiments in this work were conducted using a high pressure flow loop, which was constructed by the State Key Laboratory of Pipeline Safety in China University of Petroleum (Beijing). The loop consists of a centrifugal pump, a gas compressor, four test sections, a data acquisition system and several data sensors. The test section is 30 m long in total and the internal diameter is 2.54 cm. It is made from carbon steel and the design pressure is 15 MPa. The working temperature of the flow loop ranges from −20 °C to 100 °C, which is controlled by four Julabo water baths with a precision of 0.01 °C. Besides, the loop is equipped with 5 pressure sensors and 8 temperature sensors, with the precision of 0.01 bar and 0.1 °C respectively. It is also equipped with two flow meters, one for the liquid flow rate and the other one for gas flow rate. On the test section, a focused beam reflectance measurement (FBRM) probe and a particle video microscope (PVM) probe are quipped, which can help to study the size and behaviors of hydrates particles from a microscopic view. A photograph of the test section and a process flow diagram are shown in Fig. 1.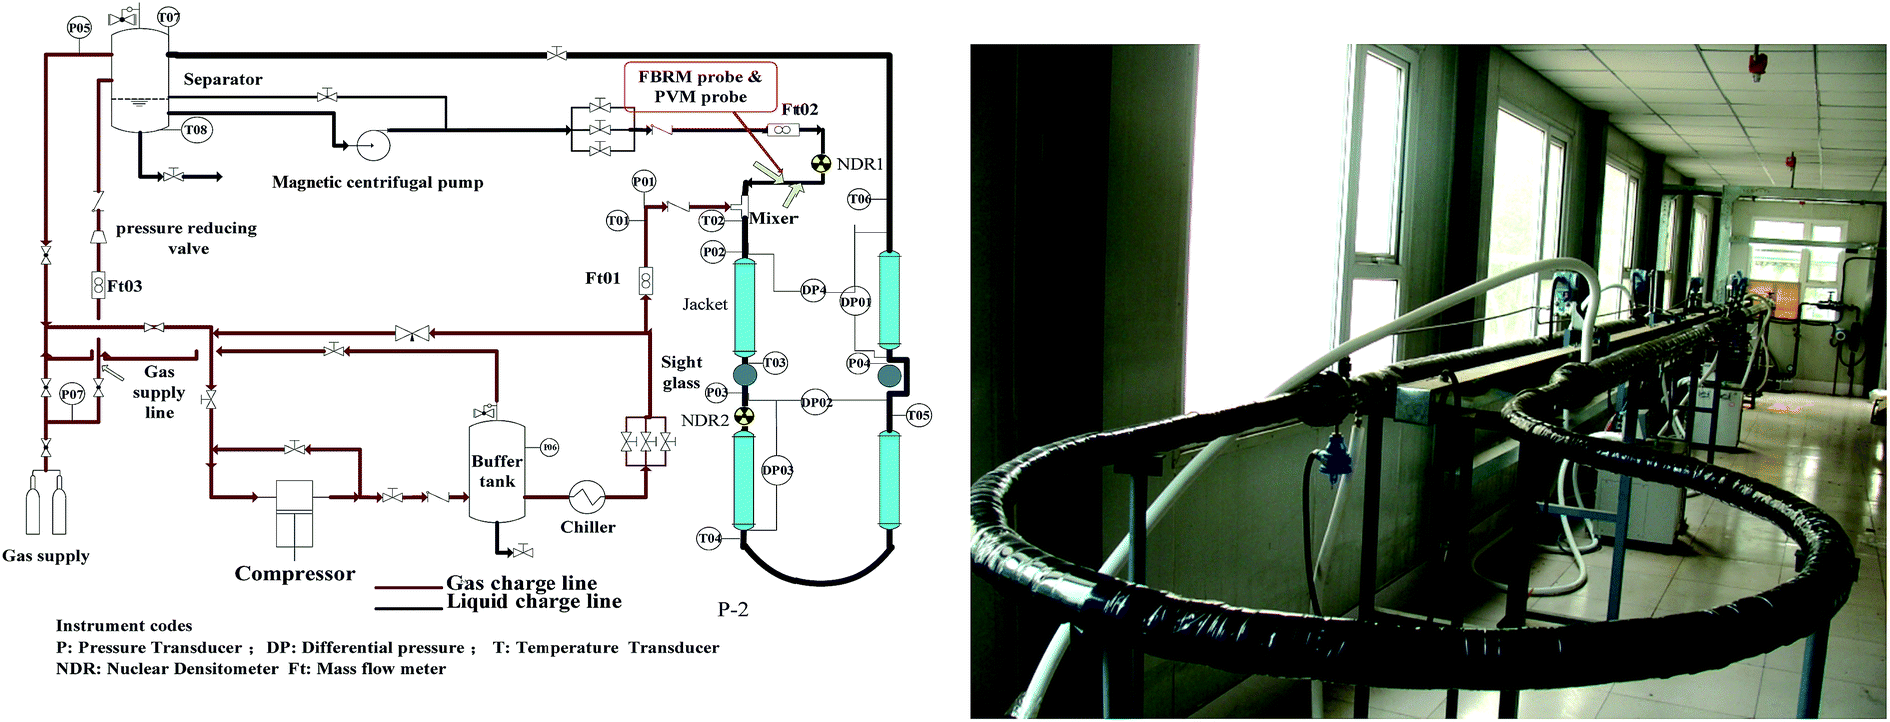 | ||
| Fig. 1 (Left) Schematic diagram of the high pressure hydrate flow loop; (Right) photograph of the flow loop test section. | ||
2.2. Materials and procedures
The materials used in the experiments include civil natural gas from Shanjing Natural Gas Pipeline in China, deionized water, −20# diesel oil and AAs. Compositions of the natural gas and diesel oil are listed in Tables 1 and 2 respectively. The AA is not an industrial AA and it is extracted from a saponins plant that developed by the Chemical Engineering Department in China University of Petroleum-Beijing.24| Composition | mol% | Composition | mol% |
|---|---|---|---|
| N2 | 1.53 | C3 | 3.06 |
| CO | 2.05 | iC4 | 0.33 |
| CO2 | 0.89 | iC5 | 0.04 |
| C1 | 89.02 | nC6+ | 0.01 |
| C2 | 3.07 | — | — |
| Composition | mol% | Composition | mol% |
|---|---|---|---|
| C7 | 1.05 | C15 | 4.86 |
| C8 | 0.92 | C16 | 4.37 |
| C9 | 4.6 | C17 | 4.64 |
| C10 | 11.4 | C18 | 5.63 |
| C11 | 11.73 | C20 | 10.74 |
| C12 | 12.24 | C24 | 9.77 |
| C13 | 9.94 | C28+ | 1.28 |
| C14 | 6.9 | — | — |
The experiments were carried out with 10% water cut and 1% AAs dosage. The water cut was defined as the ratio of the water volume to the whole liquid volume. The AA dosage is defined as the volume fraction of AA additive in the water phase. Setting temperature of the water bath was 0 °C. The experiment list is shown in Table 3. To illustrate distribution of the data points on gas–liquid flow pattern map, the flow pattern map proposed by Ding et al.25 was cited here, as shown in Fig. 2.
| Exp. no. | Flow pattern | Qg (kg h−1) | Ql (kg h−1) | P MPa | Exp. no. | Flow pattern | Qg (kg h−1) | Ql (kg h−1) | P MPa |
|---|---|---|---|---|---|---|---|---|---|
| 1 | Bubble | 50 | 1100 | 5 | 10 | Annular | 180 | 800 | 5 |
| 2 | Bubble | 60 | 1100 | 5 | 11 | Slug | 180 | 1000 | 5 |
| 3 | Slug | 80 | 1100 | 5 | 12 | Annular | 260 | 400 | 5 |
| 4 | Slug | 100 | 1100 | 5 | 13 | Stratified | 100 | 500 | 6 |
| 5 | Stratified | 50 | 500 | 5 | 14 | Slug | 100 | 1100 | 6 |
| 6 | Bubble | 50 | 1700 | 5 | 15 | Slug | 100 | 1200 | 6 |
| 7 | Stratified | 80 | 500 | 5 | 16 | Annular | 260 | 500 | 6 |
| 8 | Stratified | 100 | 500 | 5 | 17 | Bubble | 70 | 1800 | 6 |
| 9 | Annular | 180 | 500 | 5 |
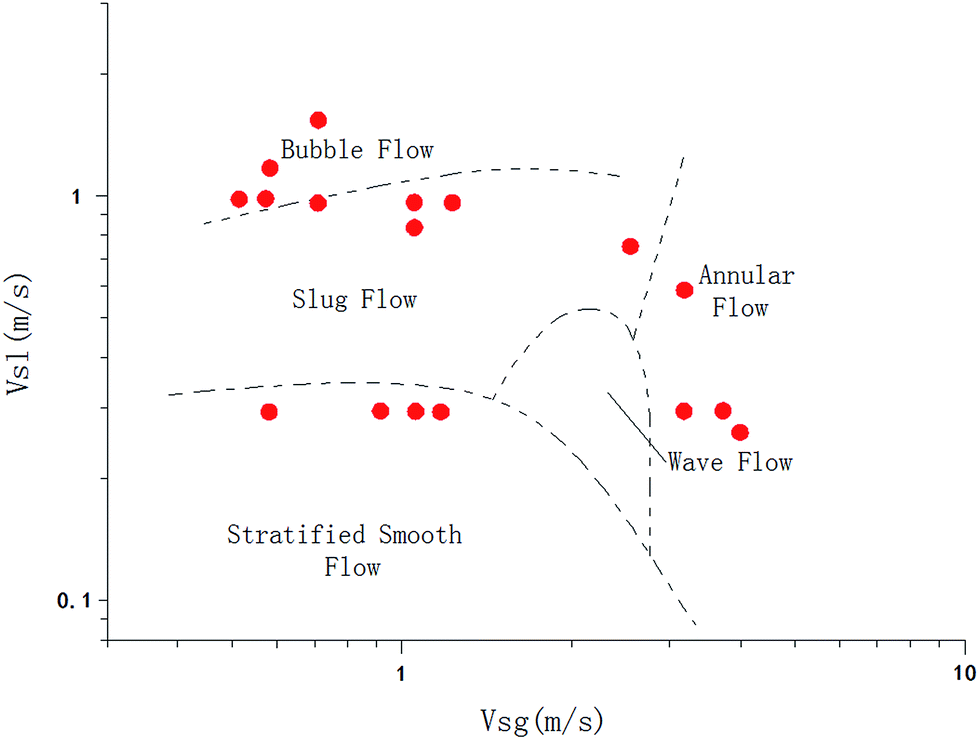 | ||
| Fig. 2 Experimental points distribution on the flow pattern map by Ding et al.25 | ||
The experimental procedure is briefly introduced as follows: (i) vacuum the loop to −1 bar using a vacuum pump to eliminate the influence of air. (ii) Load the deionized water and diesel oil at a specified water cut. (iii) Inject natural gas into the loop to reach the experimental pressure. (iv) Circulate the liquid and gas by the pump and compressor, respectively. The gas/liquid flow rates can be adjusted to form different gas–liquid flow patterns, in which the hydrates will form in the next step. (v) When the monitored flow parameters reach a stable state, cool down the loop to form hydrates crystals. In this period, both the flow parameters and the hydrates particles behaviors are recorded. (vi) When all the collected data keep stable, increase the temperature to decompose the hydrates. Then, start another set of experiment in another flow pattern according to the above steps.
3 Results and discussion
In this section, the influences of gas/liquid flow rates, liquid volume fraction and different flow patterns are discussed. And the target variables are hydrate formation induction time, hydrate formation critical supercooling degree and the maximum hydrate formation amount and water conversion rate. As the hydrate was formed by decreasing the temperature with a constant initial pressure, the induction time is defined as the period between the time when the system reaches the hydrate equilibrium temperature and the time when hydrate begins to form.21 The critical supercooling degree is defined as the difference between hydrate equilibrium temperature and hydrate forming temperature. Besides, the maximum hydrate formation amount is presented in the form of hydrate volume fraction, which is estimated through the gas consumption amount during the experiments as follows:The gas consumption is calculated by the pressure difference before and after each experiment:
 | (1) |
Based on the gas consumption amount, the hydrate volume fraction can be calculated by introducing the hydration number for SII hydrate:26
 | (2) |
As we know, hydrate formation is a crystallization process during which the heat release is obvious. So when hydrates begin to form, the system temperature will show a sudden increase. In this work, the hydrate formation onset was confirmed through the temperature increase during the cooling process, as shown in Fig. 3. Additionally, hydrate formation will also cause an increase of the flow pressure drop across the pipe. Also, based on this pressure drop increase the hydrate formation can be confirmed as well.
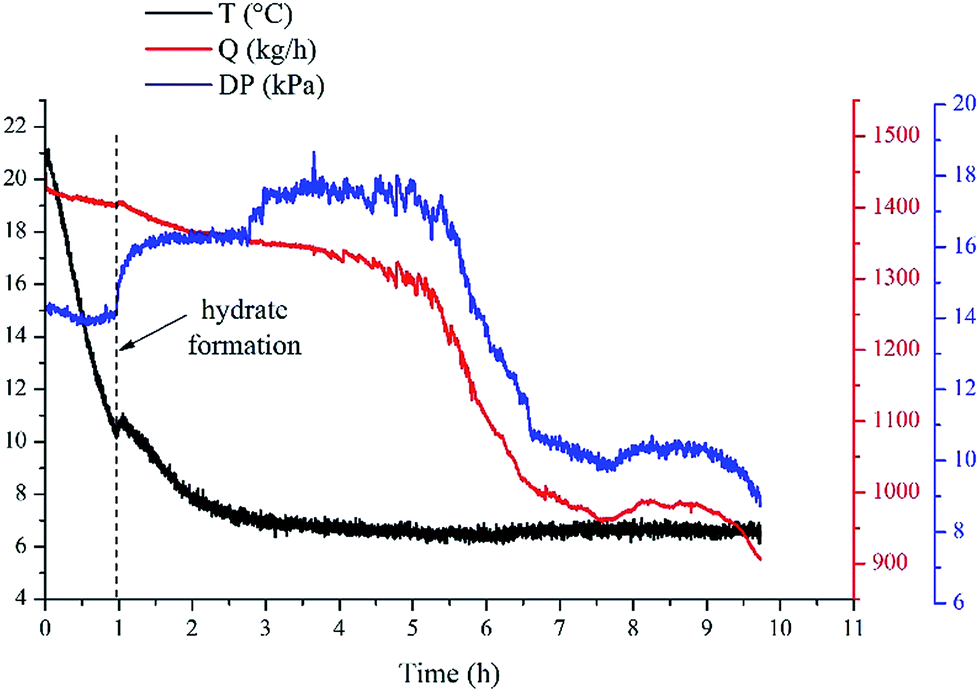 | ||
| Fig. 3 Typical results in hydrate formation experiments. | ||
Repeated experiments were carried out to confirm the repeatability of the experimental results, as shown in Fig. 4. Results showed that the induction time and the critical supercooling degree are remarkably repeatable in our experimental systems. The error range of the induction time and the supercooling degree is within ±0.1 h and ±0.3 °C, respectively. According to the conclusions of Villano et al.27 and Salamat et al.,28 large volume reactor can reduce the stochasticity of the induction time, probably due to existence of more locations for hydrate nucleation. Therefore, the repeatability of our experimental results is likely due to the large volume (250 L) of our flow loop. The determine method for hydrate formation induction time and supercooling degree is shown in Fig. 4. The top-dash line represents the equilibrium temperature of hydrate formation T1, the bottom-dash line represents the actual formation temperature T2. The difference value between T1 and T2 is the subcooling temperature for hydrate formation, and the time difference between these two points is the hydrate formation induction time.
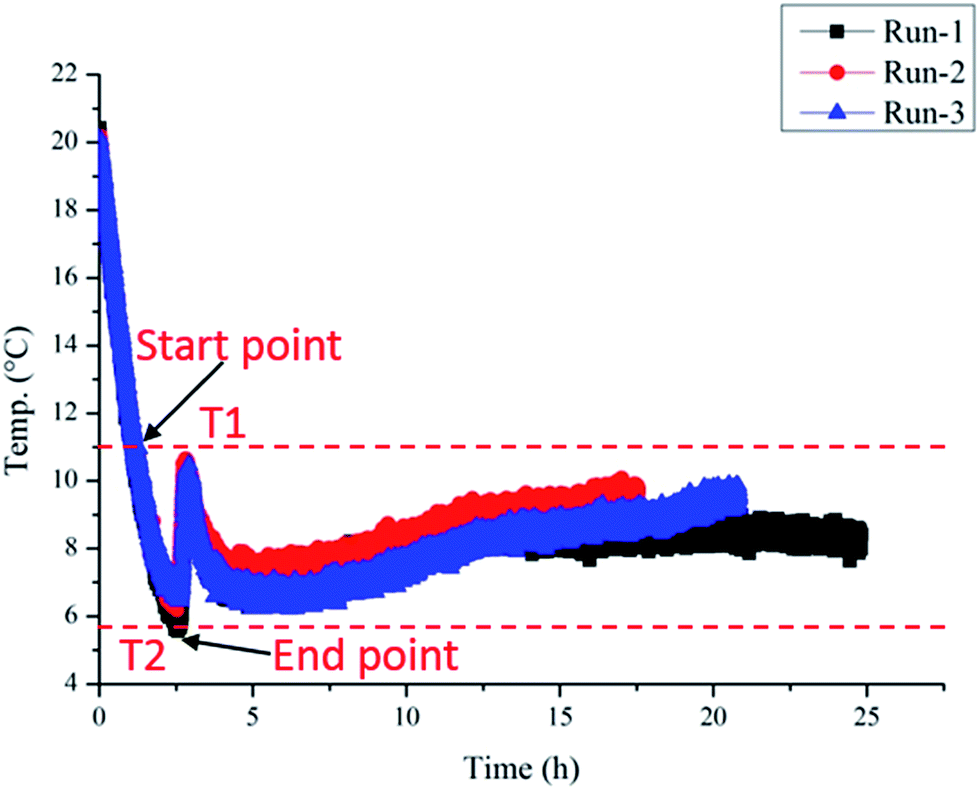 | ||
| Fig. 4 Temperature changes in three groups of repeated experiments: Ql = 1700 kg h−1 and Qg = 50 kg h−1 at 5 MPa. | ||
3.1. Effect of gas/liquid flow rate on hydrate formation
Effect of the gas and liquid flow rate on hydrate formation induction time is shown in Fig. 5 and 6, respectively.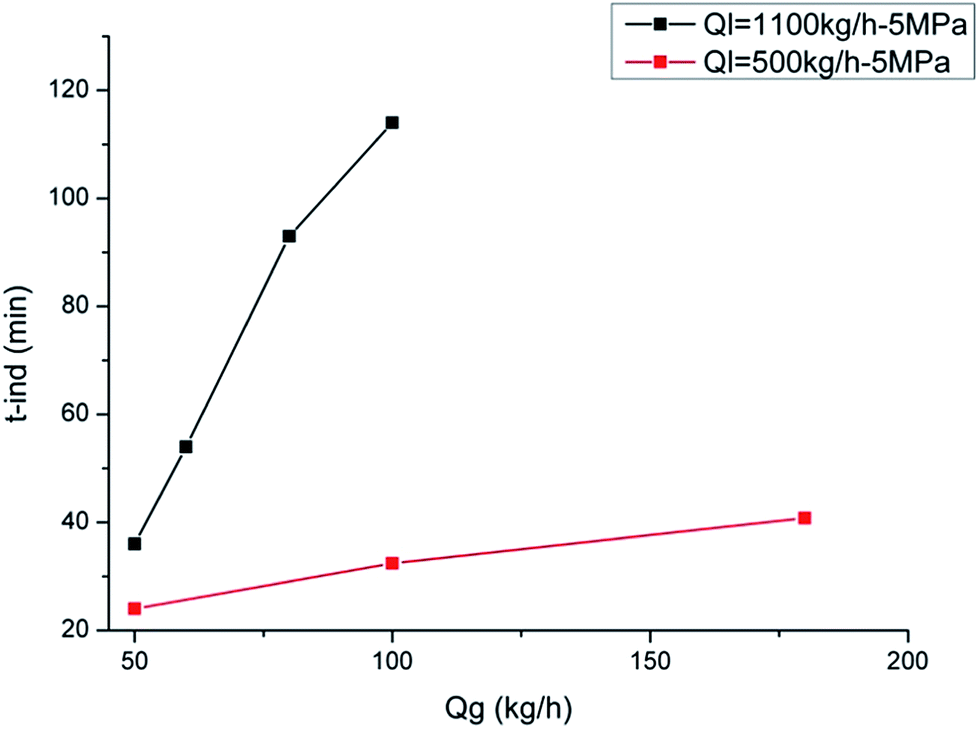 | ||
| Fig. 5 Induction time with different gas flow rate. | ||
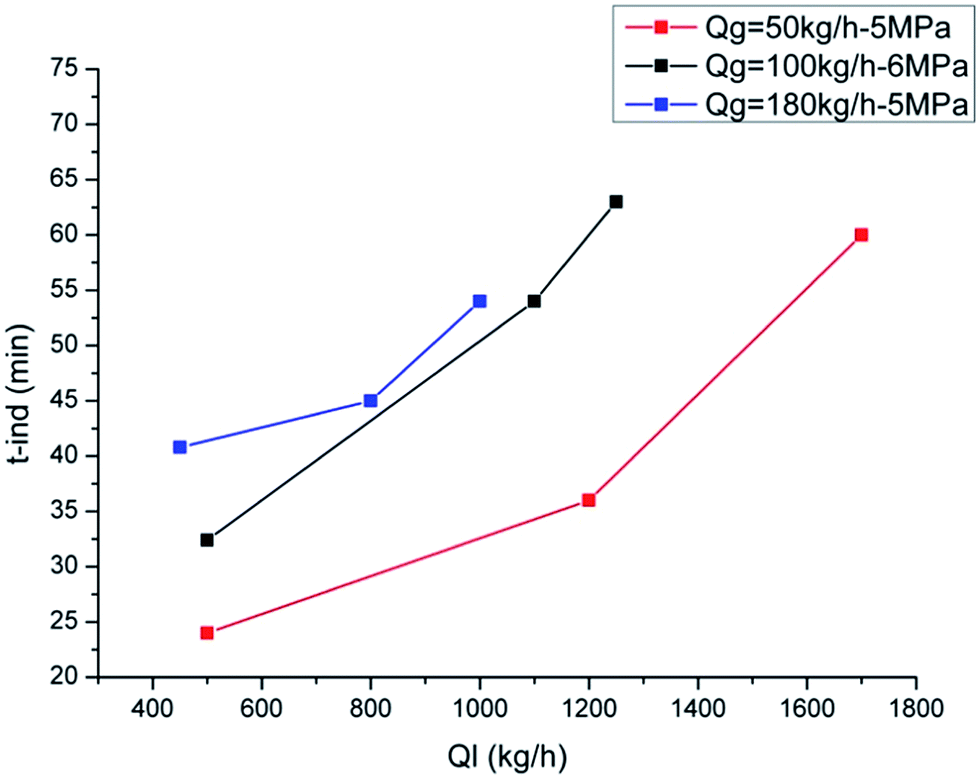 | ||
| Fig. 6 Induction time with different liquid flow rate. | ||
As shown in Fig. 5, with a constant liquid flow rate of 500 kg h−1 and 1100 kg h−1, the induction time increases with the increase of gas flow rate. On one hand, the increase of the gas flow rate can boost the friction heat generation between the gas–liquid and gas–solid interface, which diminishes the system's cooling efficiency and prolongs the induction period. On the other hand, because of the increasing gas flow rate, the system requires higher cooling capacity to achieve the critical degree of supercooling. So the increase of the gas flow rate can lead to a longer induction period. However, this conclusion is only valid for the co-current flow system, and it may show a different result in the counter current flow system.
Also, we can see that at higher liquid flow rates, the increase extent of the induction time is larger. When the liquid flow rate is 1100 kg h−1, the induction time ranges from 36 min to 114 min; while when the liquid flow rate is 500 kg h−1, the induction time only ranges from 24 min to 42 min. This is because the gas flow section is smaller in the system with a larger liquid flow rate. So the influence of increasing the gas flow rate may be more obvious and the cooling efficiency reduction caused by gas flow rate increase is more serious.
As we can see from Fig. 6, as the liquid flow rate increases, the hydrate formation induction time increases, which is different from the results in single phase system and in stirred reactor. On one hand, the increasing liquid flow rate gives larger friction pressure drop, generating more friction heat according to the law of energy balance. This can weaken the cooling efficiency of the flow system and can prolong the induction period. On the other hand, the increasing flow rate can also enhance the mass transfer process and shorten the induction period as well. Lv et al.21 found that there was a balance point of these two effects at a middle flow rate of about 1200 kg h−1 in single phase systems. So their results showed that the hydrate formation induction time decreased at first and then increased with the increasing flow rate. However, the results in the present work indicate that, in multiphase flow systems, the former effect of liquid flow rate is more obvious than the later and the induction time increases with the increasing gas/liquid flow rate.
In the field of oil and gas transportation, traditional way of hydrate control is to prevent hydrate formation in pipeline by way of insulation and thermodynamic inhibitor injection and so on. In this way, the retention time of gas and oil in flow line is the sum of the cooling time to reach the hydrate formation temperature and the induction time. This means that a longer induction time gives a longer retention time of oil and gas in flow line. If the induction time is larger than the time needed for the fluid to flow from wellhead to platform, it means the flow line is free of hydrate plugging risk. On the other hand, for the hydrate risk management strategy which is a novel and promising method proposed in recent years, hydrates are allowed to form in flow line. The oil and gas are transported as a slurry flow and the hydrate agglomeration degree must be controlled by anti-agglomerants to prevent plug formation. In this method, oil and gas retention time is not strictly dependent on the induction time. But a longer induction time can still reduce the hydrate plugging risk. According to the above analysis, a longer induction time can extend the maximum permissible retention time of gas and oil in flow line. So we suggested that the oil and gas flow line runs at a larger flow rate to extend the hydrate formation induction time.
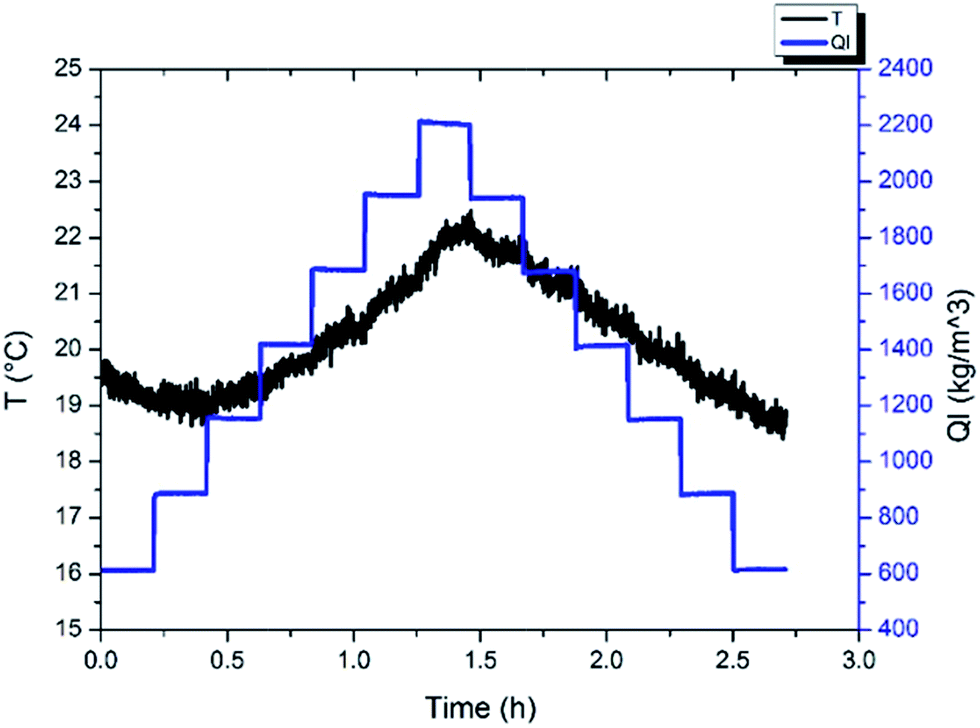
Fig. 7 and 8 show the influence of gas and liquid flow rate on the hydrate formation critical supercooling degree. We can see that the critical supercooling degree decrease with both the increase of gas and liquid flow rate. This indicates that, for the system with larger gas and liquid flow rates, it needs a lower driving force to form hydrate crystals. This is because that a larger gas/liquid flow rate stands for a larger shear strength, which can make the water droplets disperse in the liquid phase more uniformly and can diminish the water droplet diameter. This can provide more gas–water interfaces, namely the hydrate nucleation sites. Besides, the larger gas/liquid flow rate can also provide a better mass transfer condition due to its large flow disturbance. So the critical supercooling degree decreases with the increasing gas/liquid flow rate. Results of the driving force indicate that the crystals form more easily with larger gas/liquid flow rates. But this is not in contradiction to the induction time results. Larger flow rate can reduce the driving force required for crystallization; however, it can also reduce the system's cooling efficiency, which would prolong the time required to reach the critical supercooling. If we set the water bath temperature at a constant point and then change the liquid flow rate, the system's temperature would change significantly with the flow rate changes, as shown in Fig. 9. This indicated that the friction heat is obvious in flow loop systems, especially for high gas/liquid flow rate. So, even though the required driving force is reduced at higher flow rate, the induction time may not decrease with the increasing flow rates.
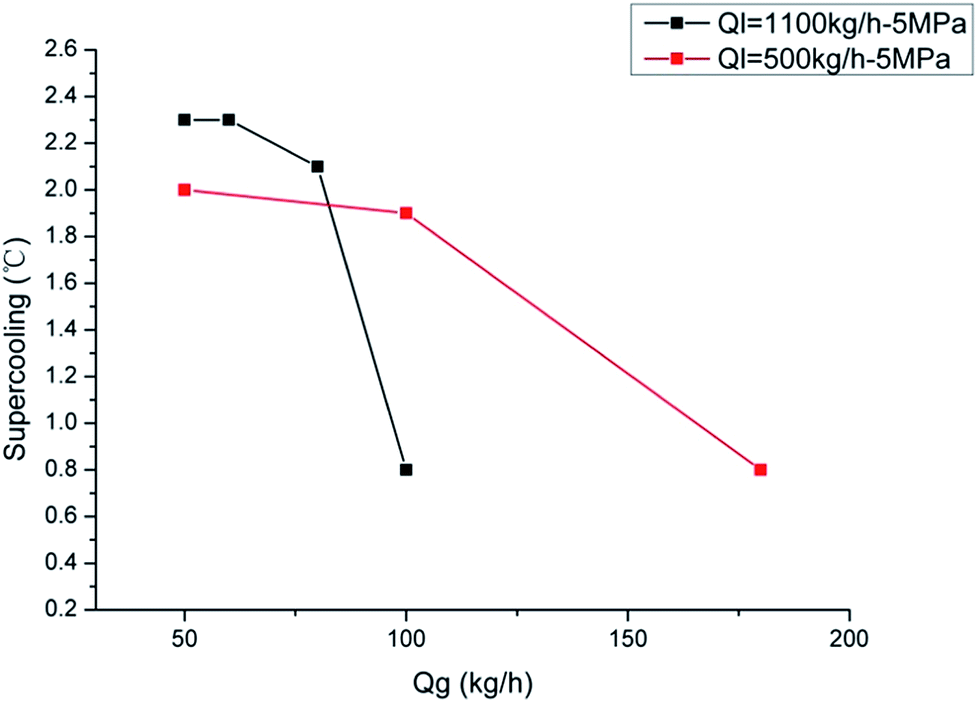 | ||
| Fig. 7 Critical supercooling degree with different gas flow rate. | ||
 | ||
| Fig. 8 Critical supercooling with different liquid flow rate. | ||
 | ||
| Fig. 9 Changes of fluid temperature with liquid flow rate at constant bath temperature condition. | ||
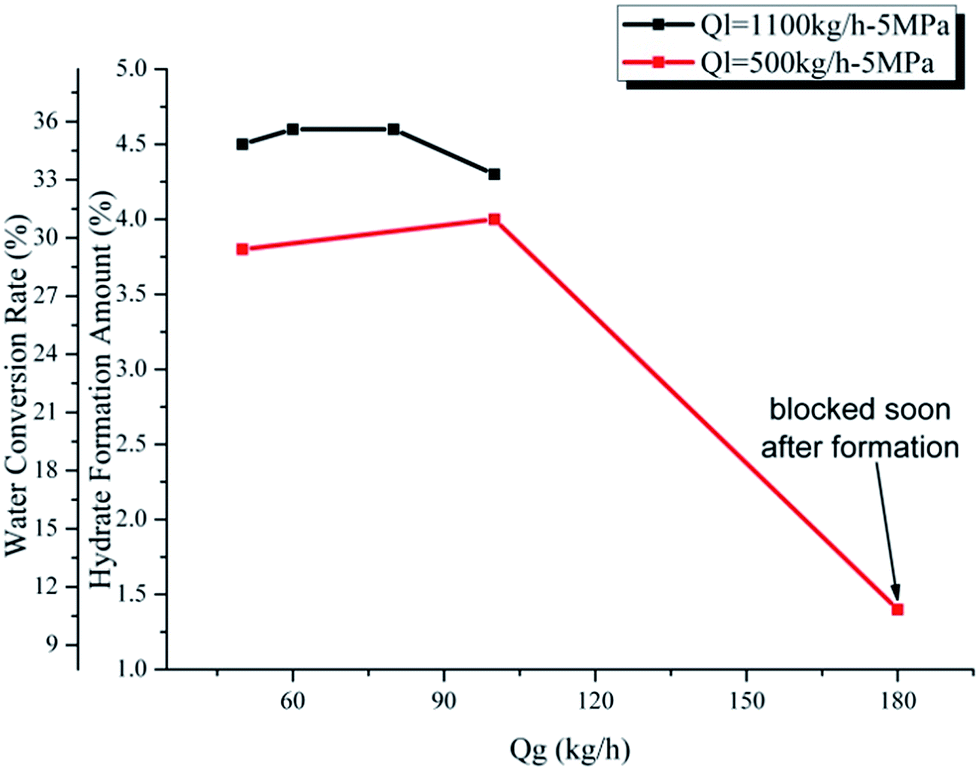
Fig. 10 and 11 show the influence of gas and liquid flow rate on the maximum hydrate formation amount and water conversion rate. We can see from Fig. 10 and 11 that there are two particular points showing an extremely small value: (Qg = 180 kg h−1, Ql = 500 kg h−1) in Fig. 10 and (Ql = 450 kg h−1, Qg = 180 kg h−1) in Fig. 11. This is caused by the rapid blockage after hydrate formation in these two experiments, which make it too short for the hydrate to achieve a complete growth. Except for these two points, the hydrate formation amount and water conversion rate change very little with the gas/liquid flow rate: from 3.8% to 4.6% for the hydrate formation amount and from 29.4% to 35.6% for the water conversion rate. This indicates that as long as the hydrate growth period is long enough (without rapid blockage), the maximum hydrate formation amount and water conversion rate will not be significantly influenced by the gas/liquid flow rate. This is because that, for a flow system, the maximum hydrate formation amount and the water conversion rate are mainly determined by the water cut, the experimental pressure and temperature. If these three factors are fixed, the influence of gas/liquid flow rate is small (in conditions without rapid blockage). The gas/liquid flow rate is mainly related to the mass and heat transfer process, which is a key factor of hydrate formation rate. However, if the system got a long enough time to achieve complete hydrate growth (without rapid blockage), the influence of gas/liquid flow rate can only make the maximum hydrate formation amount and water conversion rate vary in a quite small range.
 | ||
| Fig. 10 Hydrate formation amount and water conversion rate with different gas flow rate. | ||
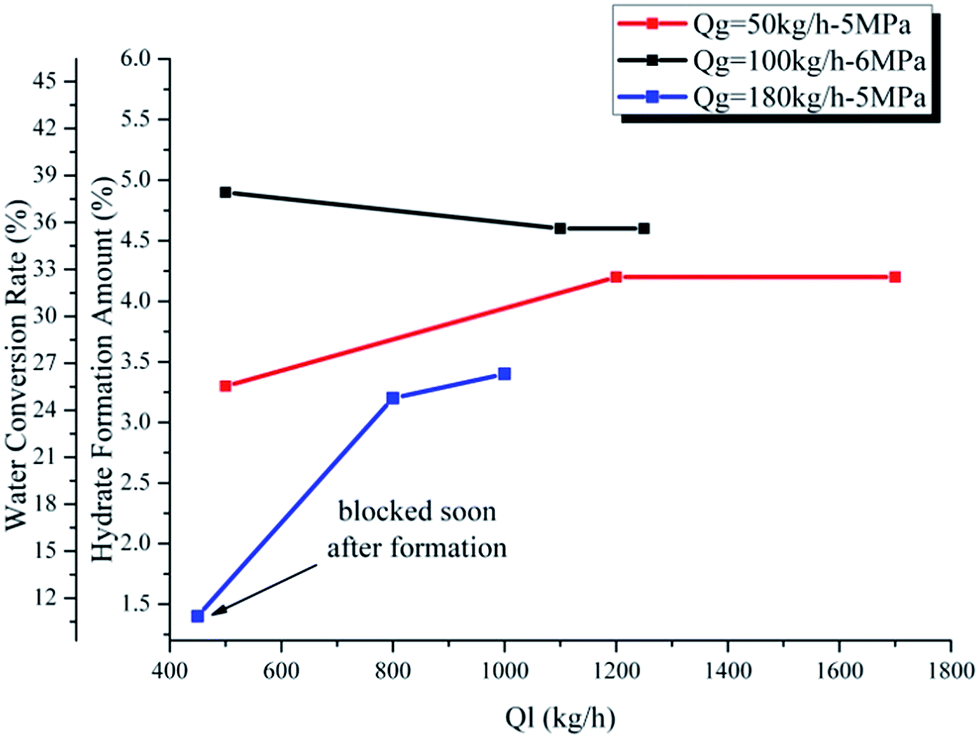 | ||
| Fig. 11 Hydrate volume fraction and water conversion rate with different liquid flow rate. | ||
3.2. Effect of the liquid volume fraction and flow pattern on hydrate formation
By changing the gas/liquid flow rate, a series of liquid volume fraction can be obtained during the experiments. For some situations, system with different gas/liquid flow rate may have the same liquid volume fraction. In addition, the flow pattern may also transfer from one to another with the changes of gas/liquid flow rates. So the results discussed in Section 3.1 may be lack of universality. Therefore, study of the influence of the liquid volume fraction and gas–liquid flow patterns are of great necessity. To consider the gas–liquid slip on the interphase, the liquid volume fraction was calculated by the gas and liquid flow rates and then was modified using the method proposed by Dukler.29 The hydrate formation properties with different liquid volume fraction are shown in Fig. 12 to 14. During the experiments, the flow patterns were confirmed by the visual observation through the glass window, which is equipped on the test section of the flow loop.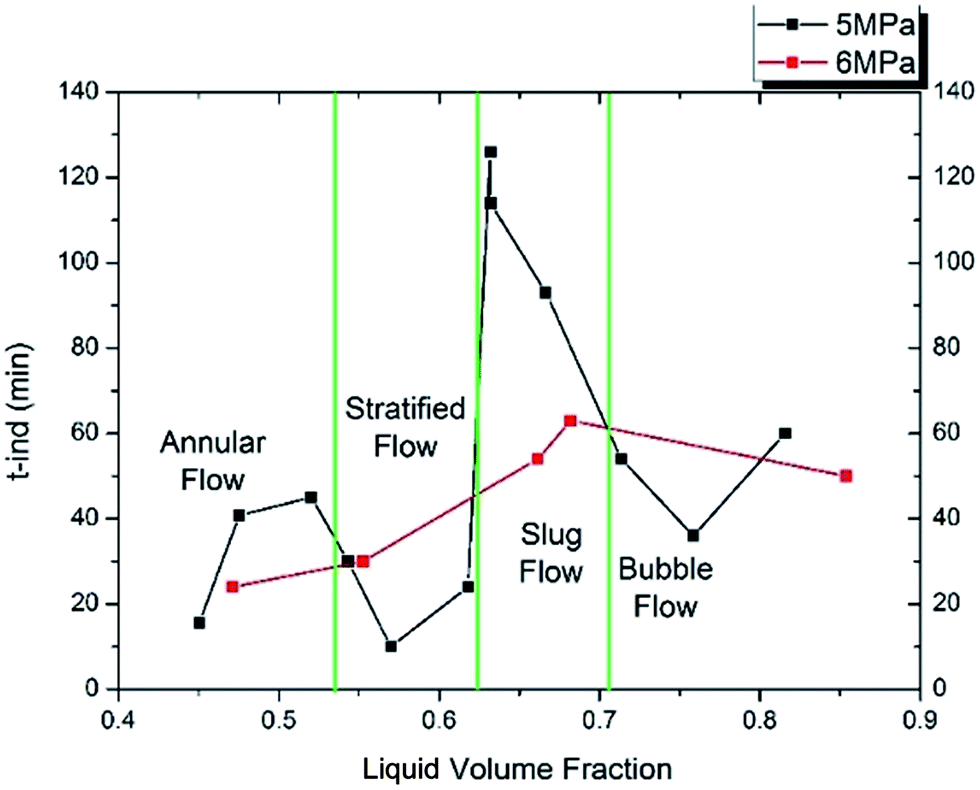 | ||
| Fig. 12 Induction time with different liquid loading and flow patterns. | ||
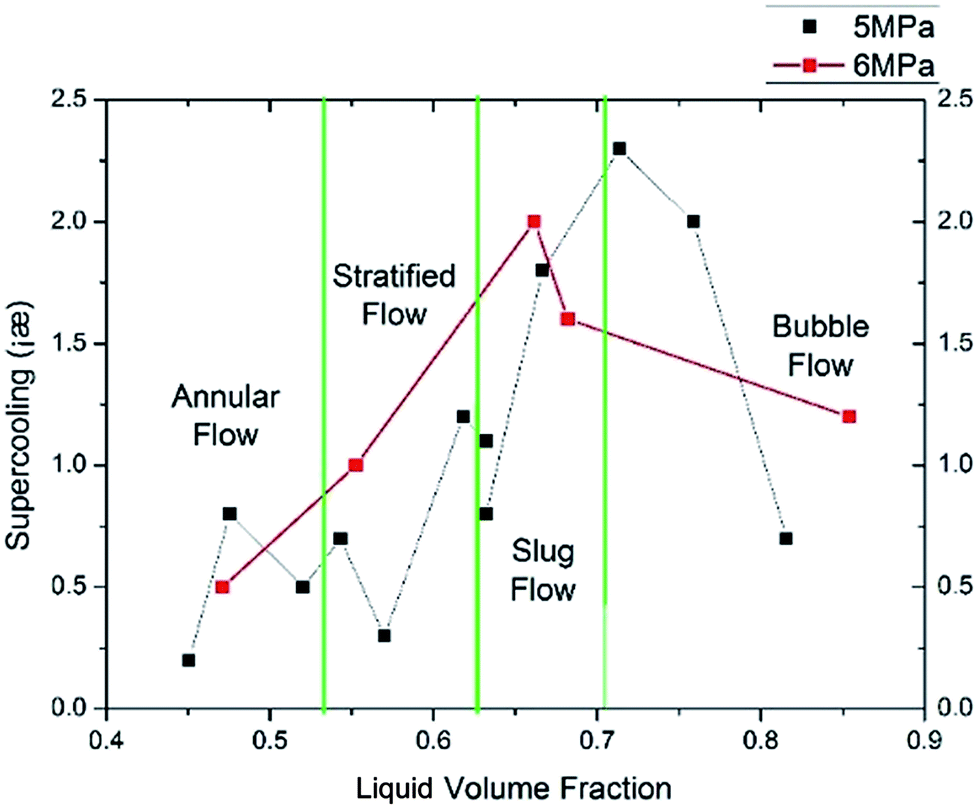 | ||
| Fig. 13 Critical supercooling with different liquid loading and flow patterns. | ||
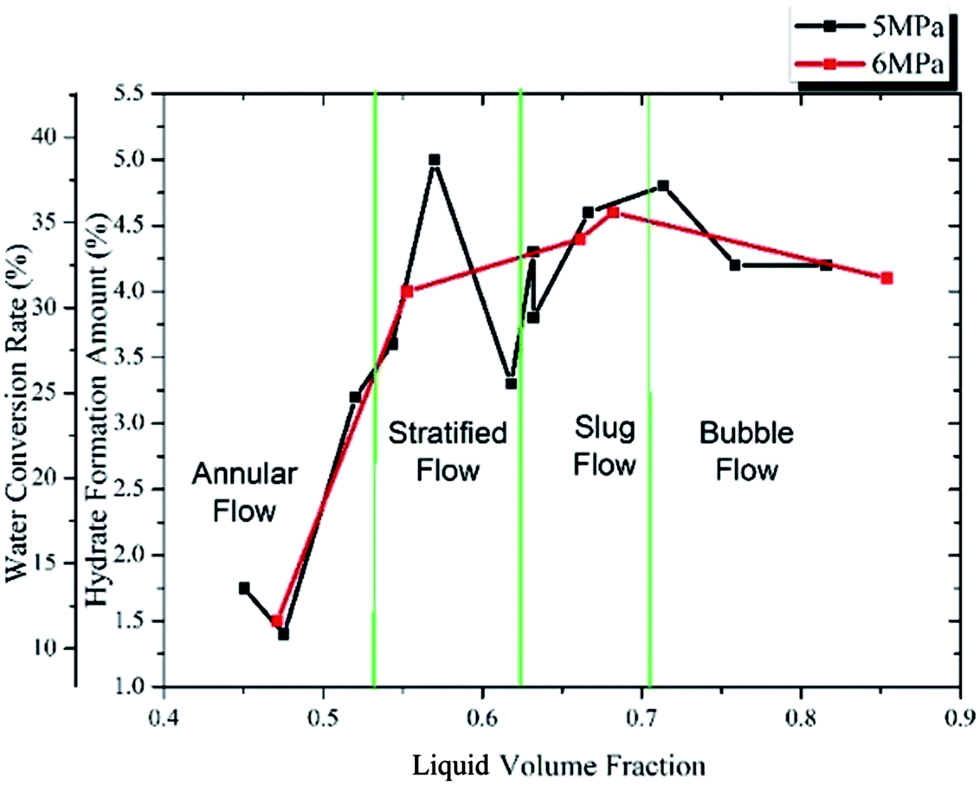 | ||
| Fig. 14 Max hydrate formation amount and water conversion rate with different liquid loading and flow patterns. | ||
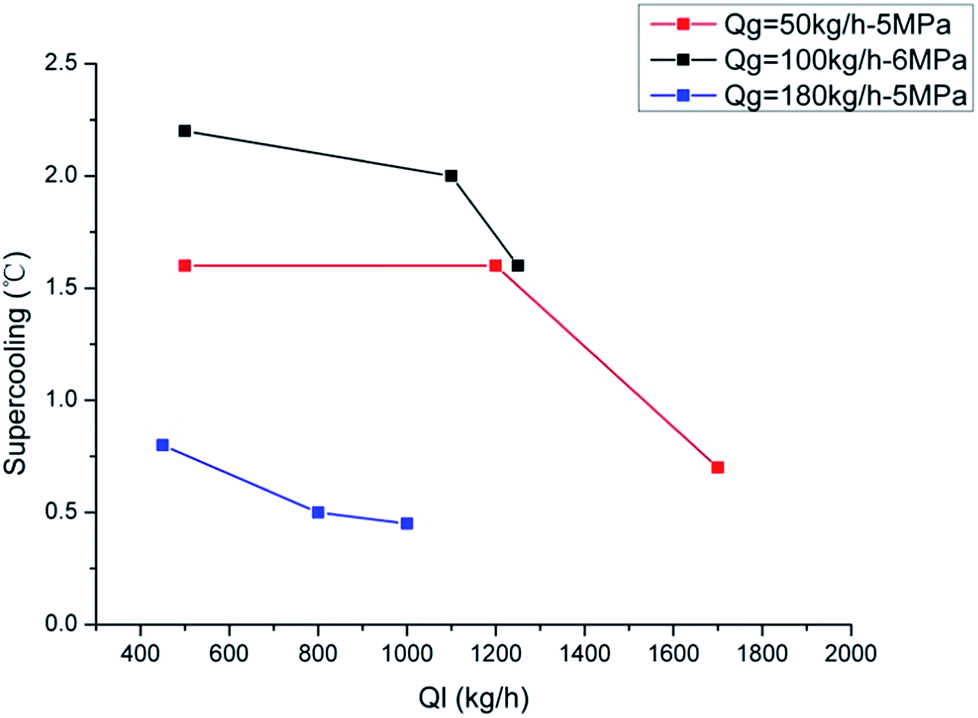
Fig. 12 shows the induction time changing with liquid volume fraction. When the liquid volume fraction is smaller than 33%, the induction time stays at a small value (about 30 min for both 5 MPa and 6 MPa) and changes very little with the liquid volume fraction. When the liquid volume fraction is larger than 33%, the induction time increases to a high value (about 105 min for 5 MPa and 60 min for 6 MPa). Then when the liquid volume fraction is larger than 44%, the induction time goes down to a medium value (50 min for both 5 MPa and 6 MPa). That is, as the liquid volume fraction increases, the induction time increases at first and then decreases to a medium value. The liquid volume fraction causing the longest induction period is about 34% and 40% for 5 MPa and 6 MPa, respectively. In addition, it can be seen that the variation range at 5 MPa is much larger than that at 6 MPa, meaning high pressure can provide a more stable condition for hydrate formation.
Based on the visual confirmation, the liquid volume fraction is divided into four parts by four gas–liquid flow patterns: annular flow, stratified flow, slug flow and bubble flow. It can be seen from Fig. 12 that the induction time in annular flow and stratified flow is approximately equal with a small value. The induction time in bubble flow has as medium value and the longest induction period occurs in slug flow.
Fig. 13 shows the critical supercooling degree changing with different liquid volume fractions. It shows the same tendency with the induction time in Fig. 12. As the liquid volume fraction increases, the critical supercooling degree increases at first and then decreases to a medium value. The max supercooling degree occurs at about 46% for 5 MPa and about 38% for 6 MPa. This indicates that the medium liquid loading (about 40%) calls for the maximum hydrate formation driving force (only for our experimental system).
As shown in Fig. 12 and 13, both the liquid volume fraction and the flow pattern can affect the induction time and critical supercooling degree. On one hand, because hydrates form mainly in the liquid bulk or on the gas–liquid–solid interface, the temperature of the liquid phase is a key factor of hydrate formation kinetics. Low liquid loading (stratified flow and annular flow) leads to a high liquid cooling efficiency, which can shorten the induction period. On the other hand, gas–liquid flow pattern can also influence the hydrate formation process. Different flow patterns have different flow parameters, such as the distribution pattern of the gas and liquid phase, the area of gas–liquid–solid interface, the gas–liquid slip velocity and the flow stability and so on. In the annular flow and stratified flow, the gas–liquid slip velocity is larger, leading to a larger mass transfer coefficient at the gas–liquid interface. Also, there are more gas–liquid–solid interfaces in the annular flow and stratified flow systems. Therefore, the critical supercooling degree is smaller in these two flow patterns. The larger critical supercooling degree in slug flow is probably due to the flow instability, which makes it harder for the hydrate nucleus to form and grow stably. The above results indicate that slug flow condition in pipeline gives a minimum risk of hydrate formation.
Fig. 14 shows the max hydrate formation amount and water conversion rate changing with different liquid volume fraction. It can be seen that when the liquid volume fraction is lower than 15%, the hydrate formation amount and water conversion rate are quite small. This is caused by the fast blockage after the hydrate formation, which is mainly due to the low liquid loading. A low liquid loading stands for a poor liquid carrying capacity, so the loop is easy to be blocked even with a small hydrate formation amount. Then as the liquid volume fraction increases to over 20%, the maximum hydrate formation amount and water conversion rate almost keep constant and change very little with the liquid volume fraction. This means that if the system can keep a good fluid ability, the maximum hydrate formation amount and water conversion rate will not change significantly with the liquid volume fraction.
4 Conclusions
In this work, hydrate formation properties in gas–liquid multiphase flow systems were studied. Influences of the gas/liquid flow rates and liquid hold-up on hydrate formation induction time, supercooling degree and formation amount were analyzed. Also, these parameters were compared in different gas–liquid flow patterns.As the gas flow rate and liquid flow rate increased, the critical supercooling degree of hydrate formation decreased, indicating that the needed driving force for hydrate nucleation was smaller at lager gas/liquid flow rates. Even so, the hydrate formation induction time still increased with the increasing gas/liquid flow rate, which was due to the poor cooling efficiency at higher gas/liquid flow rates. In addition, it was found that the gas/liquid flow rates had little effect on the hydrate formation amount (water conversion rate).
As the liquid hold-up increased from 0 to 0.7, hydrate formation induction time and critical supercooling degree increased first and then decreased. The maximum value occurred at the liquid hold-up of about 0.4 in slug flow. The hydrate formation amount increased first and then kept a constant value with the increasing liquid hold-up and the smallest amount occurred in annular flow condition.
Based on the above results, a larger gas/liquid flow rate and a slug flow condition are recommended in order to extend the induction time and avoid hydrate formation in pipelines. Further study is needed to study hydrate formation in multiphase flow system with different inhibitors, such as thermodynamic inhibitor and kinetic inhibitor and so on.
Conflicts of interest
There are no conflicts to declare.Acknowledgements
The authors wish to thank the National Natural Science Foundation of China (No. 51534007), National Science and Technology Major Project (Nos. 2016ZX05028-004-001, 2016ZX05066005-001), National Key Research and Development Plan (No. 2016YFS0303704), and Science Foundation of China University of Petroleum−Beijing (No. C201602) for financial assistance toward this work.References
- D. Sloan, C. Koh, A. K. Sum, A. L. Ballard, J. Creek, M. Eaton, J. Lachance, N. McMullen, T. Palermo and G. Shoup, Natural Gas Hydrates in Flow Assurance, 2010 Search PubMed.
- S. S. Kakkattu and C. N. Ramachandran, Natural Gas Evolution in a Gas Hydrate Melt: Effect of Thermodynamic Hydrate Inhibitors, J. Phys. Chem. B, 2017, 121(1), 153–163 CrossRef PubMed.
- J. H. Cha, C. Ha, S. P. Kang, J. W. Kang and K. S. Kim, Thermodynamic inhibition of CO 2 hydrate in the presence of morpholinium and piperidinium ionic liquids, Fluid Phase Equilib., 2016, 413, 75–79 CrossRef CAS.
- A. K. Sum, C. A. Koh and E. D. Sloan, A Comprehensive View of Hydrates in Flow Assurance: Past, Present and Future Proceedings of the 8th International Conference on Gas Hydrates, Beijing, 2014 Search PubMed.
- E. D. Sloan and F. Fleyfel, A molecular mechanism for gas hydrate nucleation from ice, AIChE J., 1991, 37(9), 1281–1292 CrossRef CAS.
- B. Mullerbongartz, T. R. Wildeman and R. Sloan Jr, in A Hypothesis For Hydrate Nucleation Phenomena, 1992 Search PubMed.
- P. Skovborg, H. J. Ng, P. Rasmussen and U. Mohn, Measurement of induction times for the formation of methane and ethane gas hydrates, Chem. Eng. Sci., 1993, 48(3), 445–453 CrossRef CAS.
- V. Natarajan, P. R. Bishnoi and N. Kalogerakis, Induction phenomena in gas hydrate nucleation, Chem. Eng. Sci., 1994, 49(13), 2075–2087 CrossRef CAS.
- P. W. Wilson, D. Lester and A. D. J. Haymet, Heterogeneous nucleation of clathrates from supercooled tetrahydrofuran (THF)/water mixtures, and the effect of an added catalyst, Chem. Eng. Sci., 2005, 60(11), 2937–2941 CrossRef CAS.
- M. R. Talaghat, F. Esmaeilzadeh and J. Fathikaljahi, Experimental and Theoretical Investigation of Double Gas Hydrate Formation in the Presence or Absence of Kinetic Inhibitors in a Flow Mini-Loop Apparatus, Fluid Phase Equilib., 2009, 279(279), 28–40 CrossRef CAS.
- M. Sarshar, J. Fathikalajahi and F. Esmaeilzadeh, Kinetic of hydrate formation of propane and its mixture with methane in a circulating flow reactor, Fluid Phase Equilib., 2010, 298(1), 38–44 CrossRef CAS.
- V. K. Saw, I. Ahmad, A. Mandal, G. Udayabhanu and S. Laik, Methane hydrate formation and dissociation in synthetic seawater, J. Nat. Gas Chem., 2012, 21(6), 625–632 CrossRef CAS.
- H. P. Veluswamy and P. Linga, Macroscopic kinetics of hydrate formation of mixed hydrates of hydrogen/tetrahydrofuran for hydrogen storage, Int. J. Hydrogen Energy, 2013, 38(11), 4587–4596 CrossRef CAS.
- H. Kakati, S. Kar, A. Mandal and S. Laik, Methane Hydrate Formation and Dissociation in Oil-in-Water Emulsion, Energy Fuels, 2014, 28(7), 4440–4446 CrossRef CAS.
- O. Fandiño and L. Ruffine, Methane hydrate nucleation and growth from the bulk phase: Further insights into their mechanisms, Fuel, 2014, 117, 442–449 CrossRef.
- H. Najibi, M. M. Shayegan and H. Heidary, Experimental investigation of methane hydrate formation in the presence of copper oxide nanoparticles and SDS, J. Nat. Gas Sci. Eng., 2015, 23, 315–323 CrossRef CAS.
- H. Kakati, A. Mandal and S. Laik, Phase Stability and Kinetics of CH4 + CO2 + N2 Hydrates in Synthetic Seawater and Aqueous Electrolyte Solutions of NaCl and CaCl2, J. Chem. Eng. Data, 2015, 461(1), 97–108 Search PubMed.
- J. L. Peytavy, J. P. Monfort and C. Gaillard, Investigation of Methane Hydrate Formation in a Recirculating Flow Loop: Modeling of the Kinetics and Tests of Efficiency of Chemical Additives on Hydrate Inhibition, Oil Gas Sci. Technol., 1999, 54(3), 365–374 Search PubMed.
- L. Jensen, K. Thomsen and N. V. Solms, Propane hydrate nucleation: experimental investigation and correlation, Chem. Eng. Sci., 2008, 63(12), 3069–3080 CrossRef CAS.
- S. Dai, J. Y. Lee and J. C. Santamarina, Hydrate nucleation in quiescent and dynamic conditions, Fluid Phase Equilib., 2014, 378, 107–112 CrossRef CAS.
- X. F. Lv, B. H. Shi, Y. Wang, Y. X. Tang, L. Y. Wang and J. Gong, Experimental Study on Hydrate Induction Time of Gas-Saturated Water-in-Oil Emulsion using a High-Pressure Flow Loop, Oil Gas Sci. Technol., 2014, 70(6), 253–268 Search PubMed.
- X. Li, C. Chen, Y. Chen, Y. Li and H. Li, Kinetics of Methane Clathrate Hydrate Formation in Water-in-Oil Emulsion, Energy Fuels, 2015, 29(4), 2277–2288 CrossRef CAS.
- S. Douïeb, S. Archambault, L. Fradette, F. Bertrand and B. Haut, Effect of the fluid shear rate on the induction time of CO2-THF hydrate formation, Can. J. Chem. Eng., 2017, 95(1), 187–198 CrossRef.
- J. Chen, Y. F. Wang, C. Y. Sun, F. G. Li, N. Ren, M. L. Jia, K. L. Yan, Y. N. Lv, B. Liu and G. J. Chen, Evaluation of Gas Hydrate Anti-agglomerant Based on Laser Measurement, Energy Fuels, 2015, 29(1), 122–129 CrossRef CAS.
- L. Ding, B. Shi, X. Lv, Y. Liu, H. Wu, W. Wang and J. Gong, Investigation of natural gas hydrate slurry flow properties and flow patterns using a high pressure flow loop, Chem. Eng. Sci., 2016, 146, 199–206 CrossRef CAS.
- E. D. Sloan and C. A. Koh, Clathrate hydrates of natural gases, CRC Press, Boca Raton, FL, 3rd edn, 2008 Search PubMed.
- L. D. Villano and M. A. Kelland, An investigation into the laboratory method for the evaluation of the performance of kinetic hydrate inhibitors using superheated gas hydrates, Chem. Eng. Sci., 2011, 66(9), 1973–1985 CrossRef.
- Y. Salamat, A. Moghadassi, M. Illbeigi, A. Eslamimanesh and A. H. Mohammadi, Experimental study of hydrogen sulfide hydrate formation: induction time in the presence and absence of kinetic inhibitor, J. Nat. Gas Chem., 2013, 22(1), 114–118 CAS.
- A. E. Dukler, Gas-liquid flow in pipelines, American Gas Association, 1969, vol. 1 Search PubMed.
| This journal is © The Royal Society of Chemistry 2017 |