 Open Access Article
Synthesis and characterization of metal–organic frameworks fabricated by microwave-assisted ball milling for adsorptive removal of Congo red from aqueous solutions
Fu-hua Weiab,
Ding Chen *a,
Zhao Lianga,
Shuai-qi Zhaoa and
Yun Luoa
aCollege of Materials Science and Engineering, Hunan University, Hunan, Changsha 410082, PR China. E-mail: ma97chen@hotmail.com
bCollege of Chemistry and Chemical Engineering, Anshun University, Guizhou, Anshun 561000, PR China
First published on 2nd October 2017
Abstract
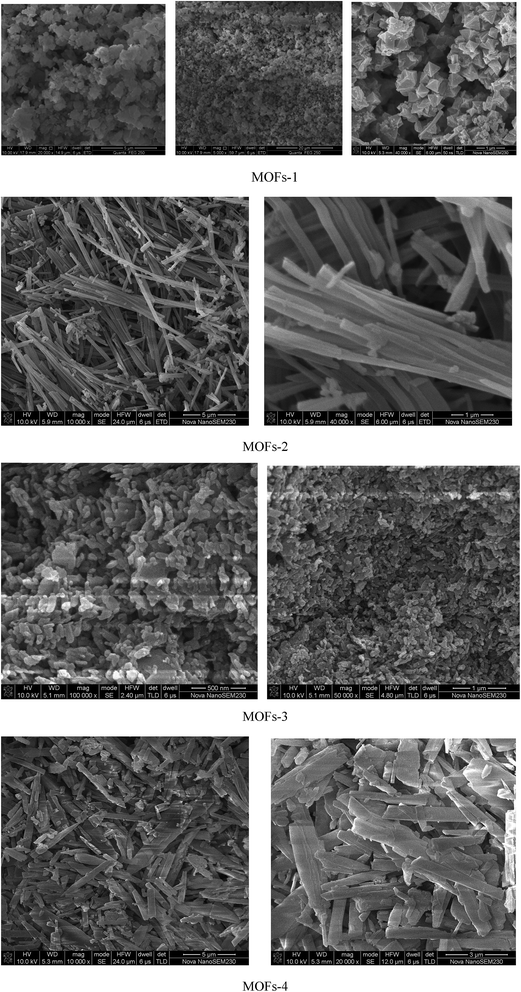
In this study, four metal–organic frameworks (MOFs) were prepared using a simple, low-cost, and high-efficiency technique utilizing simple carboxylic acids (1,3,5-benzenetricarboxylic acid and terephthalic acid) and metal salts (copper(II) acetate tetrahydrate and cobalt(II) acetate tetrahydrate) and microwave-assisted ball milling. The MOFs were characterized by infrared spectrometry, X-ray diffraction, scanning electron microscopy, and thermogravimetry. They were investigated for use as adsorbents for the adsorption of Congo red (CR) from aqueous solutions. The results showed that the adsorption capacity of MOF-2—synthesized from trimesic acid and cobalt(II) acetate tetrahydrate—was the highest, reaching 85.54% after 300 min. Electrostatic and π–π stacking interactions are thought to play an important role in the adsorption of CR onto the MOFs. This MOF material reported in this work demonstrates a superior dye adsorption capacity when compared to other adsorbents.
1. Introduction
Porous materials have come to constitute one of the studied focus areas of chemists, materials scientists, and physicists. Metal–organic frameworks (MOFs), a new class of porous materials, have quickly progressed into a fruitful research field.1–3 In the past twenty years, MOFs have garnered considerable interest as a novel type of functional porous material and have been tested for applications involving energy storage,4,5 adsorption and separation,6,7 catalysis,8,9 drug delivery,10,11 CO2 capture,12,13 chemical sensors,14 and others.15,16 Since their first report, many studies have described the use of MOFs for filtration of wastewater. For instance, in hexavalent chromium reduction, various MOFs including MIL-125(Ti),17 MIL-53(Fe),18 and Zn(Ce)-MOFs19 have been used. MOFs, namely MOF-235![[thin space (1/6-em)]](https://www.rsc.org/images/entities/char_2009.gif) 20 and g-C3N4/MIL-125(Ti),21 have also been utilized for the degradation of organic dyes in wastewater. MOFs are usually synthesized by solvothermal, microwave-assisted, and mechanochemical processes.
20 and g-C3N4/MIL-125(Ti),21 have also been utilized for the degradation of organic dyes in wastewater. MOFs are usually synthesized by solvothermal, microwave-assisted, and mechanochemical processes.
Mechanochemical processes have been long established and their usefulness stems from the capacity to rapidly and quantitatively promote solid-phase reactions using only ball milling or liquid-assisted grinding. In traditional chemical synthesis, the solvent often plays a key role in solvation, transportation, and energy dispersion of chemicals. Energy and mass transport may be reduced in solvent-free reactions. The efficient mixing process under ball milling can overcome this drawback, enabling reactions between solids to take place even under solvent-free conditions.22–24 In mechanochemical procedures, the energy needed for the activation of chemical reactions is usually provided by mechanical force, similarly to how it is provided by light, heat, and electrical potential in photochemistry, thermochemistry, and electrochemistry, respectively. Developments concerning mechanochemical procedures have mostly taken place in the last two decades, and usually focused on their application in synthetic organic chemistry. Recent research efforts have involved exploring the concept of mechanochemistry to obtain advanced materials with a wide range of applications and uses.25–28 In addition to classical organic synthesis, therefore, mechanochemistry has been applied to the synthesis of MOFs,29–31 metal complexes,25,26 and hydrogen storage materials.32
Organic dyes are pollutants, and can include chemicals that are toxic or carcinogenic to mammals and other living organisms.33,34 Dye molecules are often stable and resistant to biodegradation under normal conditions as a result of their complex molecular structures. Therefore, removal of dyes from wastewater by biological or chemical degradation methods can be very challenging. Nevertheless, several groups have explored the possibility of applying polymeric and MOF materials for the removal or degradation of various dye species. For example, Wang et al. have reported four cobalt(II) coordination polymers for the degradative removal of an azo dye Congo red (CR).35 Degradation efficiency of complex 1 or 2 on Congo red ended up to 89 or 98% after 130 min, respectively. Complex 3 or 4 was introduced into the system, only about 56 or 52% of the dye was decolored, respectively. Hu et al. have synthesized a MOF for use in the degradative removal of methyl orange.36 Degradation efficiency can reach 76.1% for 1 within 30 min and reaching up to 92.8% for 1 in 120 min; Cui et al. have prepared two copper(I) cyanide coordination polymers and utilized them for the degradation and removal of methylene blue.37 Photodegradation efficiency (using CP 1 is 90.8% and using CP 2 is 87.2%) for the degradation of methylene blue (MB) under UV light irradiation. Masoomi et al. have synthesized TMU-5 and TMU-6 materials for the degradation and removal of RhB.38 Zhao et al. have reported the synthesis of Ni-MOF/GO, which was applied to the degradation and removal of CR.39 The adsorption capacity of graphene oxide/metal–organic frameworks (GO/MOFs) for CR reached 2489 mg g−1. Racles et al. have synthesized a siloxane-based MOF and applied it to the degradative removal of CR40 etc.
Microwave-assisted ball milling—first reported by our laboratory—is based on a solid–liquid ball milling approach where a ball milling machine is placed in a microwave oven.41–43 This method improves the speed of chemical reactions and alter their routes.44–47 Herein, four MOFs were obtained by microwave-assisted ball milling from trimesic acid, terephthalic acid, Cu(CH3COO)2·H2O, and Co(CH3COO)2·4H2O as the starting materials, and applied successfully for the reduction of aqueous CR.
2. Results and discussion
Preparation of MOFs
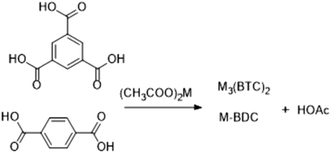
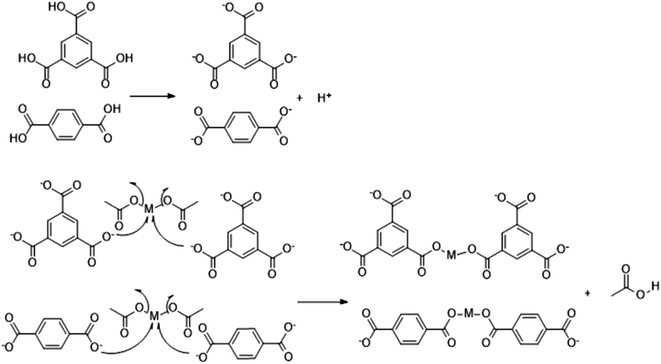
Crystals are most often isolated under microwave-assisted heating because of the fast kinetics of crystal growth and nucleation. Therefore, the greatest challenge with microwave heating is restricting the crystallite size. Crystals of large sizes are usually more difficult to acquire under microwave heating than in typical solvothermal processes. In this work, acid is produced using a post-treatment process according to the following reaction:Under the combined action of microwave irradiation and ball milling that provides mechanical energy, trimesic acid is easily deionized to form a π53 negative ion in aqueous solutions. Cu and Co could each lose two electrons from their s orbital, leading to an empty orbital in each case. The trimesic acid anion can provide electrons to the metal ions and release acetic acid molecules, which react with the metal ions in a proportion of 1![[thin space (1/6-em)]](https://www.rsc.org/images/entities/char_2009.gif) :
:![[thin space (1/6-em)]](https://www.rsc.org/images/entities/char_2009.gif) 1.5 or 1
1.5 or 1![[thin space (1/6-em)]](https://www.rsc.org/images/entities/char_2009.gif) :
:![[thin space (1/6-em)]](https://www.rsc.org/images/entities/char_2009.gif) 1. The specific reaction mechanism has been previously reported.48 The reaction mechanism for the reaction of a metal salt with H3BTC or H2BDC can be described as follows:
1. The specific reaction mechanism has been previously reported.48 The reaction mechanism for the reaction of a metal salt with H3BTC or H2BDC can be described as follows:
Preparation of the MOFs was fast and achieved without the need for an organic solvent, unlike the previously reported preparation of MOFs shown in Table 1.
| MOF | Reagent | Solvent | Temperature (°C) | Time (h) | BET (m2 g−1) | Ref. |
|---|---|---|---|---|---|---|
| MOFs-1 | H3BTC, Cu(OAc)2·H2O | H2O | Room temperature | 0.5 | 32.0708 | This work |
| MOFs-2 | H3BTC, Co(OAc)2·4H2O | 7.7682 | ||||
| MOFs-3 | H2BDC, Cu(OAc)2·H2O | 82.991 | ||||
| MOFs-4 | H2BDC, Co(OAc)2·4H2O | 0.9113 | ||||
| MIL-125(Ti) | H2BDC, Ti(OC4H9)4 | CH3OH, DMF | 150 | 48 | 1548.3 | 17 |
| NH2-MIL-125(Ti) | NH2-BDC, Ti(OC4H9)4 | CH3OH, DMF | 150 | 48 | 1343.9 | 17 |
| MIL-53(Fe) | H2BDC, FeCl3·6H2O | DMF | 150 | 15 | — | 18 |
| HUT-091 | H3BTC, Ce(NO3)3·6H2O | 170 | 240 | — | 19 | |
| MIL-68(In) | H2BDC, In(NO3)3·xH2O | DMF | 100 | 48 | 681.4 | 55 |
| [Co(L1)(bpdc)]n | 1,4-Bis(5,6-dimethylbenzimidazol-1-ylmethyl)benzene, H2bpdc, CoCl2·6H2O | H2O | 140 | 36 | 0.912 | 35 |
| {[Co(L1)(npht)]·0.5H2O}n | 1,4-Bis(5,6-dimethylbenzimidazol-1-ylmethyl)benzene, H2npht, CoCl2·6H2O | 0.783 | ||||
| [Co(L2)(bpdc)]n | 1,3-Bis(5,6-dimethylbenzimidazol-1-ylmethyl)benzene, H2bpdc, CoCl2·6H2O | 0.852 | ||||
| [Co(L3)(bpdc)(H2O)]n | 1,1′-Bis(5,6-dimethylbenzimidazole)methane, H2bpdc, CoCl2·6H2O | 0.813 |
Structure characterization
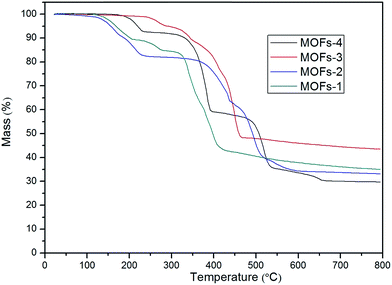
For MOF-2: the first mass loss (16.5%) area between 100 °C and 223 °C indicated the loss of moisture; the area between 223 °C and 366 °C with a slow loss of 3.3% mass was related to the oxidation of Co2+; the third region starting at 366 °C represented again the temperature at which the structure of the MOF collapsed and the organic linker was fractured. The loss of mass was deemed as complete at 366 °C, after which the MOF remained stable up to 800 °C. The residue measured at this temperature was 33.17% of the original mass.
For MOF-3: the first mass loss (7.63%) area between 74 °C and 330 °C indicated the loss of moisture and oxidation52 of Cu2+; the third region started at 330 °C, a temperature at which the structure of the MOF collapsed and the organic linker was fractured. This loss of mass was completed by 330 °C and the MOF was stable up to 800 °C. The final residue was 43.5% of the original mass.
For MOF-4: the first mass loss (7%) area between 152 °C and 229 °C indicated the loss of moisture; the area between 229 °C and 346 °C with a slow mass loss of 5.6% was related to the loss of water from the MOF together with the oxidation of Co2+; the third region started at 346 °C, a temperature at which the structure of the MOF collapsed and the organic linker was fractured. This loss of mass was completed by 346 °C and the MOF remained stable up to 800 °C. The final residue represented 29.7% of the original mass.
Removal of Congo red
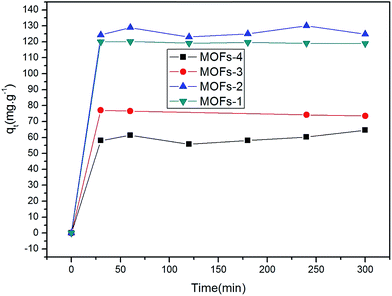
The specific surface areas of MOFs-1–4 were determined to be 32.0708 m2 g−1, 7.7682 m2 g−1, 82.9910 m2 g−1, and 0.9113 m2 g−1, respectively, as shown Table 1, using the nitrogen adsorption isotherms. The adsorption performance of the four MOFs toward CR was studied. Fig. 5 shows the adsorbed quantities (qt) of CR on the MOFs as a function of time t, as determined using the following equations:| qt = (C0 − Ct)V/m | (1) |
| qe = (C0 − Ce)V/m | (2) |
As seen in Fig. 5, initially, the adsorption capacities of the MOFs for CR increased rapidly and then gradually decreased until the adsorption equilibria were attained upon prolonged contact. The qe values of the four MOFs for CR were quite different. Specifically, these values were 129.95, 120.15, 77.05, and 64.56 mg g−1 for MOF-2, MOF-1, MOF-3, and MOF-4, respectively. Clearly, the different results were arising due to the introduction of different organic ligands and metal ions. The electron energy arrangements of Cu and Co are 3d9 4s2 and 3d7 4s2, respectively. For these metals, the loss of two electrons from their s orbital gives rise to an empty orbital in each case. Different metal ions and different organic ligands have different spatial structures, resulting in different adsorption results.
It is possible that the original concentrations of CR were sufficiently high to provide the driving force to surpass the resistance of mass transfer between the liquidoid and the solidoid.53
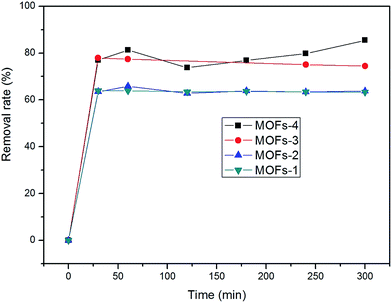
The adsorption isotherms were acquired after adsorption for 5 h. The adsorption capacities of the MOFs under investigation in the removal of CR were in the following order: MOF-4 > MOF-3 > MOF-2 > MOF-1 (as shown in Fig. 6). The maximum adsorption of CR was 85.45% after 300 min, determined for MOF-2 in natural light.
Kinetics for the adsorption of Congo red by MOFs
The adsorption capacity was obtained to study the kinetics of adsorption of CR by the prepared MOFs. The adsorption model that describes the adsorption of a solute onto a solid surface can be expressed as:where k1 is the apparent pseudo-first-order rate constant (min−1), qt is the adsorption capacity at time t (mg g−1), and qe is the adsorption capacity at equilibrium (mg g−1).
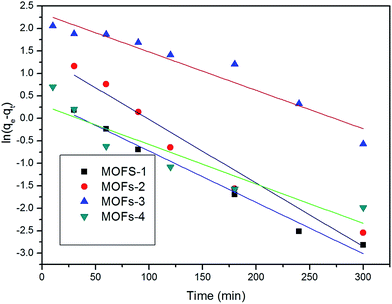
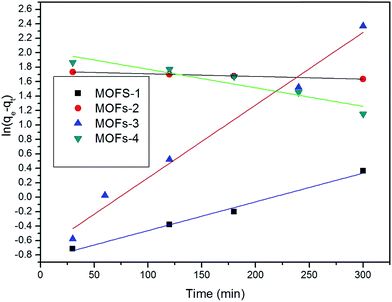
The applicability of the pseudo-first-order kinetic model to the adsorption of CR by MOFs was tested by fitting of the experimental data to the model via the application of the least squares regression analysis (as shown in Fig. 8 and 9). The analysis revealed a ratio of 1![[thin space (1/6-em)]](https://www.rsc.org/images/entities/char_2009.gif) :
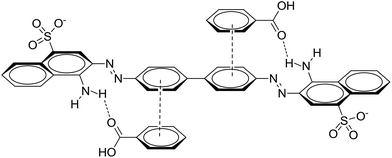
:![[thin space (1/6-em)]](https://www.rsc.org/images/entities/char_2009.gif) 2 for the quantity of the MOF to the volume of the dye that afforded a suitable description of the adsorption process, as shown in Table 2. This result indicates that the investigated MOFs are excellent materials for the removal of CR. CR is a cationic dye that exists in the form of positively charged ions in aqueous solutions (as shown in Fig. 7). The CR adsorption may not only result from simple physical adsorption and chemical adsorption but also form the conjugation between CR and MOFs. CR contains C
2 for the quantity of the MOF to the volume of the dye that afforded a suitable description of the adsorption process, as shown in Table 2. This result indicates that the investigated MOFs are excellent materials for the removal of CR. CR is a cationic dye that exists in the form of positively charged ions in aqueous solutions (as shown in Fig. 7). The CR adsorption may not only result from simple physical adsorption and chemical adsorption but also form the conjugation between CR and MOFs. CR contains C![[double bond, length as m-dash]](https://www.rsc.org/images/entities/char_e001.gif) C double bonds and π electrons, and these π electrons can easily interact with the π electrons present on the benzene rings of the MOFs through π–π interactions. CR could be adsorbed on the MOF surface with a face-to-face orientation by π–π conjugation until an adsorption–desorption equilibrium is achieved. The Zeta potential characterization showed that the adsorbents were charged, as shown in Table 3. Therefore, electrostatic forces are also beneficial for the adsorption of CR by the MOFs.54
C double bonds and π electrons, and these π electrons can easily interact with the π electrons present on the benzene rings of the MOFs through π–π interactions. CR could be adsorbed on the MOF surface with a face-to-face orientation by π–π conjugation until an adsorption–desorption equilibrium is achieved. The Zeta potential characterization showed that the adsorbents were charged, as shown in Table 3. Therefore, electrostatic forces are also beneficial for the adsorption of CR by the MOFs.54
| Mass of MOFs (200 mg) | Mass of MOFs (100 mg) | |||
|---|---|---|---|---|
| k | R2 | k | R2 | |
| MOFs-1 | −0.01143 | 0.98408 | 0.00398 | 0.98814 |
| MOFs-2 | −0.01414 | 0.94257 | −0.000364926 | 0.9986 |
| MOFs-3 | −0.00855 | 0.92131 | 0.01007 | 0.9803 |
| MOFs-4 | −0.00878 | 0.82756 | −0.00257 | 0.86008 |
| MOFs-1 | MOFs-2 | MOFs-3 | MOFs-4 | |
|---|---|---|---|---|
| Zeta potentials (mV) | 208 | 413 | 316 | 339 |
3. Experimental
Materials
All materials were obtained from commercial suppliers and were used without further purification. 1,3,5-Benzenetricarboxylic acid (trimesic acid, C9H6O6, H3BTC, 98%) and copper(II) acetate tetrahydrate (Cu(CH3COO)2·4H2O, ≥99.0%) were purchased from Aladdin Biological Technology Co., Ltd., Shanghai, China. Terephthalic acid (C8H6O4, H2BDC, 99%) and cobalt(II) acetate tetrahydrate (Co(CH3COO)2·4H2O, ≥99.5%) were purchased from Sinopharm Chemical Reagent Co., Ltd., Shanghai, China. Congo red (CR) was purchased from Aladdin Biological Technology Co., Ltd., Shanghai, China. Trimesic acid and terephthalic acid were used as organic linkers. Copper(II) acetate tetrahydrate and cobalt(II) acetate tetrahydrate were used as the metal ion sources in the synthesis of MOFs.Synthesis of MOFs
Characterization of MOFs
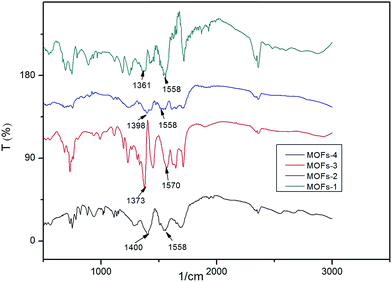
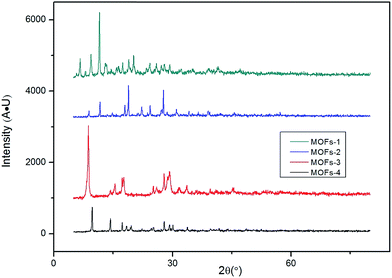
Structural and morphological characterizations were performed by XRD (D-5000, Siemens, Cu Kα), FTIR spectroscopy (IRTracer-100; Shimadzu), and field-emission SEM (FESEM, JSM-6700F, Japan). Thermogravimetry (TG) curves of samples were recorded by a NETZSCH STA 449C thermal analyzer (Germany) in Ar atmosphere in the range from 0 °C to 800 °C at a heating rate of 5 °C min−1.Removal of Congo red
Removal of Congo red was conducted at room temperature (∼25 °C) in a 250 mL beaker. 50 mg of a MOF sample was added to 200 mL of an organic dye solution (∼50 mg L−1), under natural light and magnetic stirring; every 10 to 30 min, a 10 mL aliquot of the sample was analyzed by ultraviolet spectrometry (UV-2550, 220 V, Shimadzu Instruments (Suzhou) Co., Ltd.). The removal rate was calculated by C = (C0 − Ct)/C0 × 100%, where C0 is the initial concentration and Ct is the concentration of after t minute.4. Conclusions
In summary, the microwave-assisted ball milling approach was exploited successfully for the effective and reliable synthesis of four robust metal–organic frameworks, namely MOFs-1–4, in aqueous solutions, whose structures were confirmed by FTIR, XRD, SEM, and TGA. The MOFs showed good capacity to adsorb CR, and could therefore be employed for the removal of CR from wastewater in the future. MOF-2—prepared from trimesic acid and cobalt(II) acetate tetrahydrate—exhibited the highest adsorption capacity for the removal of CR. These results demonstrate that the microwave-assisted ball milling process is an effective method for fast and simple preparation of MOFs for practical applications.Conflicts of interest
There are no conflicts to declare.Acknowledgements
The project was supported by Hunan Provincial Natural Science Foundation of China (14JJ1013) and the Joint Funds of Science and Technology Department of Guizhou Province with People's Government of Anshun City and Anshun University (LH [2016]7268).References
- S. T. Meek, J. A. Greathouse and M. D. Allendorf, Adv. Mater., 2011, 23, 249 CrossRef CAS PubMed.
- S. Natarajan and P. Mahata, Chem. Soc. Rev., 2009, 38, 2304 RSC.
- J. R. Long and O. M. Yaghi, Chem. Soc. Rev., 2009, 38, 1213 RSC.
- W. Xia, A. Mahmood, R. Q. Zou and Q. Xu, Energy Environ. Sci., 2015, 8, 1837 CAS.
- L. Wang, Y. Z. Han, X. Feng, J. W. Zhou, P. F. Qi and B. Wang, Coord. Chem. Rev., 2016, 307, 361 CrossRef CAS.
- B. Van de Voorde, B. Bueken, J. Denayer and D. De Vos, Chem. Soc. Rev., 2014, 43, 5766–5788 RSC.
- J. R. Li, R. J. Kuppler and H.-C. Zhou, Chem. Soc. Rev., 2009, 38, 1477 RSC.
- C. C. Wang, J. R. Li, X. L. Lv, Y. Q. Zhang and G. S. Guo, Energy Environ. Sci., 2014, 7, 2831 CAS.
- J. Lee, O. K. Farha, J. Roverts, K. A. Schedit, S. T. Nguyen and J. T. Hupp, Chem. Soc. Rev., 2009, 38, 1450 RSC.
- J. Della Rocca, D. M. Liu and W. B. Lin, Acc. Chem. Res., 2011, 44, 957 CrossRef CAS PubMed.
- C. Y. Sun, C. Qin, X. L. Wang and Z. M. Su, Expert Opin. Drug Delivery, 2013, 10, 89 CrossRef CAS PubMed.
- A. R. Millward and O. M. Yaghi, J. Am. Chem. Soc., 2005, 127, 17998 CrossRef CAS PubMed.
- K. Sumida, D. L. Rogow, J. A. Mason, T. M. McDonald, E. D. Bloch, Z. R. Herm, T. H. Bae and J. R. Long, Chem. Rev., 2012, 112, 724 CrossRef CAS PubMed.
- L. E. Kreno, K. Leong, O. K. Farha, M. Allendorf, R. P. Van Duyne and J. T. Hupp, Chem. Rev., 2012, 112, 1105 CrossRef CAS PubMed.
- H. Furukawa, K. E. Cordova, M. O'Keeffe and O. M. Yaghi, Science, 2013, 341, 974 CrossRef CAS PubMed.
- E. Barea, C. Montoro and J. A. R. Navarro, Chem. Soc. Rev., 2014, 43, 5419 RSC.
- H. Wang, X. Z. Yuan, Y. Wu, G. M. Zeng, X. H. Chen, L. J. Leng, Z. B. Wu, L. B. Jiang and H. Li, J. Hazard. Mater., 2015, 286, 187 CrossRef CAS PubMed.
- R. W. Liang, F. F. Jing, L. J. Shen, N. Qin and L. Wu, J. Hazard. Mater., 2015, 287, 364 CrossRef CAS PubMed.
- Q. Q. Xu, H. J. Fan, Y. T. Li, K. E. Christensen and T. Z. Ren, Polyhedron, 2015, 92, 60 CrossRef CAS.
- E. Haque, J. W. Jun and S. H. Jhung, J. Hazard. Mater., 2011, 185, 507 CrossRef CAS PubMed.
- H. Wang, Appl. Catal., B, 2015, 174–175, 445 CrossRef CAS.
- N. A. P. Martins, C. P. Frizzo, D. N. Moreira, L. Buriol and P. Machado, Chem. Rev., 2009, 109, 4140 CrossRef PubMed.
- B. Rodriguez, A. Bruckmann, T. Rantanen and C. Bolm, Adv. Synth. Catal., 2007, 349, 2213 CrossRef CAS.
- K. Tanaka, Solvent-free Organic Synthesis, Wiley-VCH, Weinheim, 2nd edn, 2008 Search PubMed.
- V. Sepelak, A. Düvel, M. Wilkening, K. D. Becker and P. Heitjans, Chem. Soc. Rev., 2013, 42, 7507 RSC.
- A. L. Garay, A. Pichon and S. L. James, Chem. Soc. Rev., 2007, 36, 846 RSC.
- P. Balaz, M. Achimovicova, M. Balaz, P. Billik, Z. Cherkezova-Zheleva, J. M. Criado, F. Delogu, E. Dutkova, E. Gaffet, F. J. Gotor, R. Kumar, I. Mitov, T. Rojac, M. Senna, A. Streletskii and K. Wieczorek-Ciurowa, Chem. Soc. Rev., 2013, 42, 7571 RSC.
- S. L. James, C. J. Adams, C. Bolm, D. Braga, P. Collier, T. Friscic, F. Grepioni, K. D. M. Harris, G. Hyett, W. Jones, A. Krebs, J. Mack, L. Maini, A. G. Orpen, I. P. Parkin, W. C. Shearouse, J. W.Steed and D. C. Waddelli, Chem. Soc. Rev., 2012, 41, 413 RSC.
- T. Friscic, Chem. Soc. Rev., 2012, 41, 3493 RSC.
- A. Pichon and S. L. James, CrystEngComm, 2008, 10, 1839 RSC.
- W. Yuan, T. Friscic, D. Apperley and S. L. James, Angew. Chem., Int. Ed., 2010, 49, 3916 CrossRef CAS PubMed.
- J. Huot, D. B. Ravnsb, J. Zhang, F. Cuevas, M. Latroche and T. R. Jensen, Prog. Mater. Sci., 2013, 58, 30 CrossRef CAS.
- P. Niu and J. Hao, Langmuir, 2011, 27, 13590 CrossRef CAS PubMed.
- S. Pal, S. Ghorai, C. Das, S. Samrat, A. Ghosh and A. B. Panda, Ind. Eng. Chem. Res., 2012, 51, 15546 CrossRef CAS.
- X. X. Wang, B. y. Yu, K. V. Hecke and G. H. Cui, RSC Adv., 2014, 4, 61281 RSC.
- J. M. Hu, V. A. Blatov, B. y. Yu, K. V. Hecke and G. H. Cui, Dalton Trans., 2016, 45, 2426 RSC.
- J. W. Cui, W. J. An, K. V. Hecke and G. H. Cui, Dalton Trans., 2016, 45, 17474 RSC.
- M. Y. Masoomi, M. Bagheri and A. Morsali, Ultrason. Sonochem., 2016, 33, 60 CrossRef PubMed.
- S. Q. Zhao, D. Chen, F. H. Wei, N. N. Chen, Z. Liang and Y. Luo, Ultrason. Sonochem., 2017, 39, 845 CrossRef CAS PubMed.
- C. Racles, M.-F. Zaltariov, M. Iacob, M. Silion, M. Avadanei and A. Bargan, Appl. Catal., B, 2017, 205, 78 CrossRef CAS.
- B. Y. Chen, D. Chen, Z. T. Kang and Y. Z. Zhang, J. Alloys Compd., 2015, 618, 222 CrossRef CAS.
- D. Chen, Y. Z. Zhang and Z. T. Kang, Chem. Eng. J., 2013, 215, 235 CrossRef.
- D. Chen, Y. Z. Zhang and C. J. Tu, Mater. Lett., 2012, 82, 10 CrossRef CAS.
- D. Chen, Y. Z. Zhang, B. Y. Chen and Z. T. Kang, Ind. Eng. Chem. Res., 2013, 52, 14179 CrossRef CAS.
- G. Chen, Z. Song, J. Chen and J. H. Peng, J. Alloys Compd., 2013, 579, 612 CrossRef CAS.
- Y. Z. Zhang, Z. T. Kang and D. Chen, Mater. Lett., 2014, 133, 259 CrossRef CAS.
- G. Chen, J. Alloys Compd., 2015, 651, 503 CrossRef CAS.
- ed. R. H. Crabtree, The Organometallic Chemistry of the Transition Metals, 5th edn, 2012, p. 148 Search PubMed.
- ed. H.-w. Zhu, Spectral analysis of organic molecular structure, Chemical Industry Press, Beijing, 2010, p. 54 Search PubMed.
- A. Alec Talin, A. Centrone, A. C. Ford, M. E. Foster, V. Stavila, P. Haney, R. Adam Kinney, V. Szalai, F. El Gabaly, H. P. Yoon, F. Léonard and M. D. Allendorf, Science, 2014, 343, 66 CrossRef PubMed.
- N. Stock and S. Biswas, Chem. Rev., 2012, 112, 933 CrossRef CAS PubMed.
- X. Zhao, S. Liu, Z. Tang, H. Niu, Y. Cai, W. Meng, F. Wu and J. P. Giesy, Sci. Rep., 2015, 5, 11849 CrossRef PubMed.
- C. Li, Z. Xiong, J. Zhang and C. Wu, J. Chem. Eng. Data, 2015, 60, 3414 CrossRef CAS.
- T. Wu, X. Cai, S. Tan, H. Li, J. Liu and W. Yang, Chem. Eng. J., 2011, 173, 144 CrossRef CAS.
- R. Liang, L. Shen, F. Jing, W. Wu, N. Qin, R. Lin and L. Wu, Appl. Catal., B, 2015, 162, 245 CrossRef CAS.
| This journal is © The Royal Society of Chemistry 2017 |

