 Open Access Article
Improvement of NO2 sensing characteristic for mixed potential type gas sensor based on YSZ and Rh/Co3V2O8 sensing electrode
Jing Wang,
Zhangduo Yu,
Lian Wang,
Bin Wang,
Fangmeng Liu*,
Xishuang Liang,
Peng Sun,
Xu Yan ,
Xiaohong Chuai and
Geyu Lu
 *
*
State Key Laboratory on Integrated Optoelectronics, College of Electronic Science and Engineering, Jilin University, 2699 Qianjin Street, Changchun 130012, China. E-mail: lfm198705@126.com; lugy@jlu.edu.cn; Fax: +86-431-85167808; Tel: +86-431-85167808
First published on 24th October 2017
Abstract
The NO2 sensing performance of a stabilized zirconia (YSZ)-based mixed potential type gas sensor utilizing a Co3V2O8 sensing electrode (SE) was improved by the addition of a noble metal. Among the different types of noble metal (Au, Pt, Pd and Rh), the sensor attached with Co3V2O8-SE loaded with Rh exhibited a noticeable improvement in NO2 response and the maximum response value was obtained when the loading mass fraction of Rh was 3 wt%. Results showed that the response for the sensor utilizing 3 wt% Rh/Co3V2O8-SE was 113.5 mV to 50 ppm NO2 and the sensitivity to 10–300 ppm NO2 was 85 mV per decade at the operating temperature of 650 °C, which were enhanced by 77.5 mV and 39 mV per decade compared to those of a sensor attached with Co3V2O8-SE, respectively. It is noteworthy that the response for each of sensor displayed a good linear relationship to the logarithm of NO2 concentration in the ranges of 10–300 ppm at 650 °C. Additionally, the sensor attached with 3 wt% Rh/Co3V2O8-SE also exhibited a low detection limit of 500 ppb and good selectivity to NO2 at 650 °C. The improvement of sensing characteristics for a sensor using 3 wt% Rh/Co3V2O8-SE may be attributed to enhanced electrochemical catalytic reaction activity to NO2 and a mixed potential mechanism was further verified by polarization curve.
1. Introduction
Increasing NO2 emission from automotive vehicles has caused serious environmental pollution problems, such as photochemical smog and acid rain.1 Thus, an on-board gas sensor was urgently needed to more accurately and efficiently monitor NO2 in the lean burn gasoline or diesel engines. The automobile exhaust gas after treatment system has the harsh conditions of high temperature, high humidity and coexistence of multiple gases. Fortunately, the solid state mixed potential type gas sensor based on stabilized zirconia (YSZ) and a metal oxide sensing electrode (SE) was capable of withstanding such a hostile environment and these have been developed and reported widely by researchers.According to the mixed potential sensing mechanism,2–5 the electrochemical cathodic reaction of NO2 (1) and the electro-chemical anodic reaction of oxygen (2) occured simultaneously at the triple phase boundary (TPB, SE/electrolyte/target gas) of SE and mixed potential obtained at the SE when the rates of the cathodic and anodic reactions are equal to each other. The enhanced NO2 sensing property was related to the types of sensing electrode material. Up to now, many single and composite oxide materials2,6–10 were developed and used for fabricating YSZ-based mixed potential type NO2 sensor. Among the reported devices, some sensors still had room for improvement of sensing characteristics and some strategies have been performed to further enhance the sensing performance of the sensor. Lu et al.11 improved the response and sensitivity of the sensor attached with In2O3-SE by doping different amount of MoO3 to In2O3. Miura et al.12,13 reported that addition of noble metal Pt to ZnFe2O4 was found to improve the sensing characteristics towards quick response and addition of Pt to In2O3 gave considerable improvement in selectivity. Enlightened by above strategies, the addition of small amounts of noble metal Rh to Co3V2O8-SE was used to improve the sensing performance of mixed potential type NO2 sensor.
Cathodic reaction:
| NO2 + 2e− → NO + O2− | (1) |
Anodic reaction:
| O2− → 1/2O2 + 2e− | (2) |
Herein, the mixed potential type sensor based on YSZ and Co3V2O8-SE loaded with noble metals was developed to enhance the NO2 sensing performance at high temperature. The effect of types of noble metal and the amounts of Rh on the NO2 sensing performance were investigated detailed. The reason for improvement of NO2 sensing performance and sensing mechanism were discussed.
2. Experimental
2.1 Synthesis and characterization of sensing electrode material
The Co3V2O8 was synthesized by a facile sol–gel method according to previous work.14 The Co3V2O8 loaded with different mass percentages (0 wt%, 1 wt%, 3 wt%, 5 wt% and 7 wt%) of Rh sensing electrode materials were prepared from Co3V2O8 and stoichiometric RhCl3 solution with sodium borohydride (NaBH4) as the reductant. The Co3V2O8 loaded with other types of noble metal (Au, Pt and Pd) sensing materials were prepared with the same method according to above-described procedure, respectively.X-ray diffraction (XRD) patterns of sensing electrode materials obtained were characterized by Rigaku wide-angle X-ray diffractometer (D/max rA, using Cu Kα radiation at wave length = 0.1541 nm) in the angular range of 10–80°. Field-emission scanning electron microscopy (FESEM) observations of surface morphology of sensing electrodes were measured using a JEOL JSM-6500F microscope with an accelerating voltage of 15 kV. X-ray photoelectron spectroscopy (XPS) measurements were performed on a Thermo ESCALAB250 spectrometer equipped with an Al-Kα ray source.
2.2 Fabrication and measurement of gas sensor
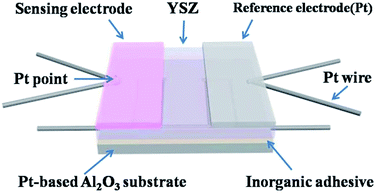
As previously reported procedure,15 the sensors were fabricated using YSZ plate (8 mol% Y2O3-doped, 2 mm × 2 mm square, 0.3 mm thickness, provided by Anpeisheng Corp., China) and the Co3V2O8-SE loaded with different types of noble metal or different weight percentages of Rh, respectively. The sensors attached with Co3V2O8-SE loaded with 0 wt%, 1 wt%, 3 wt%, 5 wt% and 7 wt% Rh were labeled as S0, S1, S3, S5 and S7, respectively and the schematic diagram of developed sensor was showed in Fig. 1. The gas sensing performances of the fabricated sensors were measured by a conventional static method.16,17 The current–voltage (polarization) curves of sensors were carried out according to the potentiodynamic method (CHI600C, Instrument corporation of Shanghai, China) using a two-electrode configuration in air and NO2 gas at 650 °C.3. Results and discussion
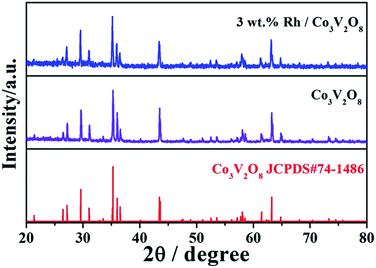
Fig. 2 displays XRD patterns of Co3V2O8 and 3 wt% Rh/Co3V2O8 sensing electrode materials. All diffraction peaks of Co3V2O8 were readily indexed to orthorhombic structure of Co3V2O8 composite oxide, which agreed well with the standard XRD card (JCPDS#74-1486). No impurity phases were observed in the pattern, which suggests the high purity of material. However, no obvious Rh-related diffraction peaks were found in the XRD pattern of 3 wt% Rh/Co3V2O8 sensing material, which maybe due to the small amount of Rh or the incomplete crystallinity induced by lower sintering temperature of sensing material.The surface morphology of 3 wt% Rh/Co3V2O8 sensing electrode was characterized by FESEM and the corresponding result is shown in Fig. 3(a). It can be clearly seen that the sensing material was composed of micron-scale particle and porous structure, which was contributed to diffusion of the gas molecular within the sensing electrode layer. The EDS mapping image of 3 wt% Rh/Co3V2O8 sensing electrode was measured and used to observe the existence and distribution of Rh element, as exhibited in Fig. 3(b). Obviously, the EDS mapping measurement of 3 wt% Rh/Co3V2O8 sensing electrode confirmed the existence and homogeneous distribution of Rh element.
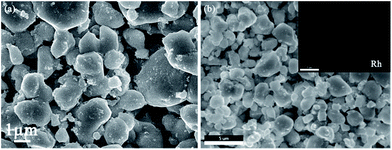 | ||
| Fig. 3 (a) SEM image of 3 wt% Rh/Co3V2O8 sensing electrode; (b) EDS mapping image of 3 wt% Rh/Co3V2O8. | ||
To further determinate the surface compositions and chemical states of the prepared 3 wt% Rh/Co3V2O8 sensing material, XPS measurement was performed. Fig. 4(a) shows the high resolution Co 2p spectrum of sensing material. The binding energy peak positions at around 797.2 and 781.4 eV could be assigned to Co 2p1/2 and Co 2p3/2. And the binding energy width equal to 15.8 eV between the main signals of the Co 2p1/2 and Co 2p3/2 doublet corresponded to Co2+.18–20 Moreover, the spectrum peak displayed satellites at each of high-energy sides, which could be traced back to the shake-up process.21 Such signals further confirmed the presence of Co2+ at the surface of 3 wt% Rh/Co3V2O8.22 In Fig. 4(b), the spectrum can be deconvoluted to two distinct diffraction peaks at 524.3 and 516.8 eV, which could be related to V 2p1/2 and V 2p3/2, respectively.23 The binding energy width of V 2p was equal to 7.5 eV, which can be confirmed V5+ valence state.24 Additionally, the O 1s spectrum was asymmetric and could be fitted into two peaks (Fig. 4(c)). The binding energy peaks positioned at around 531.8 and 530.3 eV were attributed to oxygen species related to the adsorbed water molecules (H2Oads) and typical lattice oxygen in the surface of Co3V2O8 sensing material, respectively.25 The Rh-related binding energy peak in 3 wt% Rh/Co3V2O8 sensing material was also observed and diffraction peaks located at 309.2 and 314.1 eV were assigned to Rh 3d5/2 and Rh 3d3/2 of Rh3+, respectively, rather than the metal phase Rh0 (ref. 26 and 27) (Fig. 4(d)).
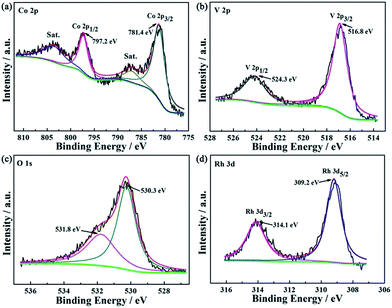 | ||
| Fig. 4 XPS spectra of 3 wt% Rh/Co3V2O8 sensing electrode material (a) Co 2p; (b) V 2p; (c) O 1s and (d) Rh 3d. | ||
The response values of sensors attached with Co3V2O8-SE loaded with different types of noble metals (Rh, Pd, Au and Pt) to 100 ppm NO2 at 650 °C were measured and demonstrated in Fig. 5. Apparently, the sensor utilizing Co3V2O8-SE loaded with Rh displayed the highest response value to 100 ppm NO2 at 650 °C, compared with the devices attached with Co3V2O8-SE loaded with other noble metals. Therefore, the detailed sensing characteristics of the sensor using Co3V2O8-SE loaded with Rh were paid considerable attentions to investigate in the next work. In order to study the effect of different weight fractions of Rh in Co3V2O8-SE on NO2 sensing property and determinate the optimal Rh loading amount, the response of the sensor attached with Co3V2O8-SE loaded with different weight fractions of Rh to 50 ppm NO2 at 650 °C was investigated and depicted in Fig. 6. It can be clearly observed that the response value of the sensor exhibited a “peak” shape with a trend of “increase-maximum-decrease” to 50 ppm NO2 with the increase of loading weight fraction of Rh in the range of 0–7 wt% and the highest response value was obtained when the loading weight fraction of Rh was 3 wt%.
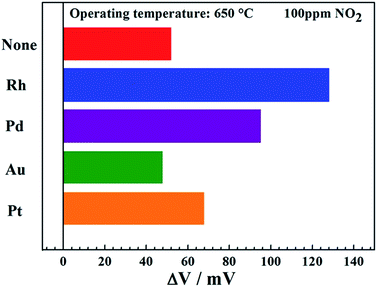 | ||
| Fig. 5 Response values of sensors attached with Co3V2O8-SE loaded with different types of noble metals to 100 ppm NO2 at 650 °C. | ||
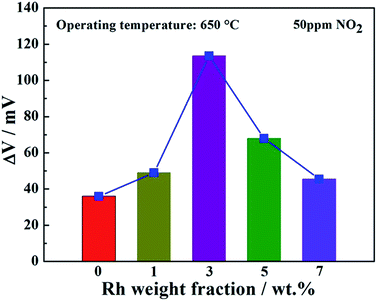 | ||
| Fig. 6 Responses of the sensor attached with Co3V2O8-SE loaded with different weight fractions of Rh to 50 ppm NO2 at 650 °C. | ||
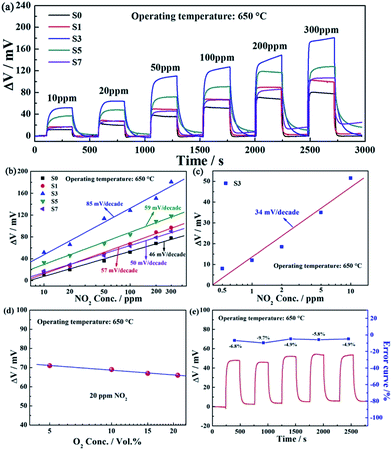
Fig. 7(a) shows the response transients for sensors S0–S7 toward different concentrations of NO2 in the range of 10–300 ppm at 650 °C. The responses of the sensor S3 to every concentrations of NO2 in the range of 10–300 ppm were higher than those of sensor S0, S1, S5 and S7. The response value of the sensor S3 to 50 ppm NO2 was 113.5 mV at 650 °C, which was approximately 3.15, 2.32, 1.67 and 2.50 times higher than those of sensor S0, S1, S5 and S7, respectively. The dependence of ΔV on the logarithm of NO2 concentrations for sensors S0–S7 at 650 °C is displayed in Fig. 7(b). It was revealed that ΔV for the sensors S0–S7 and the logarithm of NO2 concentration in the range of 10–300 ppm at 650 °C almost showed a linear relationship, which conformed to the mixed potential type model.5,10 The sensitivity of the sensor S3 to 10–300 ppm NO2 was 85 mV per decade, which was 39 mV per decade higher than that of sensor S0. The comparison of NO2 sensing performances for the sensor S3 and those reported previously in literature is listed in Table 1. Obviously, the sensors S3 exhibited better sensing properties to NO2 comparing with other devices. Additionally, as indicated in Fig. 7(c), it is surprising that the sensor S3 displayed the low detection limit of 0.5 ppm and the response value of present sensor almost varied linearly with the logarithm of NO2 concentration in the range of 0.5–10 ppm, which the sensitivity was as large as 34 mV per decade. Furthermore, the effect of different oxygen concentrations on sensing characteristic is evaluated and the corresponding results are demonstrated in Fig. 7(d). Obviously, the response of the fabricated sensor S3 increased slightly with the decreasing of oxygen partial pressure and ΔV varied linearly with the logarithm of O2 concentrations in the range of 5–21 vol% at 650 °C. Moreover, the continuous response and recovery characteristic for the present sensor is also an important sensing performance parameter. The continuous response and recovery transients of the fabricated sensor S3 to 10 ppm NO2 at 650 °C, as illustrated in Fig. 7(e). It is clearly seen that the responses of the present device to 10 ppm NO2 had little fluctuation and the best change error was −9.7% in the examined five-time cycles, which indicated that the sensor displayed comparatively good repeatability.
| Material | Operating temperature (°C) | NO2 conc. (ppm) | Response (mV) | Sensitivity (mV per decade) | Ref. |
|---|---|---|---|---|---|
| Rh–Co3V2O8 | 650 | 100 | 128.5 | 85 | This work |
| NiO | 850 | 400 | 75 | — | 2 |
| WO3 | 600 | 200 | 65 | — | 6 |
| ZnO | 700 | 50 | 40 | — | 7 |
| Ni0.95Cr0.03O1−δ | 800 | 200 | 50 | — | 28 |
| Rh–NiO | 800 | 50 | 77 | — | 29 |
| Cr2O3–WO3 | 800 | 100 | 51.6 | 25 | 30 |
| NiO–CuO | 800 | 400 | 28 | — | 31 |
| SmFeO3 | 500 | 90 | 64 | — | 8 |
| La0.65Sr0.35MnO3 | 500 | 100 | 50 | 36.6 | 32 |
| (La0.8Sr0.2)2FeNiO6−δ | 550 | 200 | 53.7 | 71.8 | 3 |
| ZnFe2O4 | 700 | 200 | 41 | 24 | 33 |
| MnCr2O4 | 650 | 100 | 73 | 44.5 | 9 |
| CdCr2O4 | 500 | 200 | 65 | 40 | 34 |
| Bi2W2O9 | 500 | 200 | 53 | 54.8 | 35 |
| CoNb2O6 | 750 | 100 | 99 | 52 | 10 |
| CoTa2O6 | 650 | 100 | 93 | 80 | 36 |
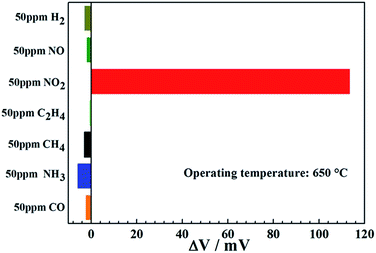
The selectivity of the sensor, as an important evaluation criterion for sensing characteristics, was investigated. The response values of the sensor S3 to 50 ppm of various gases, such as NO2, H2, NO, NH3, CO, CH4 and C2H4 were measured at 650 °C, as shown in Fig. 8. It revealed that the sensor S3 exhibited the highest response value toward 50 ppm NO2 as oppose to other interfering gases, which indicated that the present sensor displayed the excellent selectivity to NO2 at 650 °C.
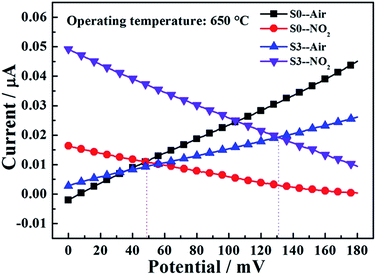
In order to more clearly elucidate the degree of electrochemical reaction at TPB for sensor S0 and S3 and to further explain the reason for improvement of NO2 sensing performance by loading Rh in Co3V2O8-SE, the polarization curves of the sensor S0 and S3 in air and sample gas (100 ppm NO2 + air) at 650 °C were measured, as shown in Fig. 9. From the perspective of a mixed-potential model,5,6,15 higher NO2 sensitivity can be achieved by one or combination of the following conditions: an increase in the polarization curve to cathodic reaction of NO2 and a decrease in the polarization curve to anodic reaction of O2. Clearly, for the sensor S3, the polarization curve for anodic reaction of O2 decreased slightly and the polarization curve for cathodic reaction of NO2 shifted significantly upward, compared with those of the sensor S0. The above result demonstrated that the electrochemical catalytic reaction activity to NO2 was enhanced obviously and the electrochemical catalytic activity to anodic reaction of O2 was lowered marginally when the Rh was loaded into Co3V2O8-SE. Therefore, the improvement of NO2 sensing performance was mainly attributed to the enhanced electrochemical catalytic reaction activity to NO2 because of addition of Rh. Additionally, the mixed potential can be estimated from the intersection of the cathodic and anodic polarization curves. Based on the comparison of the mixed potential estimated values and the potential difference values experimentally observed in Table 2. The mixed potential values (49 and 131 mV) for sensor S0 and S3 to 100 ppm NO2 are close agreement with the potential difference values (52 and 128.5 mV), indicating that the sensing mechanism of developed sensor abided by the mixed-potential model.
| Sensors | NO2 conc. (ppm) | Mixed potential (estimated) (mV) | Potential difference value (observed) (mV) |
|---|---|---|---|
| S0 | 100 | 49 | 52 |
| S3 | 100 | 131 | 128.5 |
4. Conclusions
The stabilized zirconia-based mixed potential type NO2 sensor utilizing Co3V2O8-SE loaded with different types of noble metal were fabricated and developed to improve the sensing characteristics at elevated temperature. Among the loading noble metals (Rh, Au, Pt and Pd), Rh was found to give the largest enhancement in NO2 response value. The gas sensing test results showed that the sensor attached with Co3V2O8-SE loaded with 3 wt% Rh displayed the highest response of 113.5 mV to 50 ppm NO2 and sensitivity of 85 mV per decade to 10–300 ppm NO2 at 650 °C. Interestingly, the present device also exhibited the low detection limit of 500 ppb and excellent selectivity to NO2 at 650 °C. Based on polarization curves measurement results, the mixed potential mechanism was verified and the improvement of NO2 sensing characteristics was speculated to be assigned to enhanced electrochemical catalytic reaction activity to NO2.Conflicts of interest
There are no conflicts to declare.Acknowledgements
This work is supported by the National Nature Science Foundation of China (No. 61327804, 61520106003, 61374218, 61533021, 61474057, 61473132 and 61503148), Program for Chang Jiang Scholars and Innovative Research Team in University (No. IRT13018) and National High-Tech Research and Development Program of China (863 Program, No. 2014AA06A505), National Key Research and Development Program of China (No. 2016YFC0207300 and 2016YFC0201002), Application and Basic Research of Jilin Province (2013010 2010JC).Notes and references
- R. Moos, B. Reetmeyer, A. Hürland and C. Plog, Sens. Actuators, B, 2006, 119, 57–63 CrossRef CAS.
- N. Miura, J. Wang, M. Nakatou, P. Elumalai, S. Zhuiykov and M. Hasei, Sens. Actuators, B, 2006, 114, 903–909 CrossRef CAS.
- L. Zhou, X. Li, H. Wu, Z. Liao, Q. Yuan, F. Xia and J. Xiao, Ceram. Int., 2014, 40, 9257–9263 CrossRef CAS.
- G. Lu, Q. Diao, C. Yin, S. Yang, Y. Guan, X. Cheng and X. Liang, Solid State Ionics, 2014, 262, 292–297 CrossRef CAS.
- N. Miura, T. Sato, S. Anggraini, H. Ikeda and S. Zhuiykov, Ionics, 2014, 20, 901–925 CrossRef CAS.
- G. Lu, N. Miura and N. Yamazoe, Sens. Actuators, B, 2000, 65, 125–127 CrossRef CAS.
- N. Miura, K. Akisada, J. Wang, S. Zhuiykov and T. Ono, Ionics, 2004, 10, 1–9 CrossRef CAS.
- H. Giang, H. Duy, P. Ngan, G. Thai, D. Thu, D. Thu and N. Toan, Sens. Actuators, B, 2013, 183, 550–555 CrossRef CAS.
- Q. Diao, C. Yin, Y. Guan, X. Liang, S. Wang, Y. Liu, Y. Hu, H. Chen and G. Lu, Sens. Actuators, B, 2013, 177, 397–403 CrossRef CAS.
- F. Liu, B. Wang, X. Yang, Y. Guan, R. Sun, Q. Wang, X. Liang, P. Sun and G. Lu, Sens. Actuators, B, 2016, 232, 523–530 CrossRef CAS.
- H. Cai, R. Sun, X. Yang, X. Liang, C. Wang, P. Sun, F. Liu, C. Zhao, Y. Sun and G. Lu, Ceram. Int., 2016, 42, 12503–12507 CrossRef CAS.
- S. Zhuiykov, T. Ono, N. Yamazoe and N. Miura, Solid State Ionics, 2002, 152–153, 801–807 CrossRef CAS.
- R. Wama, V. Plashnitsa, P. Elumalai, T. Kawaguchi, Y. Fujio, M. Utiyama and N. Miura, J. Electrochem. Soc., 2009, 156, J102–J107 CrossRef CAS.
- F. Liu, Y. Guan, M. Dai, H. Zhang, Y. Guan, R. Sun, X. Liang, P. Sun, F. Liu and G. Lu, Sens. Actuators, B, 2015, 216, 121–127 CrossRef CAS.
- F. Liu, Y. Guan, H. Sun, X. Xu, R. Sun, X. Liang, P. Sun, Y. Gao and G. Lu, Sens. Actuators, B, 2015, 222, 698–706 CrossRef.
- B. Wang, F. Liu, X. Yang, Y. Guan, C. Ma, X. Hao, X. Liang, F. Liu, P. Sun, T. Zhang and G. Lu, ACS Appl. Mater. Interfaces, 2016, 8, 16752–16760 CAS.
- C. Wang, X. Cheng, X. Zhou, P. Sun, X. Hu, K. Shimanoe, G. Lu and N. Yamazoe, ACS Appl. Mater. Interfaces, 2014, 6, 12031–12037 CAS.
- W. Chu, P. Chernavskii, L. Gengembre, G. Pankina, P. Fongarland and A. Khodakov, J. Catal., 2007, 252, 215–230 CrossRef CAS.
- W. Ni, S. Liu, Y. Fei, Y. He, X. Ma, L. Lu and Y. Deng, J. Mater. Chem. A, 2016, 4, 7746–7753 CAS.
- Z. Liu, J. Hao, L. Fu and T. Zhu, Appl. Catal., B, 2003, 44, 355–370 CrossRef CAS.
- M. Voß, D. Borgmann and G. Wedler, J. Catal., 2002, 212, 10–21 CrossRef.
- C. Jia, M. Schwickardi, C. Weidenthaler, W. Schmidt, S. Korhonen, B. Weckhuysen and F. Schüth, J. Am. Chem. Soc., 2011, 133, 11279–11288 CrossRef CAS PubMed.
- Z. Qin, J. Pei, G. Chen, D. Chen, Y. Hu, C. Lv and C. Bie, New J. Chem., 2017, 41, 5974–5980 RSC.
- V. Soundharrajan, B. Sambandam, J. Song, S. Kim, J. Jo, P. Duong, S. Kim, V. Mathew and J. Kim, J. Colloid Interface Sci., 2017, 501, 133–141 CrossRef CAS PubMed.
- J. Zhang, B. Yuan, S. Cui, N. Zhang, J. Wei, X. Wang, D. Zhang, R. Zhang and Q. Huo, Dalton Trans., 2017, 46, 3295–3302 RSC.
- N. Kim, S. Choi, S. Kim, H. Cho, J. Jang, W. Koo, M. Kim and I. Kim, Sens. Actuators, B, 2016, 224, 185–192 CrossRef CAS.
- K. Choi, S. Hwang, Z. Dai, Y. Kang and J. Lee, RSC Adv., 2014, 4, 53130–53136 RSC.
- P. Elumalai, J. Zosel and U. Guth, Ionics, 2009, 15, 405–411 CrossRef CAS.
- J. Wang, P. Elumalai, D. Terada, M. Hasei and N. Miura, Solid State Ionics, 2006, 177, 2305–2311 CrossRef CAS.
- Q. Diao, C. Yin, Y. Liu, J. Li, X. Gong, X. Liang, S. Yang, H. Chen and G. Lu, Sens. Actuators, B, 2013, 180, 90–95 CrossRef CAS.
- V. Plashnitsa, T. Ueda and N. Miura, Int. J. Appl. Ceram. Technol., 2006, 3, 127–133 CrossRef CAS.
- L. Wu, J. Xia, W. Shi, D. Jiang and Q. Li, Ionics, 2016, 22, 927–934 CrossRef CAS.
- N. Miura, S. Zhuiykov, T. Ono, M. Hasei and N. Yamazoe, Sens. Actuators, B, 2002, 83, 222–229 CrossRef CAS.
- G. Lu, N. Miura and N. Yamazoe, J. Mater. Chem., 1997, 7, 1445–1449 RSC.
- L. Wu, J. Xia, J. Wu and Q. Li, Ionics, 2015, 21, 3239–3244 CrossRef CAS.
- F. Liu, B. Wang, X. Yang, Y. Guan, Q. Wang, X. Liang, P. Sun, Y. Wang and G. Lu, Sens. Actuators, B, 2017, 240, 148–157 CrossRef CAS.
| This journal is © The Royal Society of Chemistry 2017 |

