
 Open Access Article
 This Open Access Article is licensed under a Creative Commons Attribution-Non Commercial 3.0 Unported Licence
A novel dual-channel chemosensor for CN− based on rhodamine B hydrazide derivatives and its application in bitter almond†
Peng-Xiang Pei,
Jing-Han Hu *,
Peng-Wei Ni,
Chen Long,
Jun-Xia Su and
You Sun
*,
Peng-Wei Ni,
Chen Long,
Jun-Xia Su and
You Sun
College of Chemical and Biological Engineering, Lanzhou Jiaotong University, Lanzhou, gansu 730070, P. R. China. E-mail: hujinghan62@163.com
First published on 4th October 2017
Abstract
In this article, we successfully designed and synthesized a novel chemosensor PW bearing rhodamine B hydrazide and 8-formyl-7-hydroxyl-4-methylcoumarin, which displayed both colorimetric and “turn-on” fluorescence responses for CN− in DMSO/H2O (1![[thin space (1/6-em)]](https://www.rsc.org/images/entities/char_2009.gif) :1, v/v, pH = 7.20) solution. The probe could distinguish CN− via a deprotonation process and the mechanism of intramolecular charge transfer (ICT), which was proved by 1H NMR titration, ESI-MS and DFT calculations. The detection limit of the sensor PW towards CN− was 1.592 × 10⁻⁷ M. Moreover, the sensor PW was successfully utilized to detect CN− in bitter almond. Test strips containing PW were also prepared, which could act as a colorimetric tool to detect CN− in practical application.
:1, v/v, pH = 7.20) solution. The probe could distinguish CN− via a deprotonation process and the mechanism of intramolecular charge transfer (ICT), which was proved by 1H NMR titration, ESI-MS and DFT calculations. The detection limit of the sensor PW towards CN− was 1.592 × 10⁻⁷ M. Moreover, the sensor PW was successfully utilized to detect CN− in bitter almond. Test strips containing PW were also prepared, which could act as a colorimetric tool to detect CN− in practical application.
1. Introduction
In recent years, the design and exploration of artificial sensors for recognizing cations and anions have received immense interest due to their important roles in biological, environmental, and industrial processes.1–4 It is well known that CN− is considered as the most hazardous one of various anions, and it is lethal to humans at concentrations of 0.5–3.5 mg kg−1 body weight.5–7 However, trace amounts of CN− also affect many functions such as blood vessels, visual sense, central nervous, heart and metabolic systems8–11 in the human body. The World Health Organization (WHO) has set the maximum acceptable amount of 1.9 μM for cyanide ion in drinking water.12,13 However, cyanide salts are widely utilized in various industries such as gold extraction, synthetic fibers, electroplating, and metallurgy etc.,14–16 which lead to a serious harm to environment and human health. Thus, the rational design and synthesis of efficient sensors to selectively recognize CN− is significantly important.In the past few decades, a variety of analytical methods such as ion chromatography, potentiometric, titrimetric and electrochemical methods17–20 have been reported for the investigation of CN−. However, those methods usually suffer from a series of shortages like high cost, long response time, sophisticated equipment and so on, which are serious stumbling blocks to its practical application.21–23 In contrast, fluorometric and colorimetric sensors have gained more attention due to low cost, simplicity, high selectivity, sensitivity and fast response.24
Our research group has a longstanding interest in molecular recognition.25–39 Herein, we designed a novel chemosensor PW based on rhodamine B hydrazide derivatives, which showed a dual-channel response for CN− in DMSO/H2O (1:1, v/v, pH = 7.20) solution. To the best of our knowledge,29–33 most of sensors based on rhodamine B derivatives were mainly utilized on the recognition of metal ions, and were rarely reported for the recognition of anions, especially for CN−. Furthermore, we found that sensors based on rhodamine B derivatives usually recognized metal ions by opening rings, however, the sensor PW recognized CN− by deprotonation process, and the ring had no any change in PW. In addition, the reason for the introduction of rhodamine B is owe to its good water solubility and strong fluorescence, which makes clearer for recognition of CN− in real sample. On account for these advantages, we believe that the sensor PW shows great promise for its potential applications.
2. Experimental
2.1. Reagents and apparatus
All reagents and solvents were obtained from the commercial sources without further purification. Double-distilled water was used throughout the experiment. Tetrabutylammonium salt of anions (F−, Cl−, Br−, I−, AcO−, H2PO4−, ClO4− and HSO4−) and sodium salt of anions (CN− and SCN−) were purchased from Alfa-Aesar Chemical Reagent Co. and stored in vacuum desiccators. 1H NMR and 13C NMR spectra were respectively recorded on a Mercury-400BB spectrometer at 400 MHz and 100 MHz, and chemical shifts were recorded in ppm (DMSO-d6 as solvent). Melting points were measured on an X-4 digital melting point apparatus that was uncorrected. Fluorescence spectra were performed using a Shimadzu RF-5301 fluorescence spectrophotometer. UV-Vis absorption spectra were measured on a Shimadzu UV-2550 spectrometer. ESI-MS was measured on an Agilent 1100 LC-MSD-Trap-VL system.2.2. Synthesis of 8-formyl-7-hydroxyl-4-methylcoumarin
4-Methylumbelliferone (10 g, 0.057 mol) and methenamine (20 g, 0.143 mol) were mixed in acetic acid (75 ml), and refluxed for 5.5 h at 95 °C, then added 150 ml hydrochloric acid (HCl/H2O, v/v = 84:100) and continued to stir for 0.5 h. Cooling to room temperature, poured the reaction solution to 750 ml distilled water and used acetic ether (300 ml) to extract, afterwards, the acetic ether was washed two times with saturated salt water, and the extract was evaporated to dry, finally, the extractive was recrystallized with EtOH to obtain yellow granular compound in 13%, mp: 179–181 °C.
2.3. Synthesis of intermediate rhodamine B hydrazide
Intermediate rhodamine B hydrazide was prepared by one step condensation reflux reaction of rhodamine B (0.96 g, 2 mmol) and hydrazine hydrate (1 ml, 0.02 mol) in methanol (30 ml), the reaction was stirred for 3 h at 65 °C, after cooling to room temperature, adjusting pH to 8–9, which emerged lots of pale pink precipitate, then filtrated and washed three times with distilled water to obtain light pink compound in 81% yield, mp: 215–217 °C.2.4. Synthesis of PW
Rhodamine B hydrazide (0.46 g, 1 mmol) and 8-formyl-7-hydroxyl-4-methylcoumarin (0.25 g, 1.2 mol) were refluxed for 6 h in DMF (20 ml) at 85 °C, after cooling to room temperature, the precipitate was filtrated and recrystallized with DMF-H2O to get light brown compound in 62% yield. As shown in Scheme 1 mp > 300 °C. 1H NMR (DMSO-d6, 400 MHz, ppm) δ: 11.74 (s, 1H), 9.49 (s, 1H), 7.97 (d, J = 8.38 Hz, 2H), 7.66 (dd, J = 7.60 Hz, 2H), 7.53 (d, J = 8.38 Hz, 1H), 7.17 (d, J = 7.40 Hz, 1H), 6.75 (d, J = 8.87 Hz, 1H), 6.46 (d, J = 8.76 Hz, 3H), 6.37 (m, 2H), 6.16 (s, 1H), 3.30 (d, J = 7.70 Hz, 8H) 2.29 (s, 3H), 1.07 (d, J = 6.86 Hz, 12H). 13C NMR (DMSO-d6, 100 MHz, ppm) δ: 164.05, 162.69, 161.06, 159.03, 153.67, 152.77, 151.38, 153.25, 149.12, 145.18, 134.83, 129.52, 128.73, 128.61, 128.25, 124.47, 123.66, 113.68, 112.08, 111.20, 108.76, 105.80, 104.42, 103.57, 97.81, 66.12, 44.10, 36.19, 31.19, 18.58, 12.76. m/z (ES+) calcd for C39H38N4O6: [M + H+] = 642, found: 643.2830. The structure of sensor PW was further confirmed by single-crystal X-ray diffraction (Fig. 1). | ||
| Scheme 1 The synthesis process of PW. | ||
 | ||
| Fig. 1 Single-crystal X-ray structure of sensor PW. | ||
3. Results and discussion
The anion-sensing abilities of PW were investigated by UV-Vis spectroscopy and fluorescence spectroscopy in DMSO/H2O (1:1, v/v, pH = 7.20). When 50 equiv. various anions (F−, Cl−, Br−, I−, AcO−, H2PO4−, HSO4−, ClO4−, SCN− and CN−) were respectively added to the solution of PW (2.0 × 10⁻⁵ M), only CN− was found to induce a dramatic color change from colorless to yellow. In the corresponding UV-Vis spectra, a dramatic absorption band was appeared. However, other examined anions (F−, Cl−, Br−, I−, AcO−, H2PO4−, HSO4−, ClO4− and SCN−) didn't induce any dramatic changes in color and absorption spectra (Fig. 2). These results suggested that PW could recognize CN− over all other anions.
 | ||
| Fig. 2 UV-Vis spectra of PW (20 μM) in the presence of 50 equiv. of various anions in DMSO/H2O (1:1, v/v, pH = 7.20) binary solution at room temperature. Inset: color changes of PW containing various anions in DMSO/H2O (1:1, v/v, pH = 7.20) solution. | ||
Free PW alone exhibited a weak fluorescence emission band at 512 nm when excited at 320 nm in DMSO/H2O (1:1, v/v, pH = 7.20), up addition of 50 equiv. CN− to the solution of PW (2.0 × 10⁻⁵ M), PW induced a significant fluorescence ‘off-on’ response for CN− at 512 nm, as shown in Fig. 3, which responded with a color change from saffron yellow to bright green under UV lamp. However, other anions (F−, Cl−, Br−, I−, AcO−, H2PO4−, HSO4−, ClO4− and SCN−) hardly changed the color and fluorescence intensity of PW, which indicated that PW could sense CN− with single selectivity in DMSO/H2O (1:1, v/v, pH = 7.20) solution.
 | ||
| Fig. 3 Fluorescence spectra of PW (20 μM, λex = 320 nm, λem = 512 nm) with various anions (50 equiv.) in DMSO/H2O (1:1, v/v, pH = 7.20). Inset: color changes observed for PW (20 μM) with various anions (50 equiv.) in DMSO/H2O (1:1, v/v, pH = 7.20) solution under the UV lamp. | ||
To validate anti-interference capability of sensor PW, PW containing various anions (F−, Cl−, Br−, I−, AcO−, H2PO4−, HSO4−, ClO4− and SCN−) were investigated by UV-Vis spectroscopy and fluorescence spectroscopy. Results suggested that PW solutions with various anions didn't induce distinct spectrum changes in absence of CN−, however, upon addition of CN−, as shown in Fig. 4, all solutions showed obviously spectrum changes, which indicated that sensor PW had an excellent selectivity for CN− over other anions no matter in UV-Vis spectroscopy and fluorescence spectroscopy.
 | ||
| Fig. 4 (a) UV-Vis spectra changes for PW (20 μM) containing various anions in presence of CN− in DMSO/H2O (1:1, v/v, pH = 7.20) solution. (b) Fluorescence spectra of PW–CN− with various interference anions in DMSO/H2O (1:1, v/v, pH = 7.20) solution. | ||
Furthermore, we calculated the quantum yields of PW and PW + CN− by measuring respectively the UV-Vis absorption spectra and the fluorescent spectra and the reference compound. The quantum yields were calculated using the following equation:40

To get insight into the CN− (0.01 M) sensing property of sensor PW, the UV-Vis absorption spectrum and fluorescence spectrum changes of PW were carried out in DMSO/H2O (1:1, v/v, pH = 7.20) solution. As shown in Fig. 5a, along with the increasing amount of CN− from 0 equiv. to 23 equiv., the absorption band at 320 nm decreased while the absorption band at 380 nm increased. At the same time, the well-defined isosbestic point appeared at 358 nm, which clearly indicated an interconversion into single discrete chemical species during the titration process. Fig. 5b showed the emission spectrum changes on addition of CN−, when excited at 320 nm, the emission intensity at 512 nm of sensor PW enhanced 11-fold on changing the concentration of CN− from 0 equiv. to 37.5 equiv. Furthermore, the fluorescence detection limits of PW towards CN− based on 3SB/S (where SB is the standard deviation of the blank solution and S is the slope of the calibration curve) was down to 1.592 × 10⁻⁷ M (Fig. 6), which indicated that PW could detect low concentration of CN− in practical application.
 | ||
| Fig. 5 (a) Absorption spectra titration of sensor PW (20 μM) after addition of different concentration of CN− (0–23 equiv.) in DMSO/H2O (1:1, v/v, pH = 7.20) solution (b) fluorescence spectra of PW in the presence of different concentration of CN− (0–37.5 equiv.) in DMSO/H2O (1:1, v/v, pH = 7.20) solution. | ||
 | ||
| Fig. 6 Fluorescence detection limit of PW (20 μM) towards CN− in DMSO/H2O (1:1, v/v, pH = 7.20) solution. | ||
The association constants (Ka) were determined based on the fluorescent titration curve using the equation as follows: where F1 and F0 respectively represent the fluorescent intensity of host in the presence and absence of ions, Fmax is the saturated intensity of host in the presence of excess amounts of ions; [C] is the concentration of ions added.41
| 1/(Fmax − F0) = 1/(F1 − F0)(1/(K[C]2) + 1) |
According for formula above, as shown in Fig. 7, the acid reaction equilibrium constant (Ka) is 2.67 × 10⁷, and pKa = 6.52.
 | ||
| Fig. 7 Benesi–Hilderbrand plot of PW with CN−. | ||
Since pH may affect the charge distribution of PW and change its inherent fluorescence properties, the impact of pH on PW was studied by fluorescence spectroscopy. As shown in Fig. S1,† sensor PW showed a significant fluorescence response for CN− within the basic pH range from 7.0 and 9.0, indicating clearly that pH had a significant influence on the recognition of CN−.
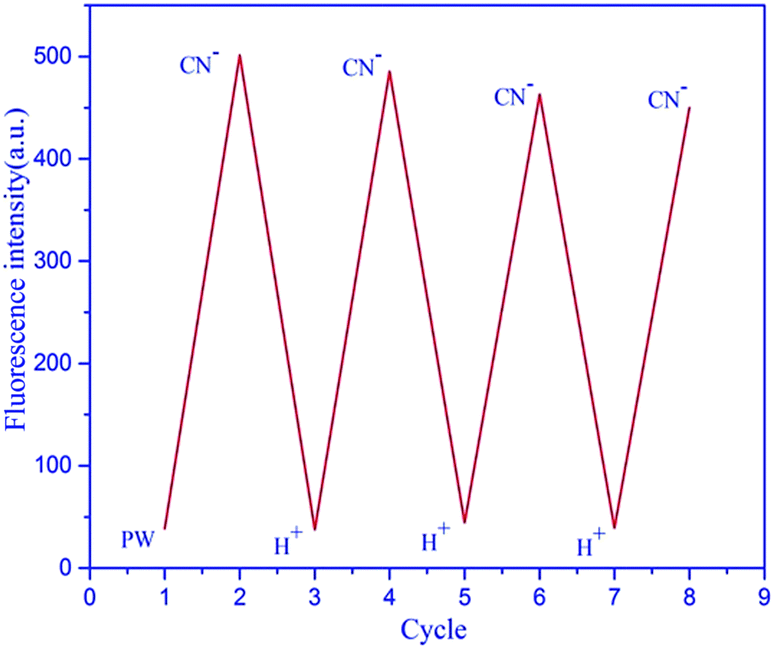
The reversibility of sensor PW was measured by alternating addition of H+ and CN− in DMSO/H2O (1:1, v/v, pH = 7.20) solution. As shown in Fig. 8, upon addition of H+ to the PW–CN− system, the fluorescence intensity clearly showed “OFF” behavior through the regeneration of PW. On further addition of CN−, the fluorescence intensity showed “ON” through the deprotonation of PW. This indicated that sensor PW showed an excellent reversibility for CN− ions, and the “OFF-ON-OFF” switching process could be repeated more than seven times without larger fluorescence loss.
 | ||
| Fig. 8 The reversible and reproducible fluorometric switch controlled by alternating addition of H+ and CN−. | ||
To confirm the binding stoichiometry between PW and CN−, the method of continuous variations was used as shown in Fig. 9. A job plot was implemented, as we expected, the results demonstrated that a stoichiometry for PW–CN− was 1:1.
 | ||
| Fig. 9 Job plots of PW and CN−. | ||
The recognition mechanism of sensor PW towards CN− based on the deprotonation of hydroxyl was finally investigated by 1H NMR titration and mass spectrometry. As shown in Fig. 10, sensor PW showed two strong peaks at 11.74 ppm and 9.49 ppm in DMSO-d6, which correspond to the proton of –OH and N![[double bond, length as m-dash]](https://www.rsc.org/images/entities/char_e001.gif) CH, upon the addition of 2.5 equiv. CN−, the –OH peak at 11.74 ppm disappeared, which indicated that CN− took the protons of –OH due to strong acid was readily deprotonated when basic ions existed, furthermore, we found that the peak of NCH gradually decreased and showed upfield shift, which indicated that the deprotonation of hydroxyl made sensor PW shielded by the increase of electron density through charge delocalization in the conjugated system. Afterwards, addition of 3.0 equiv. H+ to the above system, we found that there appeared two new peaks at 11.74 ppm and 9.49 ppm, which can be attributed to the –NH and –OH.
CH, upon the addition of 2.5 equiv. CN−, the –OH peak at 11.74 ppm disappeared, which indicated that CN− took the protons of –OH due to strong acid was readily deprotonated when basic ions existed, furthermore, we found that the peak of NCH gradually decreased and showed upfield shift, which indicated that the deprotonation of hydroxyl made sensor PW shielded by the increase of electron density through charge delocalization in the conjugated system. Afterwards, addition of 3.0 equiv. H+ to the above system, we found that there appeared two new peaks at 11.74 ppm and 9.49 ppm, which can be attributed to the –NH and –OH.
 | ||
| Fig. 10 1H NMR spectra of free PW (DMSO-d6) and in the presence of different amounts of CN− (0.1 M, DMSO-d6). | ||
ESI-MS also gave a strong support for the mechanism of PW towards CN−, as shown in Fig. S3,† PW ion peak was detected at m/z 643.2830 (PW + H+), but it appeared at m/z 665.3495 (PW–H+ + Na+ + H+) after the addition of CN− (Fig. S4†), which indicated that PW did undergo deprotonation process.
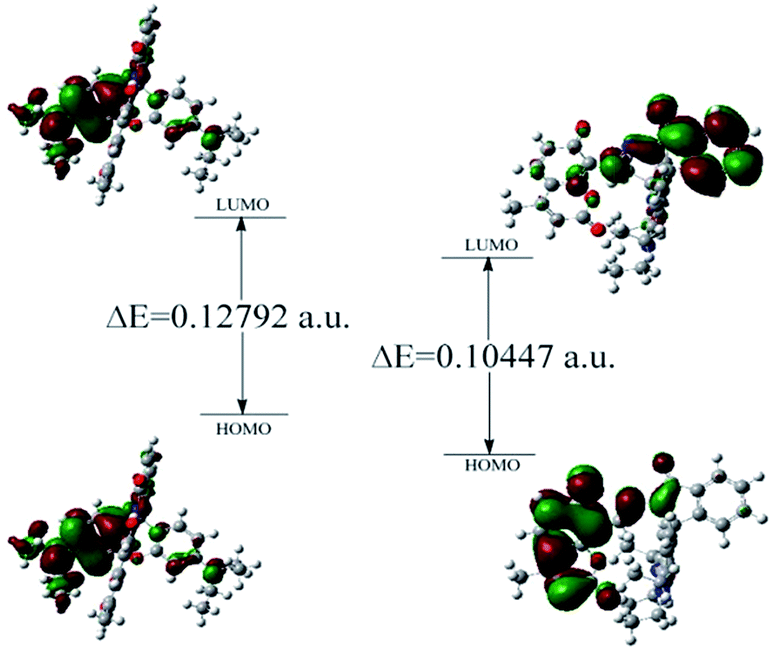
Further analysis of the mechanism of PW with CN−, we performed DFT calculations done at the B3LYP/6-311g (2d, p) level of theory.34 As shown in Fig. 11, the HOMO–LUMO energy band gap of PW and PW–CN− system were respectively 0.12792 a.u. and 0.10447 a.u. Obviously, the HOMO–LUMO energy band gap of PW was higher than the PW–CN− system, which showed the reaction could occur in dynamics. Furthermore, we could observe that the electron cloud density of the HOMO levels of PW are almost localized on the ring of rhodamine B, upon interaction with CN−, the electron cloud of the HOMO levels of PW shifted the ring of coumarin, which clearly indicated that the addition of CN− made sensor PW occur intramolecular charge transfer (ICT).
 | ||
| Fig. 11 The DFT computed HOMO and LUMO diagram of PW and PW–CN− system. | ||
This deprotonation caused an obvious change in absorption spectra, and the fluorescence enhancement at 512 nm was possibly caused by a large charge separation resulting in a strong intramolecular charge transfer (ICT) in PW, simultaneously, we also confirmed that the stoichiometry of PW–CN− was 1:1. Based on the above findings, we proposed that a possible interaction mechanism between PW and CN− in this system which may proceed through the route depicted in Scheme 2.
 | ||
| Scheme 2 A possible mechanism of PW and CN−. | ||
To facilitate the use of PW for the detection of cyanide in practical application, test strips were prepared by immersing filter papers into the DMSO solution of PW (0.01 M) and then drying in air. As shown in Fig. 12, interestingly, the color of test strip changed from bisque to dark yellow under visible light, and changed from ecru to green under UV lamp. This clearly indicated that test strips containing PW could act as a practical colorimetric tool to detect CN−.
 | ||
| Fig. 12 Photographs of test strips (a) only PW; (b) PW with CN− by naked eyes; (c) only PW under UV lamp; (d) PW with CN− under UV lamp. | ||
To further investigate the practical application of sensor PW in our lives, we utilized it to detect CN− in the bitter almond. 25 g of crushed bitter almond were put into a round flask containing 100 ml of water and 0.5 g of NaOH, the mixture solution was stirred for 20 min before filtrating. Then the filtrate was adjusted to pH = 9 with fresh double water, and the solution (2.0 ml) was added to the solution of PW (0.5 ml, 1.0 × 10⁻⁵ M), we found that the fluorescence intensity of PW remarkably enhanced, which clearly indicated that PW could be applied successfully for detecting CN− in bitter almond (Fig. 13).
 | ||
| Fig. 13 Fluorescence spectra response of PW (20 μM) in diluted bitter almond. | ||
To further show excellent properties of PW, we also compared detection limits, solvent medium, and applications of reported sensors with compound PW, as shown in Table S1.†
4. Conclusion
In summary, we have designed and synthesized a novel chemosensor PW, which showed a dual-channel response for CN− in DMSO/H2O (1:1, v/v) solution within the basic pH range (pH = 7.0–9.0). The fluorescence process could be reversed by adding H+ and CN−, and the switching process could be repeated more than seven times without a large fluorescence loss. Moreover, the detection limit on fluorescence response of the sensor PW to CN− was down to 1.592 × 10⁻⁷ M by titration method, which is lower than the maximum level of 1.9 × 10⁻⁶ M for cyanide in drinking water according to WHO guidelines. Notably, the simple and efficient sensor PW was successfully used to the qualitative detection of cyanide in bitter almond. Test trips based on sensor PW were fabricated and could serve as a practical colorimetric tool to detect CN− in field measurements. On account of those advantages, we believe that PW as a CN− sensor makes it more conspicuous for its potential application.
Conflicts of interest
There are no conflicts to declare.Acknowledgements
We gratefully acknowledge the support of the National Nature Science Foundation of China (No. 21467012).References
- W. J. Qu, T. B. Wei, Q. Lin, W. T. Li, J. X. Su, G. Y. Liang and Y. M. Zhang, Sens. Actuators, B, 2016, 232, 115–124 CrossRef CAS.
- A. B. Davis, R. E. Lambert, F. R. Fronczek, P. J. Craggc and K. J. Wallace, New J. Chem., 2014, 38, 4678–4683 RSC.
- G. C. Yu, Z. B. Zhang, C. Y. Han, M. Xue, Q. Z. Zhou and F. H. Huang, Chem. Commun., 2012, 48, 2958–2960 RSC.
- C. Y. Han, F. Y. Ma, Z. B. Zhang, B. Y. Xia, Y. H. Yu and F. H. Huang, Org. Lett., 2010, 12, 4360–4363 CrossRef CAS PubMed.
- L. T. Zeng, N. Fan, J. Y. Zha, X. C. Hu, B. Q. Fu, C. Q. Qin and L. Wang, Analyst, 2013, 138, 7083–7088 RSC.
- S. K. Patra, S. K. Sheet, B. Sen, K. Aguan, D. R. Roy and S. Khatua, J. Org. Chem. DOI:10.1021/acs.joc.7b01743.
- M. K. S. Flores, I. J. B. Rodríguez, D. M. Otero, M. A. G. Eleno, J. J. G. García, D. M. Morales and A. D. González, Dalton Trans., 2017, 46, 4950–4959 RSC.
- J. Afshani, A. Badiei, M. Jafari, A. Shayesteh, M. Karimi, N. Lashgari and G. M. Ziarani, J. Lumin., 2016, 179, 463–468 CrossRef CAS.
- P. Gholamzadeh, G. M. Ziarani, N. Lashgari, A. Badiei, A. Shayesteh and M. Jafari, J. Fluoresc., 2016, 26, 1857–1864 CrossRef CAS PubMed.
- S. Goswami, A. Manna, S. Paul, K. Aich, A. K. Das and S. Chakraborty, Tetrahedron Lett., 2013, 54, 1785–1789 CrossRef CAS.
- A. Sarkar, S. Bhattacharyya and A. Mukherjee, Dalton Trans., 2016, 45, 1166–1175 RSC.
- P. Zhang, B. B. Shi, X. M. You, Y. M. Zhang, Q. Lin, H. Yao and T. B. Wei, Tetrahedron, 2014, 70, 1889–1894 CrossRef CAS.
- S. Das, S. Biswas, S. Mukherjee, J. Bandyopadhyay, S. Samanta, I. Bhowmick, D. K. Hazra, A. Ray and P. P. Parui, RSC Adv., 2014, 4, 9656–9659 RSC.
- D. S. Kim, Y. M. Chung, M. Jun and K. H. Ahn, J. Org. Chem., 2009, 74, 4849–4854 CrossRef CAS PubMed.
- R. Manivannan, A. Satheshkumar and K. P. Elango, New J. Chem., 2013, 37, 3152–3160 RSC.
- P. Li, H. Wang, M. Zhang, G. X. Zhang and D. Q. Zhu, Org. Lett., 2009, 11, 1943–1946 CrossRef PubMed.
- C. Chen, R. Y. Wang, L. Q. Guo and N. Y. Fu, Org. Lett., 2011, 13, 1162–1172 CrossRef CAS PubMed.
- G. Y. Gao, W. J. Qu, B. B. Shi, P. Zhang, Q. Lin, H. Yao, W. L. Yang, Y. M. Zhang and T. B. Wei, Spectrochim. Acta, Part A, 2014, 121, 514–613 CrossRef CAS PubMed.
- D. Shan, C. Mousty and S. Cosnier, Anal. Chem., 2004, 6, 178–182 CrossRef PubMed.
- G. Y. Gao, B. Gong, W. T. Zhang, Q. L. Ye, J. Wei and G. L. Ning, Spectrochim. Acta, Part B, 2012, 162, 391–412 Search PubMed.
- T. K. Ghorpade, M. Patri and S. P. Mishra, Spectrochim. Acta, Part B, 2016, 225, 428–435 CAS.
- S. Chattaraj and A. K. Das, Analyst, 1991, 116, 739–741 RSC.
- S. Yen, C. T. Wang and J. S. Wang, Chem. Eng. Commun., 1991, 109, 167–180 CrossRef CAS.
- W. K. Dong, X. L. Li, L. Wang, Y. Zhang and Y. J. Ding, Spectrochim. Acta, Part B, 2016, 229, 370–378 CAS.
- J. Qi, J. H. Hu, J. J. Chen, Y. Sun and J. B. Li, Curr. Anal. Chem., 2016, 12, 119–123 CrossRef CAS.
- J. H. Hu, Y. Sun, J. Qi, P. X. Pei, Q. Lin and Y. M. Zhang, RSC Adv., 2016, 6, 100401–100406 RSC.
- J. H. Hu, Y. Sun, J. Qi, Q. Lin and T. B. Wei, Spectrochim. Acta, Part A, 2017, 175, 125–133 CrossRef CAS PubMed.
- Y. Sun, J. H. Hu, J. B. Li and J. Qi, Spectrochim. Acta, Part A, 2016, 167, 101–105 CrossRef CAS PubMed.
- J. H. Hu, J. B. Li, J. Qi and Y. Sun, Spectrochim. Acta, Part B, 2015, 208, 581–587 CAS.
- J. H. Hu, J. B. Li, J. Qi and Y. Sun, New J. Chem., 2015, 39, 4041–4046 RSC.
- J. H. Hu, J. B. Li, J. Qi and Y. Sun, Phosphorus, Sulfur Silicon Relat. Elem., 2016, 191, 984–987 CrossRef CAS.
- J. H. Hu, J. B. Li, J. Qi and J. J. Chen, New J. Chem., 2015, 39, 843–848 RSC.
- J. B. Li, J. H. Hu, J. J. Chen and J. Qi, Spectrochim. Acta, Part A, 2014, 133, 773–777 CrossRef CAS PubMed.
- S. Z. Pu, H. C. Ding, G. Liu, C. H. Zheng and H. Y. Xu, J. Phys. Chem. C, 2014, 118, 7010–7017 CAS.
- S. K. Ko, Y. K. Yang, J. Tase and I. Shin, J. Am. Chem. Soc., 2006, 128, 14150–14155 CrossRef CAS PubMed.
- Y. K. Yang, K. J. Yook and J. Tae, J. Am. Chem. Soc., 2005, 127, 16760–16761 CrossRef CAS PubMed.
- J. Y. Kwon, Y. J. Jang, Y. J. Lee, K. M. Kim, M. S. Seo, W. Nam and J. Yoon, J. Am. Chem. Soc., 2005, 127, 10107–10111 CrossRef CAS PubMed.
- V. Dujols, F. Ford and A. W. Czarnik, J. Am. Chem. Soc., 1997, 119, 7386–7387 CrossRef CAS.
- Y. L. Leng, J. H. Zhang, Q. Li, Y. M. Zhang, Q. Lin, H. Yao and T. B. Wei, Spectrochim. Acta, Part A, 2016, 167, 116–121 CrossRef CAS PubMed.
- W. J. Qu, W. T. Li, H. L. Zhang, T. B. Wei, Q. Lin, H. Yao and Y. M. Zhang, Spectrochim. Acta, Part B, 2017, 241, 430–437 CAS.
- B. B. Shi, P. Zhang, T. B. Wei, H. Yao, Q. Lin and Y. M. Zhang, Chem. Commun., 2013, 49, 7812–7814 RSC.
Footnote |
| † Electronic supplementary information (ESI) available. CCDC 1563205. For ESI and crystallographic data in CIF or other electronic format see DOI: 10.1039/c7ra09174e |
| This journal is © The Royal Society of Chemistry 2017 |