 Open Access Article
Creative Commons Attribution 3.0 Unported Licence
A magnetic fluorescence molecularly imprinted polymer sensor with selectivity for dibutyl phthalate via Mn doped ZnS quantum dots†
Wanzhen Xua,
Tao Lib,
Weihong Huanga,
Yu Luanc,
Yanfei Yangc,
Songjun Li*b and
Wenming Yang *b
*b
aSchool of the Environment and Safety Engineering, Jiangsu University, Zhenjiang 212013, China
bInstitute of Polymer Materials, School of Materials Science and Engineering, Jiangsu University, 301, Xuefu Road, Zhenjiang 212013, Jiangsu Province, China. E-mail: Lsjchem@ujs.edu.cn; ywm@ujs.edu.cn; Fax: +86 511 88791947; Tel: +86 511 88791919
cZhenjiang Institute for Drug Control of Jiangsu Province, Zhenjiang 212003, China
First published on 6th November 2017
Abstract
In this work, magnetic quantum dots molecularly imprinted polymers were synthesized, which were based on ZnS and magnetic Fe3O4. The polymers had a spherical shape and a core–shell structure and exhibited a magnetic strength of 17.20 emu g−1 and optical stability. After the experimental conditions were optimized, the fluorescence intensity showed a linear dependence with concentration from 5.0 μmol L−1 to 50 μmol L−1, with R2 = 0.9960. Upon optimizing the experimental conditions, the linear dependence of fluorescence intensity with concentration ranged from 5.0 μmol L−1 to 50 μmol L−1, with a detection limit of 0.08 μmol L−1. Furthermore, the MQDs–MIPs were successfully used for the detection of a tap water sample. With three spiking concentration levels, the recovery rate of each experiment was from 99.45 to 103.4%, with a relative standard deviation from 1.97 to 3.37%. This study provides a promising strategy for fabricating magnetic fluorescence molecular imprinted polymers with highly selective recognition ability.
1. Introduction
Dibutyl phthalate (DBP) is one of the phthalate esters (PAEs), which is often used as a plasticizer in rubber, plastics, cellulose, and styrene. So it's commonly found in cosmetics, perfumes, and lotions, pharmaceuticals, certain medical devices and drinking water.1–3 To date, the methods used for the detection of DBP include solid-phase extraction, gas chromatography with mass spectrometry, and liquid chromatography. Although they have enhanced sensitivity and specificity, these methods are time-consuming, costly and need tedious sample pretreatment.4–6 Therefore, it is very important to develop effective ways to selectively analyse DBP.Molecularly imprinted polymers (MIPs), with a high specific recognition, practicability and stability, have been greatly applied in various fields including chemical sensors, solid phase extraction, drug delivery and catalysis.7–13
Semiconductor nanocrystals, known as QDs, have been greatly used as sensors to analyse a variety of analytes containing ions, small molecules, and biological macromolecules.14–18 Many researchers have constructed QD-based fluorescence sensors for sensitively analysing analytes. For example, S. Huang et al. reported that mercaptoacetic acid capped CdSe/ZnS QDs allowed a highly sensitive determination of L-cysteine in aqueous solutions.19 N. Ertas et al. developed a room temperature phosphorescence sensor for in vitro binding assay of idarubicin and DNA based on L-cysteine capped Mn-doped ZnS quantum dots.20 However, the weak selectivity of QDs-based sensors, which limits its application, needs to be overcome. Much effort has been made to improve the selectivity of QDs sensors, a new type of molecularly imprinted polymer coated QDs sensors, which take advantage of the remarkable photology property of QDs and special selectivity of MIPs, have been reported.
Our group also prepared many related examples and investigated their application in real samples. X. Wei et al. proposed molecularly imprinted polymer nanospheres based on Mn-doped ZnS QDs via precipitation polymerization for room-temperature phosphorescence probing of 2,6-dichlorophenol,21 and C. X. Qiu et al. prefabricated molecularly imprinted polymer on hybrid SiO2-coated CdTe nanocrystals for selective optosensing of bisphenol A.22 In order to obtain the ideal MIPs-based QDs sensors, we should optimize the preparation conditions.
Compared with common separation methods, the magnetic separation technique has been investigated because of the capability of easy manipulation, possible automation, and high throughput.23,24 When Fe3O4 particles are encapsulated inside MIPs, the polymers will have magnetically susceptible characteristics. Moreover, the magnetic MIPs not only selectively recognize target matters from the crude matrix, but also can be easily isolated by external magnetic fields after they have finished their recognition and adsorption.25,26 To the best of our knowledge, there are only a few reports of MIPs based on Mn–ZnS and magnetic Fe3O4 for detecting DBP.
In this study, we proposed a novel method of preparing novel and eco-friendly magnetic fluorescence molecularly imprinted polymers (MQDs–MIPs) for recognition and separation of DBP. The polymers combined the merits of specific molecular recognition properties of MIPs, magnetic separation, and fluorescence characteristics of Mn–ZnS. The process included the synthesis of Fe3O4 nanoparticles, covering by silica-shell, grafting of Mn-doped ZnS QDs, silica-shell deposition again to avoid leakage of Mn-doped ZnS QDs, and MIPs-functionalization on the substance surface. The magnetic property, optical stability, sensitivity and selectivity of the MQDs–MIPs were investigated. After the experimental conditions were optimized, the prepared artificial fluorescence sensor was applied to the detection of DBP in real samples.
2. Experimental
2.1 Reagents and materials
See ESI.†2.2 Instruments
See ESI.†2.3 Synthesis of Fe3O4 nanoparticles
Typically, 1.35 g FeCl3·6H2O was dissolved in 40 mL ethylene glycol by sonication to form a clear solution, followed by the addition of 3.6 g NaAc and 1.0 g polyethylene glycol. The mixture solution was stirred for 30 min at room temperature and then sealed in an autoclave. After that, the autoclave was heated at 200 °C for 48 h and then cooled to room temperature. Finally, the product was washed several times with ethanol and dried at 60 °C for 24 h.2.4 Synthesis of MPTS-capped Mn doped ZnS QDs
Briefly, 6.25 mmol of ZnSO4·7H2O and 0.5 mmol of MnCl2·4H2O were mixed in 20 mL of water by stirring at room temperature for 20 min with the protection of nitrogen gas. After that, 6.25 mmol Na2S·9H2O was dissolved in 5 mL ultrapure water and then added dropwise to the above mixture with stirring for 30 min. Subsequently, 5.0 mL ethanol solution containing 0.318 mmol MPTS was added and kept stirring for 24 h. The obtained product was centrifuged with deionized water several times and dried in a vacuum oven at 60 °C overnight.2.5 Preparation of magnetic quantum dots
Typically, 2.0 mL of Fe3O4 aqueous solution was added into 60 mL of ethanol and 10 mL deionized water by ultrasound for 20 min. Then, 1.0 mL of ammonium hydroxide (25%) and 2.0 mL of TEOS were injected into the above solution. The solution was reacted at 25 °C for 24 h under mechanical stirring. After that, 2.0 mL of TEOS was added and reacted for 24 h, followed by the addition of 20 mL of Mn doped ZnS QDs aqueous solution and reacted for 8 h. The product, magnetic quantum dots SiO2–QDs–SiO2@Fe3O4 (MQDs) was obtained using an external magnetic field and washed several times with ethanol and ultrapure water. Then, the MQDs were dried under vacuum at 55 °C overnight.2.6 Synthesis of vinyl-modified magnetic quantum dots
Typically, 0.25 g of the above MQDs and 1 mL of MIPs were dissolved into 60 mL of methylbenzene and stirred fast with N2 at 90 °C for 12 h. Finally, the resultant vinyl-modified MQDs washed with ethanol were collected using an external magnetic field and dried under vacuum at 60 °C for 24 h.2.7 Synthesis of MIPs with magnetic quantum dots
The MIPs with magnetic quantum dots, MQDs–MIPs, were synthesised using the surface molecular imprinting technique. EGDMA and AM were used as a cross-linking agent and functional monomer, respectively. In the beginning, 0.25 mmol of DBP, 5 mmol of EGDMA and 1 mmol of AM were dissolved in 60 mL of ethanol and then fully stirred to self-assemble at 25 °C. Furthermore, 0.25 g of vinyl-modified MQDs was dissolved into the above mixture solution by ultrasonication for 40 min. Then, 40 mg AIBN was added and polymerized at 60 °C for 24 h under N2. As a control, magnetic quantum dots non-imprinted polymers (MQDs–NIPs) were prepared under the same conditions without template. Finally, the product was acquired by magnetic separation, washed with ethanol and dried in a vacuum oven at 60 °C overnight.2.8 Fluorescence measurements
All the fluorescence detections were performed using the following conditions: the photomultiplier tube voltage was 800 V, the excitation wavelength was 300 nm, recording emission range was 500–700 nm, and the slit width was 5 nm. A series of concentrations of DBP was dispersed in ultrapure water to prepare the solution. The MQDs–MIPs (or MQDs–NIPs) were dissolved into ultrapure water by ultrasonication to get the stock solution (100 mg L−1). In each vial, 2 mL of MQDs–MIPs (or MQDs–NIPs) suspension, 2 mL phosphate buffer solution and different concentrations of analytes were mixed together. After controlling for 30 min at 25 °C under gentle shaking, the mixture was transferred into a quartz cell for further studies.2.9 Analysis of real samples
Tap water samples were used to evaluate the accuracy and practicability of the MQDs–MIPs. The real samples did not contain DBP molecule. In this experiment, we used standard addition recovery to analyse the recovery study with DBP concentrations of 5.0, 15.0, and 20.0 μmol L−1.3. Results and discussion
3.1 Preparation of MIPs with magnetic quantum dots
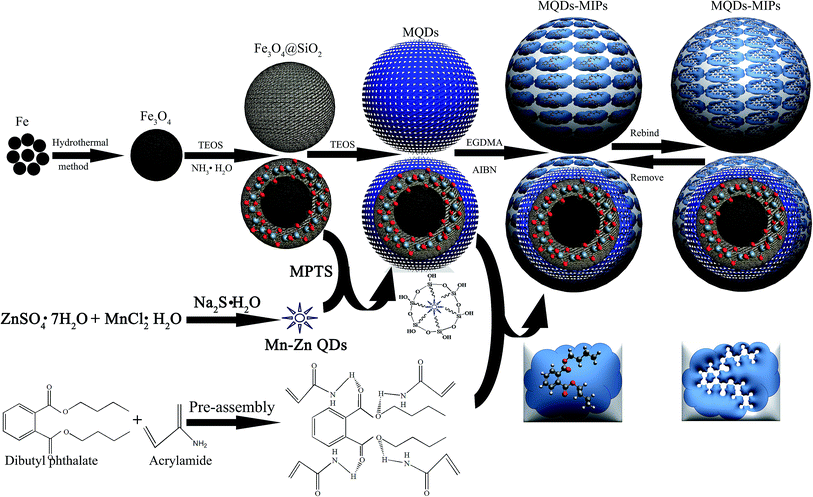
Scheme 1 illustrates the major steps involved in the synthesis of MQDs–MIPs. In the beginning, Fe3O4 microspheres with a higher magnetic response were synthesized by a solvothermal reaction. Then, silica was selected to encapsulate Fe3O4 to obtain highly stable and well-dispersed magnetic nanoparticles. Subsequently, MPTS modified Mn-doped ZnS QDs were attached to SiO2@Fe3O4. After that, silica was deposited on MQDs microspheres. DBP and AM were dispersed in ethanol, and then they could self-assemble. Finally, a thin MIPs film was synthesized on the surface of vinyl-modified MQDs. After the DBP were extracted from the MQDs–MIPs with solvent extraction, decomposing the hydrogen bond between DBP and AM, the MQDs–MIPs with molecular recognition ability were acquired owing to the imprinted cavities having excellent compatibility of size, shape and chemical interactions.The molar ratio of the template molecule and functional monomer play a very important role in the performance of MQDs–MIPs. Three types of MQDs–MIPs, with molar ratios of the template (DBP) and functional monomer (AM) of 1![[thin space (1/6-em)]](https://www.rsc.org/images/entities/char_2009.gif) :
:![[thin space (1/6-em)]](https://www.rsc.org/images/entities/char_2009.gif) 2, 1
2, 1![[thin space (1/6-em)]](https://www.rsc.org/images/entities/char_2009.gif) :
:![[thin space (1/6-em)]](https://www.rsc.org/images/entities/char_2009.gif) 4, and 1
4, and 1![[thin space (1/6-em)]](https://www.rsc.org/images/entities/char_2009.gif) :
:![[thin space (1/6-em)]](https://www.rsc.org/images/entities/char_2009.gif) 6, were prepared. In order to research the fluorescence recognition ability, three MQDs–MIPs aqueous solutions were mixed with different concentrations for DBP. According to the quenching efficiency, we can find that polymer 2 is the best one (Table 1). Therefore, the molar ratio of 1
6, were prepared. In order to research the fluorescence recognition ability, three MQDs–MIPs aqueous solutions were mixed with different concentrations for DBP. According to the quenching efficiency, we can find that polymer 2 is the best one (Table 1). Therefore, the molar ratio of 1![[thin space (1/6-em)]](https://www.rsc.org/images/entities/char_2009.gif) :
:![[thin space (1/6-em)]](https://www.rsc.org/images/entities/char_2009.gif) 4 of the template (DBP) and functional monomer (AM) was selected to prepare the MQDs–MIPs.
4 of the template (DBP) and functional monomer (AM) was selected to prepare the MQDs–MIPs.
![[thin space (1/6-em)]](https://www.rsc.org/images/entities/char_2009.gif) :
:![[thin space (1/6-em)]](https://www.rsc.org/images/entities/char_2009.gif) functional monomer (AM) on the performance of the Fe3O4@SiO2–QDs–MIPs
functional monomer (AM) on the performance of the Fe3O4@SiO2–QDs–MIPs
| Template/functional monomer (molar ratio) | Fluorescence intensity before adding DBP (P0) | Fluorescence intensity after adding DBP (P) | Quench efficiency | |
|---|---|---|---|---|
| Polymer 1 | 1![[thin space (1/6-em)]](https://www.rsc.org/images/entities/char_2009.gif) : :![[thin space (1/6-em)]](https://www.rsc.org/images/entities/char_2009.gif) 2 2 |
4329.5 | 2600.7 | 0.3993 |
| Polymer 2 | 1![[thin space (1/6-em)]](https://www.rsc.org/images/entities/char_2009.gif) : :![[thin space (1/6-em)]](https://www.rsc.org/images/entities/char_2009.gif) 4 4 |
4218.6 | 2447.2 | 0.4199 |
| Polymer 3 | 1![[thin space (1/6-em)]](https://www.rsc.org/images/entities/char_2009.gif) : :![[thin space (1/6-em)]](https://www.rsc.org/images/entities/char_2009.gif) 6 6 |
4059.3 | 2399.5 | 0.4089 |
3.2 Characterization of MIPs with magnetic quantum dots
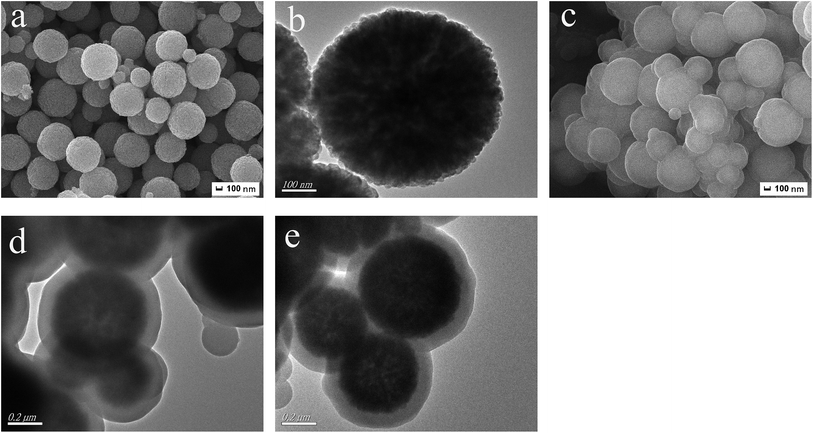
The size and morphology of Fe3O4, MQDs and MQDs–MIPs were examined by SEM and TEM. Fig. 1a and b are the SEM and TEM images of the prepared Fe3O4 microspheres, which were monodisperse and spherical and their diameter was 550 nm. After coating with silica, Mn-doped ZnS QDs and silica, core–shell MQDs–MIPs microspheres, MQDs, were obtained. From Fig. 1c and d, we can see that the MQDs is about 710 nm in diameter with a thin layer of 80 nm, clearly revealing that the magnetic microspheres were highly spherical with a smooth surface. Fig. 1e shows the spherical and uniform structure of MQDs–MIPs with a diameter of about 750 nm. The MIPs layer thickness is estimated to be about 20 nm.In Fig. S1,† lines a, b and c are the FT-IR spectra of Fe3O4, MQDs and MQDs–MIPs, respectively. As shown in spectrum a, the strong characteristic absorption peak at about 586 cm−1 is a characteristic of Fe–O vibration. As shown in spectrum b, the bands at 790 and 458 cm−1 indicate the presence of Si–O in SiO2. The characteristic peaks at about 3435 cm−1, 1620 cm−1 and 1090 cm−1 are attributed to vibration absorption of –OH and Si–O, indicating that SiO2–QDs–SiO2@Fe3O4, MQDs, have been modified by MPTS. For spectrum c, the characteristic bands at 1238 cm−1 and 1150 cm−1 (C–O–C stretching) and 1730 cm−1 (C![[double bond, length as m-dash]](https://www.rsc.org/images/entities/char_e001.gif) O stretching) are attributed to the crosslinker (EGDMA). In the spectra, the peaks at 1395 cm−1 could be attributed to the stretching vibration of C–N. The secondary amine groups were at 3315 cm−1 and 1618 cm−1. All these results showed that an imprinted polymer layer was successfully prepared on the surface of the MQDs.
O stretching) are attributed to the crosslinker (EGDMA). In the spectra, the peaks at 1395 cm−1 could be attributed to the stretching vibration of C–N. The secondary amine groups were at 3315 cm−1 and 1618 cm−1. All these results showed that an imprinted polymer layer was successfully prepared on the surface of the MQDs.
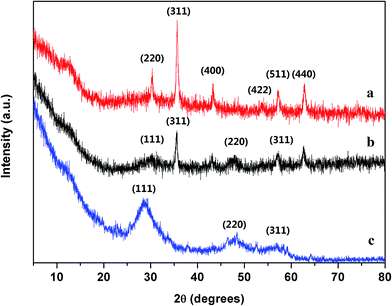
The XRD patterns of Fe3O4, Mn doped ZnS QDs and MQDs–MIPs are shown in Fig. 2. As shown in pattern a, the peak positions at the corresponding b values are indexed to (220), (311), (400), (422), (511) and (440), indicating that a spinel structure of Fe3O4 has been synthesized. In Fig. 2, the crystal structures of the pattern c sample is cubic zinc blende, and the peak positions are at (111), (220), and (311), indicating that Mn doped ZnS QDs have been synthesized. As shown in pattern b, the characteristic peaks of Fe3O4 and Mn doped ZnS QDs are observed, which are at the same positions. However, the intensities of the characteristic peaks were weaker, may be because of the effect of the amorphous silica shell and MIP, which suggests that the MIPs were prepared on the surface of the Fe3O4 coating with silica and Mn doped ZnS QDs. Moreover, we have added the data of ZnS from the Joint Committee on Powder Diffraction Standards (JCPDS), which have been plotted in Fig. S3.† It shown that pure phase of the Mn doped ZnS QDs have been synthesized.
VSM was employed to characterize the magnetic properties of Fe3O4 (a), MQDs (b) and MQDs–MIPs (c); the saturation magnetization (Ms) values were 84.68, 36.55 and 17.20 emu g−1, respectively. As shown in Fig. 3, the magnetic hysteresis loops of the three curves have a similar general shape and are symmetrical in the origin, indicating that the samples showed superparamagnetic behavior. After the absence of magnetic field, the superparamagnetism of MQDs–MIPs could prevent from aggregating. Compared to the initial Ms value of Fe3O4, after the formation of SiO2, the Ms values of both MQDs and MQDs–MIPs were decrease. However, the MQDs–MIPs still possessed enough magnetic strength to meet the needs of magnetic separations, as can be observed in picture in the inset.
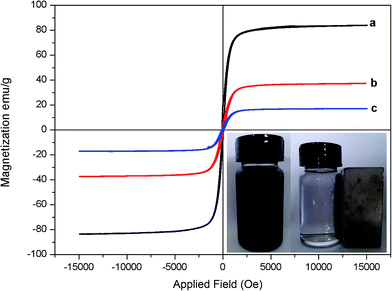 | ||
| Fig. 3 VSM magnetization curves of Fe3O4 (a), MQDs (b) and MQDs–MIPs (c). The inset shows the separation process of a solution of MQDs–MIPs in the presence of an external magnetic field. | ||
3.3 Fluorescence properties of the MQDs–MIPs
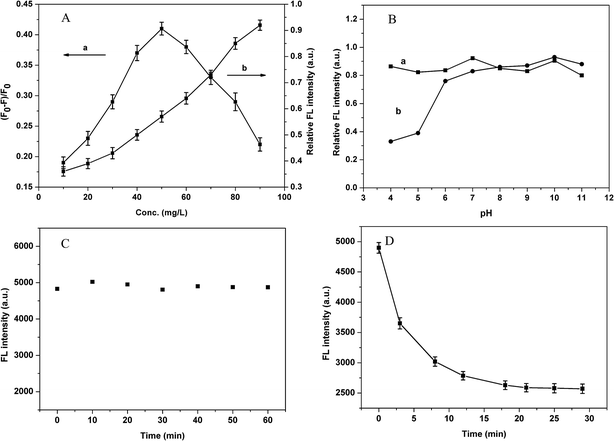
As we know, the concentration of MQDs–MIPs plays an important function in the DBP analysis system. The variation rate of FL quenching efficiency determines the sensitivity. High FL intensity of MQDs–MIPs could allow a wide range of determination.27 Different concentrations of MQDs–MIPs were used to evaluate the effects on the DBP detection system. As shown in Fig. 4A, the FL intensity has a linear relationship with the concentration of MQDs–MIPs from 10 mg L−1 to 90 mg L−1. When the amount of MQDs–MIPs is low, although there is obvious FL quenching and good sensitivity, the linear range will be narrow; when the amount is at higher levels, the FL quenching rate is relatively small. In consideration of these two key points (sensitivity and linear range), the optimum value of MIPs used was 70 mg L−1 for the subsequent studies.We investigated the influence of pH on the FL intensity of Mn doped ZnS QDs and MQDs–MIPs, and the results are shown in Fig. 4B. When the pH of the medium was below 6.0, the FL intensity of Mn doped ZnS QDs decreased sharply. The reason for this is that the Mn doped ZnS was unstable and generated smelly H2S gas. When pH ranged from 6.0 to 11.0, the FL of Mn doped ZnS was relatively stable. Moreover, the MQDs–MIPs were relatively stable, which indicates that pH had almost no influence on the FL property and intensity of Mn doped ZnS QDs, maybe because of the silica shell and the polymer shell on the surface of QDs. Thus, we do not have to consider the effect of solution acidity on the determination of performance.
In order to investigate the FL stability of MQDs–MIPs, the optical sensor was mixed in a colorimetric tube and the FL intensity was noted every 10 min at room temperature. As shown in Fig. 4C, the FL intensity of MQDs–MIPs was stable within 60 min, which indicates that the MQDs–MIPs could maintain stability over the entire measurement time. The reason is that the silica shell and the polymer shell on the surface of QDs protected them from the mixed solution.
DBP with a concentration of 35 μmol L−1 mixed with MQDs–MIPs (70 mg L−1) was used to determine the optimal time. Fig. 4D displays the results by recording the FL intensity at different time intervals. It was found that the relative FL intensity decreased in the beginning, and it remained constant after 21 min. Therefore, the MQDs–MIPs had a high sensitivity for the detection of DBP, and 21 min was used as the optimal detection time for further studies.
3.4 Sensitivity of the MQDs–MIPs
To further evaluate the recognition and quantitative determination ability of MQDs–MIPs, the detection limit and linear range were investigated. The relationship between the FL intensity and the concentration of DBP can be described by the following formula:| F0/F = 1 + KSV[C] | (1) |
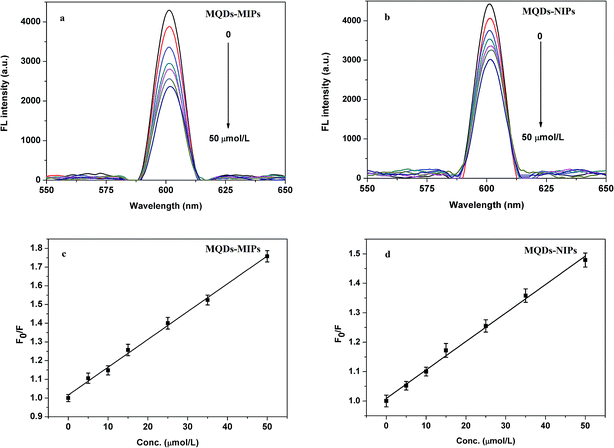 | ||
| Fig. 5 Fluorescence spectra of MQDs–MIPs (a) and MQDs–NIPs (b) (70 mg L−1) with the indicated concentrations of DBP in water solution and the Stern–Volmer plots for MQDs–MIPs (c) and MQDs–NIPs (d). | ||
3.5 Regeneration performance of the MQDs–MIPs
As is well known, desorption and regeneration are important indexes for the application of a sensor. Adsorption–desorption experiment was carried out to further investigate the stability and repeatability of the MQDs–MIPs. The optical sensor and DBP were mixed in a colorimetric tube and the FL intensity was detected. Then, the MQDs–MIPs were removed from the rebound template molecules (DBP) using ethanol. In this way, the FL intensity was detected 6 times. As shown in Fig. S2,† the sensor could be reused 6 times without an obvious change in the FL intensity. The results indicated that the sensor could exhibit continuous superior performance in a cyclic DBP FL detection.3.6 Selectivity of the MQDs–MIPs
The effect of interference of ions on the FL intensity of MQDs–MIPs was studied. The results showed that these ions have no influence on the FL intensity of MQDs–MIPs in detecting DBP (Table S1†). Several types of plasticizers (namely, DEP, DAP and DMP) were used to assess the selectivity of the MQDs–MIPs. It could be found from Fig. 6 that the FL quenching constant was the highest for DBP among these molecules. The results indicated that the MQDs–MIPs have better selectivity toward DBP. Compare with MQDs–MIPs, the MQDs–NIPs show a similar FL intensity for DEP, DAP and DMP. This phenomenon may be due to the fact that in MQDs–MIPs, specific recognition sites complementary with the imprinted cavities in terms of shape, size and spatial arrangement were generated during the process of preparation. The FL quenching mechanism could be due to the photo-induced electron transfer process. Under photo-irradiation, the electrons of QDs are in an excited state and are transferred from the QDs to the DBP.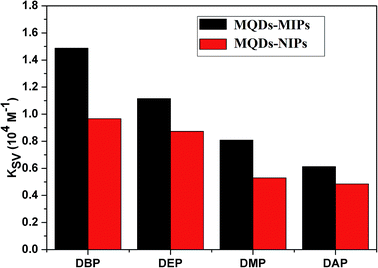 | ||
| Fig. 6 Quenching constant of MQDs–MIPs and MQDs–NIPs by different kinds of structures similar to DBP. | ||
3.7 Method performance comparison
The performance of the developed fluorescence sensor method was compared with some reported MIPs based QDs methods. As listed in Table S2,† CdSe/ZnS QDs–MIP can qualitatively detect caffeine,28 but it cannot meet the needs of the quantitative detection. There have been some reported quantitative analysis of MIPs–ZnS![[thin space (1/6-em)]](https://www.rsc.org/images/entities/char_2009.gif) :
:![[thin space (1/6-em)]](https://www.rsc.org/images/entities/char_2009.gif) Mn QDs for 2,6-dichlorophenol,29 MIP-coated CdTe QDs for cytochrome c30 and MIP-capped CdTe QDs for 2,4,6-trinitrotoluene31 but with low sensitivity. Besides, the prepared ZnS/Mn QDs@MIP for diazinon32 and MIP-coated CdSe QDs for ractopamine33 attain relatively high sensitivity, but their response time is relatively long. Excitingly, in this work, our method integrated the high selectivity of MIPs and strong fluorescence property of Mn doped ZnS QDs and easy separation of magnetic nanoparticles. The developed Fe3O4@SiO2–QDs–MIPs sensor system has demonstrated high sensitivity and rapid response for the fluorescent detection of DBP. In addition, magnetic Fe3O4 can facilitate the separation of MIPs at the end of their adsorption. The sensor has remarkable advantages such as rapidity, excellent fluorescence, good stability, strong magnetism, and admirable selectivity and sensitivity.
Mn QDs for 2,6-dichlorophenol,29 MIP-coated CdTe QDs for cytochrome c30 and MIP-capped CdTe QDs for 2,4,6-trinitrotoluene31 but with low sensitivity. Besides, the prepared ZnS/Mn QDs@MIP for diazinon32 and MIP-coated CdSe QDs for ractopamine33 attain relatively high sensitivity, but their response time is relatively long. Excitingly, in this work, our method integrated the high selectivity of MIPs and strong fluorescence property of Mn doped ZnS QDs and easy separation of magnetic nanoparticles. The developed Fe3O4@SiO2–QDs–MIPs sensor system has demonstrated high sensitivity and rapid response for the fluorescent detection of DBP. In addition, magnetic Fe3O4 can facilitate the separation of MIPs at the end of their adsorption. The sensor has remarkable advantages such as rapidity, excellent fluorescence, good stability, strong magnetism, and admirable selectivity and sensitivity.
3.8 Analytical applications in tap water samples
DBP in varying concentrations was added to real water samples in order to examine the applicability of MQDs–MIPs. The detection results showed that tap water does not contain DBP. In this experiment, we used standard addition method to analyse the recovery with DBP concentrations of 5.0, 15.0, and 20.0 μmol L−1 (Table 2). For each concentration, three parallel experiments were conducted. The recoveries of all the samples were above 99.45% with a relative standard deviations (RSD) below 1.97%. The results showed that the MQDs–MIPs have potential applicability for DBP detection in real samples.| Sample | Concentration of template (μmol L−1) | Recovery (%) | RSD (n = 3) (%) | |
|---|---|---|---|---|
| Amount added | Amount found | |||
| Tap water | 5 | 5.17 | 103.4 | 3.37 |
| Tap water | 15 | 15.08 | 100.53 | 2.12 |
| Tap water | 20 | 19.89 | 99.45 | 1.97 |
4. Conclusions
In summary, MIPs based on Mn doped ZnS QDs and magnetic Fe3O4 were synthesized for the detection of DBP. The composite integrated the high selectivity of MQDs–MIPs, strong fluorescence property of Mn doped ZnS QDs and easy separation of magnetic nanoparticles. The MQDs–MIPs had outstanding properties, such as excellent photology, good stability, and high selectivity and sensitivity. In addition, the MQDs–MIPs have a magnetic strength value of 17.20 emu g−1, which is an effective trait to separate pollutants from real samples. Under optimal conditions, the MQDs–MIPs were highly sensitivity to DBP, which caused a significant change in the fluorescence intensity. Furthermore, MQDs–MIPs were successfully used for the detection of DBP in tap water samples, with a detection limit of 0.08 μmol L−1.Conflicts of interest
There are no conflicts to declare.Acknowledgements
The authors would like to thank the National Natural Science Foundation of China (No. 21677064), the Jiangsu Natural Science Foundation of China (BK20151323, BK20151337) and the innovation/entrepreneurship program of Jiangsu Province (Surencaiban [2015] 26) for financial support to carry out this work.References
- D. Koniecki, R. Wang, R. P. Moody and J. Zhu, Environ. Res., 2011, 111, 329–336 CrossRef CAS PubMed.
- S. Singh and S. S. L. Li, Gene, 2012, 494, 85–91 CrossRef CAS PubMed.
- C. Bach, X. Dauchy, M. C. Chagnon and S. Etienne, Water Res., 2012, 46, 571–583 CrossRef CAS PubMed.
- J. He, R. Lv, J. Zhu and K. Lu, Anal. Chim. Acta, 2010, 661, 215–221 CrossRef CAS PubMed.
- A. Garrido-Frenich, F. J. Arrebola, M. J. González-Rodríguez, J. L. M. Vidal and N. M. Díez, Anal. Bioanal. Chem., 2003, 377, 1038–1046 CrossRef CAS PubMed.
- M. Castillo and D. Barceló, Anal. Chim. Acta, 2001, 426, 253–264 CrossRef CAS.
- D. Lakshmi, A. Bossi, M. J. Whitcombe, I. Chianella, S. A. Fowler, S. Subrahmanyam, E. V. Piletska and S. A. Piletsky, Anal. Chem., 2009, 81, 3576–3584 CrossRef CAS PubMed.
- T. Alizadeh, M. Zare, M. R. Ganjali, P. Norouzi and B. Tavana, Biosens. Bioelectron., 2010, 25, 1166–1172 CrossRef CAS PubMed.
- Q. Zhong, Y. Hu, Y. Hu and G. Li, J. Chromatogr. A, 2012, 1241, 13–20 CrossRef CAS PubMed.
- G. Wulff and J. Liu, Acc. Chem. Res., 2012, 45, 239–247 CrossRef CAS PubMed.
- P. Yáñez-Sedeño, S. Campuzano and J. M. Pingarrón, Anal. Chim. Acta, 2017, 960, 1–17 CrossRef PubMed.
- J. R. Wei, Y. L. Ni, W. Zhang, Z. Q. Zhang and J. Zhang, Anal. Chim. Acta, 2017, 960, 110–116 CrossRef CAS PubMed.
- S. R. Liang, H. Y. Yan, J. K. Cao, Y. H. Han, S. G. Shen and L. G. Bai, Anal. Chim. Acta, 2017, 951, 68–77 CrossRef CAS PubMed.
- J. Wang, C. Jiang, X. Wang, L. Wang, A. Chen, J. Hu and Z. Luo, Analyst, 2016, 114, 4564–4601 Search PubMed.
- C. P. Huang, Y. K. Li and T. M. Chen, Biosens. Bioelectron., 2007, 22, 1835–1838 CrossRef CAS PubMed.
- E. R. Goldman, I. L. Medintz, J. L. Whitley, A. Hayhurst, A. R. Clapp, H. T. Uyeda, J. R. Deschamps, M. E. Lassman and H. Mattoussi, J. Am. Chem. Soc., 2005, 127, 6744–6751 CrossRef CAS PubMed.
- J. Liang, S. Huang, D. Zeng, Z. He, X. Ji, X. Ai and H. Yang, Talanta, 2006, 69, 126–130 CrossRef CAS PubMed.
- M. Matczuk, J. Legat, A. R. Timerbaev and M. Jarosz, Analyst, 2016, 141, 2574–2580 RSC.
- S. Huang, Q. Xiao, R. Li, H. Guan, J. Liu, X. Liu, Z. He and Y. Liu, Anal. Chim. Acta, 2009, 645, 73–78 CrossRef CAS PubMed.
- N. Ertas and H. E. Satana Kara, Biosens. Bioelectron., 2015, 70, 345–350 CrossRef CAS PubMed.
- X. Wei, Z. P. Zhou, T. F. Hao, H. J. Li and Y. S. Yan, RSC Adv., 2015, 5, 19799–19806 RSC.
- C. X. Qiu, Y. H. Xing, W. M. Yang, Z. P. Zhou, Y. C. Wang, H. Liu and W. Z. Xu, Appl. Surf. Sci., 2015, 345, 405–417 CrossRef CAS.
- E. V. Piletska, B. H. Abd, A. S. Krakowiak, A. Parmar, D. L. Pink, K. S. Wall, L. Wharton, E. Moczko, M. J. Whitcombe, K. Karim and S. A. Piletsky, Analyst, 2015, 140, 3113–3120 RSC.
- T. Madrakian, M. Ahmadi, A. Afkhami and M. Soleimani, Analyst, 2013, 138, 4542–4549 RSC.
- T. Jing, H. Du, Q. Dai, H. Xia, J. Niu, Q. Hao, S. Mei and Y. Zhou, Biosens. Bioelectron., 2010, 26, 301–306 CrossRef CAS PubMed.
- C. Y. Wang, G. M. Zhu, Z. Y. Chen and Z. G. Lin, Mater. Res. Bull., 2002, 37, 2525–2529 CrossRef CAS.
- H. Wei, Y. Y. Wang and E. Song, Acta Chim. Sin., 2011, 69, 2039–2046 CAS.
- C. I. Lin, A. K. Joseph, C. K. Chang and Y. D. Lee, Biosens. Bioelectron., 2004, 20, 127–131 CrossRef CAS PubMed.
- J. F. Yin, Y. Cui, G. L. Yang and H. L. Wang, Chem. Commun., 2010, 46, 7688–7690 RSC.
- W. Zhang, X. W. He, Y. Chen, W. Li and Y. Zhang, Biosens. Bioelectron., 2011, 26, 2553–2558 CrossRef CAS PubMed.
- S. Xu, H. Lu, J. Li, X. Song, A. Wang, L. Chen and S. Han, ACS Appl. Mater. Interfaces, 2013, 5, 8146–8154 CAS.
- Y. Zhao, Y. Ma, H. Li and L. Wang, Anal. Chem., 2011, 84, 386–395 CrossRef PubMed.
- H. Liu, G. Fang and S. Wang, Biosens. Bioelectron., 2014, 55, 127–132 CrossRef CAS PubMed.
Footnote |
| † Electronic supplementary information (ESI) available. See DOI: 10.1039/c7ra09145a |
| This journal is © The Royal Society of Chemistry 2017 |

