
 Open Access Article
 This Open Access Article is licensed under a
 Creative Commons Attribution 3.0 Unported Licence
Desorption and crystallisation of binary 2-propanol and water ices adsorbed on graphite
Sean A. Ayling,
Daren J. Burke,
Tara L. Salter and
Wendy A. Brown *
*
Division of Chemistry, University of Sussex, Falmer, Brighton, BN1 9QJ, UK. E-mail: w.a.brown@sussex.ac.uk
First published on 7th November 2017
Abstract
Alcohols, including 2-propanol, are important in a range of industrial applications, and are also found in cold astrophysical environments such as comets and interstellar space, where they are often frozen out on carbonaceous grain surfaces. In these regions, the interaction between alcohols and water ice plays a crucial role in the surface chemistry. We have therefore undertaken a detailed temperature programmed desorption (TPD) and reflection absorption infrared spectroscopy (RAIRS) investigation to elucidate the physical chemistry of the adsorption, desorption and crystallisation of 2-propanol and water ices adsorbed on graphite at 26 K. Hydrogen bonding plays a critical role in the physical chemistry of both pure 2-propanol and of binary ices containing 2-propanol and water ice. Monolayer 2-propanol physisorbs strongly on the graphite surface, and with increasing coverage, annealing leads to the desorption of first amorphous, and then crystalline, 2-propanol multilayers. Crystallisation is also evident in RAIR spectra, which show marked changes on annealing of the adsorbed 2-propanol layer. In binary ice systems containing amorphous solid water and 2-propanol, the desorption and crystallisation of the alcohol is modified. The water ice inhibits the 2-propanol crystallisation and gives rise to co-desorption in TPD. In addition, the 2-propanol also strongly influences the behaviour of the water, with even small amounts of the alcohol changing the crystallisation kinetics of water ice, leading to the desorption of water solely in its amorphous form.
1. Introduction
2-Propanol is important in a range of applications, including its use as an anti-freezing agent and as a solvent. It is particularly important in surface catalysis where a large body of literature describes its adsorption and reactivity. For example, adsorption on a range of surfaces including metals1–11 and metal-oxides12,13 leads mainly to the formation of an alkoxide species, which then undergoes dehydrogenation to form acetone and hydrogen, although dehydration and oxidative decomposition have also been observed. 2-Propanol adsorption on carbon and carbon supported metal catalysts has also been studied and gives rise to dehydrogenation products.14The behaviour of alcohols, including 2-propanol, adsorbed on dust grains and water ice is also of direct importance to the chemistry of the interstellar medium (ISM), where dust grain surfaces play a significant role in chemical processes15 (and references therein). A large number of complex organic molecules (COMs), defined as molecules containing 6 or more atoms,16 have been observed in the ISM, with alcohols playing an important role in interstellar chemistry.17 Methanol16,18–20 and ethanol21–23 have been detected in a range of environments, and methanol in particular plays an important role in the chemistry of the regions where it is found. Although 2-propanol remains undetected in the ISM, the C3H8O isomer, methoxyethane, has been detected, with theory indicating that 2-propanol will be more stable under interstellar conditions and is hence highly likely to be detected.24 Models predict that 2-propanol will have chemistry similar to that of ethanol, leading to the production of mixed and pure ethers when released into the gas phase of hot-core (proto-star) regions.17
With this in mind, we have undertaken a detailed study of the adsorption and desorption of 2-propanol on model dust grain surfaces. Dust grains are thought to be carbonaceous or silicaceous in nature,25,26 and are covered in icy mantles containing large amounts of water ice.27 Highly oriented pyrolytic graphite (HOPG) and two forms of water ice, amorphous solid water (ASW) and crystalline ice (CI), have therefore been used as analogues to investigate adsorption on icy grain surfaces. These are considered to be effective grain models.28,29 It is expected that the hydrogen-bonding ability of alcohols will affect their adsorption and desorption, particularly in the presence of water ice. Furthermore, alcohols have also been shown to affect the desorption and crystallisation kinetics of water ice itself. For example, methanol lowers the amorphous to crystalline phase transition temperature in water ice.30,31 The anti-freezing properties of 2-propanol, together with its ability to form complexes with water,32 suggest that it will also have an effect on the properties of water ice in astrophysical environments.
The adsorption and desorption of 2-propanol has been studied previously on a number of metal surfaces. Gleason et al. investigated its thermal chemistry on clean and oxygen pre-treated Ni(100) at 100 K using temperature programmed desorption (TPD), X-ray photoelectron spectroscopy and reflection absorption infrared spectroscopy (RAIRS).11 They found that 2-propanol adsorbs molecularly at 100 K with extensive hydrogen bonding between the chemisorbed species. Shorthouse et al. also studied 2-propanol adsorption on a Ni surface using RAIRS and TPD at 110 K.10 Multilayers formed on the Ni(111) surface at this temperature. RAIRS was also used by Camplin and McCash to investigate multilayer 2-propanol on an oxygen-modified Cu(100) surface, dosed at 78 K.9 Vannice et al. used RAIRS, high resolution electron energy loss spectroscopy and TPD to study 2-propanol adsorption and desorption on Pt(111).7 2-Propanol adsorbed exclusively molecularly at 85 K with TPD giving rise to a desorption energy of 42.8 kJ mol−1. In agreement with spectra recorded on other metal surfaces,9–11 the vibrational spectra for multilayer 2-propanol on Pt(111)7 compared well with liquid phase 2-propanol infrared spectra.3,8 A molecular dynamics study of 2-propanol adsorbed on Pt(111)33 investigated the binding energy with increasing coverage. They calculated a binding energy of ∼57 kJ mol−1 for the highest coverages of 2-propanol investigated.
In contrast to studies on metal surfaces, the adsorption and desorption of 2-propanol on carbonaceous and water ice surfaces has received considerably less attention. Schaff and Roberts used RAIRS and TPD to study the interaction of 2-propanol with amorphous and crystalline water ice at ∼95 K.34 Deuterium isotopes were employed to probe the role of hydrogen bonding. TPD gave desorption temperatures of 166 K and 175 K on amorphous ice, and 175 K on crystalline water ice. Desorption was zero or pseudo-zero order with an energy of 56 ± 1 kJ mol−1,34 in good agreement with theory on Pt(111).33 Finally, TPD studies of 2-propanol on single wall carbon nano-tubes (SWCNTs) found that multilayers desorbed at a temperature of 179 K giving a calculated desorption energy of 31.2 kJ mol−1 using first-order desorption kinetics.35
In this study we present a TPD and RAIRS investigation of the behaviour of 2-propanol on HOPG. In addition, we have also investigated the interaction between 2-propanol and water ice by studying layered and co-deposited mixed ices adsorbed on HOPG at 26 K. These studies allow us to obtain a detailed understanding of the physical chemistry of, and interactions between, 2-propanol molecules and 2-propanol and water ice. Elucidating details of pure 2-propanol ices is necessary for astrophysical studies in order to provide a baseline for the more complex behaviour of the ice in the presence of water. When compared with results previously obtained for methanol36–38 and ethanol39,40 on HOPG, data for 2-propanol/water ices will add to our fundamental knowledge of the surface chemistry of alcohols on grain analogues, particular with respect to COMs. The resulting desorption kinetics and behaviour of both 2-propanol and water ice can be subsequently applied to astronomical models.37
2. Experimental
All experiments were performed in an ultra-high vacuum (UHV) chamber with a base pressure ≤2 × 10⁻¹⁰ mbar. The chamber was equipped with a closed-cycle helium refrigerator, allowing the HOPG sample to be cooled to a base temperature of ∼26 K. HOPG samples were purchased from Goodfellows and were cleaved prior to installation in the UHV chamber by the Scotch Tape method.41 The temperature of the sample was monitored and controlled via a Eurotherm 2048 controller coupled to an E-type thermocouple. The sample was cleaned by annealing to 250 K prior to each experiment. Sample cleanliness was confirmed by TPD with no dose.2-Propanol (≥99.7%, BDH Laboratory Supplies Ltd.) and water ices and were grown in situ by background dosing via two high precision leak valves. 2-Propanol and deionized water were purified by repeated freeze–pump–thaw cycles prior to dosing. CI ices were grown by depositing 60 Lm of water at 26 K followed by a 3 minute anneal at 138 K, which gives rise to a 50 Lm thick crystalline ice. The crystallinity of the water ice film was confirmed by RAIRS. Doses were measured in Langmuir (1 Lm = 10−6 mbar s) and ranged from 1–50 Lm. To ensure similar water ice morphologies throughout all experiments, identical dosing pressures and sample orientations were employed. When dosing binary ices, the two species were introduced sequentially to form the layers or simultaneously to form intimate mixtures. The composition of the co-deposited ice was determined from the areas under the respective mass spectrometry traces recorded in the vapour phase during deposition. The percentage of 2-propanol in the mixed ices was calculated by integrating the areas under the resulting dose curves and correcting for mass spectrometer sensitivities. For all mixed ices, the water exposure was fixed at 50 Lm to ensure that the observed spectra were not affected by the water coverage. The percentages given are for 2-propanol concentrations with respect to 50 Lm of water ice.
RAIRS and TPD were used to investigate the properties of the ices on the HOPG surface. TPD traces were obtained with a Hiden Analytical pulse-counting quadrupole mass spectrometer (HAL 301/PIC). For all TPD experiments, the sample temperature was increased at a linear rate of 0.5 K s−1. A range of mass fragments was recorded for 2-propanol and each exhibited identical behaviour in TPD. Hence the most intense mass fragment (45 a.m.u.) was used for analysis. RAIR spectra were recorded with a Thermo Nicolet 6700 FTIR spectrometer coupled to a liquid nitrogen-cooled mercury-cadmium-telluride detector. RAIR spectra were recorded by the co-addition of 256 scans at a resolution of 4 cm−1. For RAIRS annealing experiments, the sample was heated to the target temperature and held for 3 minutes before cooling to base temperature.
3. Results and discussion
3.1. Pure 2-propanol on HOPG
Fig. 1 shows a RAIR spectrum for the adsorption of 50 Lm 2-propanol on HOPG at 26 K (Fig. 1A) followed by subsequent annealing to 120 K (Fig. 1B and C). Adsorption of increasing doses of 2-propanol (not shown) gives rise to bands increasing in intensity with increasing exposure, with no associated frequency shifts. This indicates that the structure of the adsorbed ice is not affected by exposure and hence 2-propanol is physisorbed on HOPG. Assignment of the peaks for the 2-propanol spectrum at 26 K (Fig. 1A) is made with reference to previous spectra of multilayer 2-propanol adsorbed on Ni,10 Cu9 and Pt surfaces7 as well as in the liquid phase.42 A summary of the assignments is given in Table 1.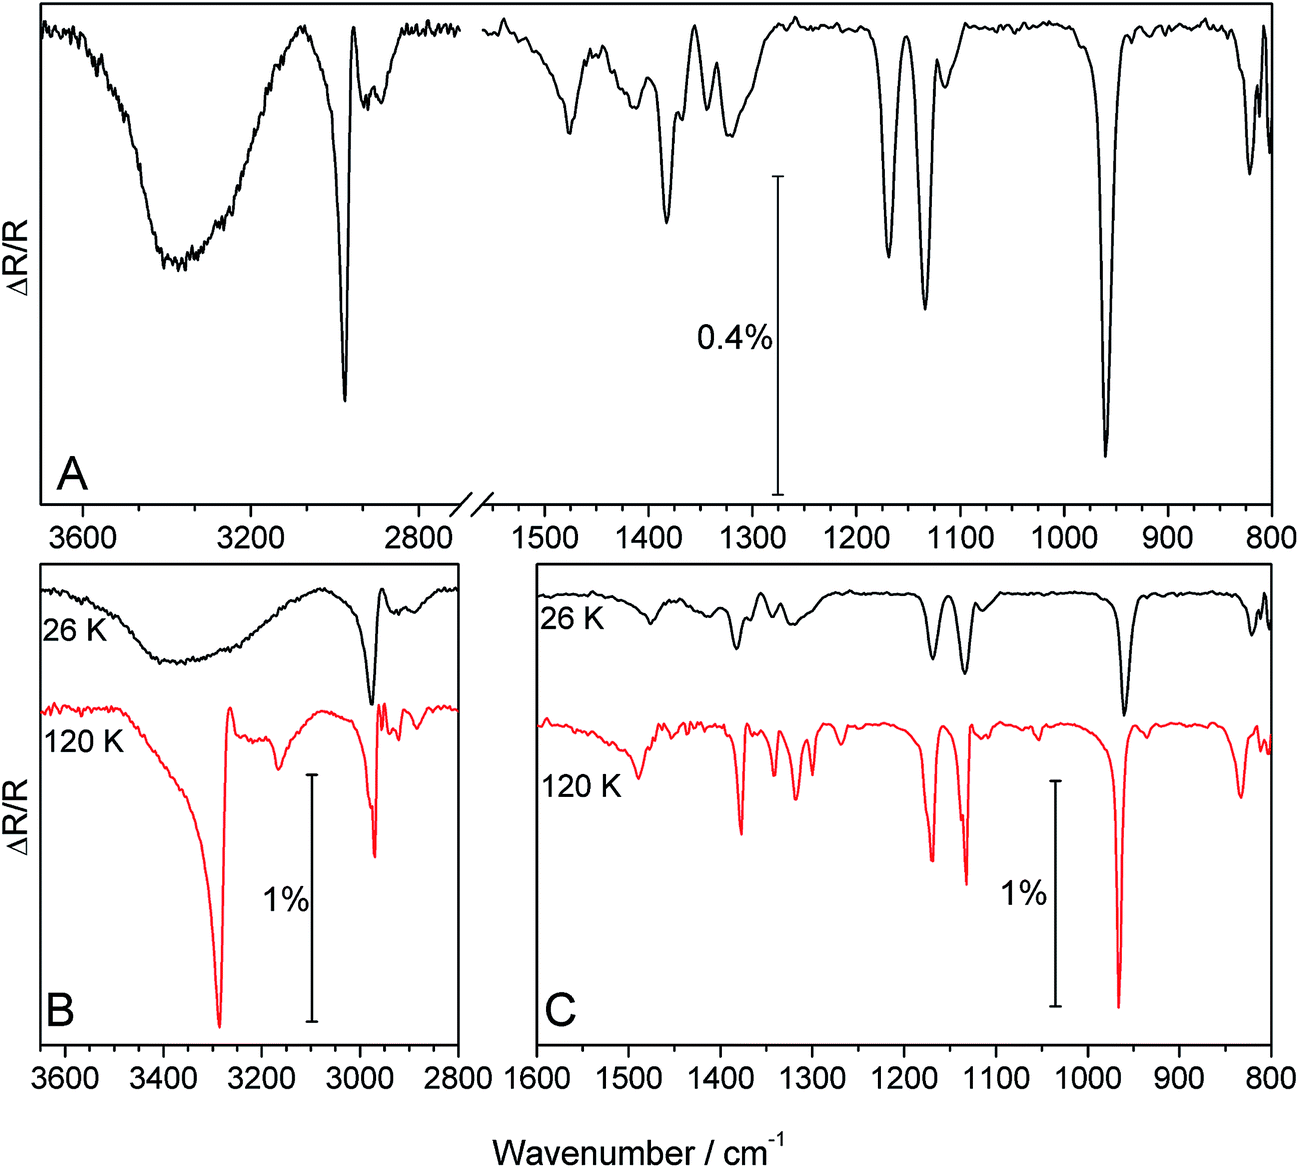 | ||
| Fig. 1 RAIR spectra showing the adsorption and annealing of 50 Lm of 2-propanol adsorbed on HOPG at 26 K. (A) RAIR spectrum at 26 K. (B) and (C) RAIR spectra comparing bands observed at 26 K and following annealing to 120 K. | ||
| Mode | HOPG (this study) | Ni(111)10 | Pt(111)7 | Cu(100)9 | Liquid42 | |
|---|---|---|---|---|---|---|
| Amorphous | Crystalline | |||||
| 26 K | 120 K | 110 K | 85 K | 78 K | ||
| Unassigned | 812 | 812 | ||||
| νs(C–C–C) | 822 | 833 | 823 | 820 | 820 | 818 |
| Unassigned | 936 | |||||
| ρ(CH3) | 960 | 966 | 940, 962 | 932, 960 | 960 | 953, 940, 921 |
| ν(C–O) | 1117 | 1054, 1116 | 1109 | 1107 | 1031, 1114 | 1069 |
| ρ(CH3) | 1134 | 1132, 1138 | 1134 | 1133 | 1133 | 1130 |
| νas(C–C–C) | 1169 | 1169, 1174 | 1171 | 1168 | 1168 | 1162 |
| H–C–OH | 1268 | — | 1260 | — | 1256 | |
| Association | 1325 | 1300, 1318 | 1325 | 1316 | 1322 | 1311 |
| Ω(CH) | 1344 | 1341 | 1342 | 1342 | 1342 | 1342 |
| δs(CH3) | 1383 | 1377 | 1369, 1381 | 1391 | 1367, 1381 | 1372, 1382 |
| Association | 1412 | 1413 | 1412 | 1418 | 1412 | |
| δas(CH3) | 1475 | 1489 | 1472 | 1471 | 1473 | 1470 |
| νs(CH3)/νs(CH) | 2889 | 2884 | 2884 | 2883 | 2882 | 2894 |
| νas(CH3)/νs(CH3) | 2922, 2931 | 2922, 2940 | 2938 | 2943 | 2940 | 2938 |
| Unassigned | 2956 | |||||
| νas(CH3) | 2976 | 2979, 2971 | 2977 | 2974 | 2972 | 2978 |
| ν(O–H) | 3400 | 3286, 3166 | 3305 | 3300 | — | 3350 |
There are several main features in the 2-propanol spectrum at 26 K. The main ν(O–H) band at ∼3400 cm−1 is very broad, consistent with the presence of hydrogen-bonding. There are strong, sharp peaks at 2976 cm−1 assigned to νas(CH3), at 1169 and 1134 cm−1 assigned to νas(C–C–C) and ρ(CH3) modes respectively, and at 960 cm−1 assigned to the ρ(CH3) mode. More moderate in intensity, but still clearly defined, are peaks at 1475 and 1383 cm−1 assigned to the δas(CH3) and δs(CH3) bands respectively. These bands are expected for condensed phase 2-propanol and are in good agreement with previous spectra.7,9,10,42
Following adsorption, the deposited ice was annealed to investigate the thermal processing. Annealing from 26 K to 110 K shows a gradual change in the ν(O–H) band (not shown) which shifts from ∼3400 cm−1 (26 K) to 3325 cm−1 (110 K) with an associated increase in intensity. There are no other changes to the remaining bands over this temperature range. However, following annealing to 120 K there are dramatic changes across the entire spectrum, as shown in Fig. 1B and C. The most striking change occurs to the ν(O–H) band which sharpens considerably and shifts to 3286 cm−1. Several other changes are observed, including an increase in intensity of many of the bands and the appearance of new bands at 3166 and 2956 cm−1. Several of the bands also split and shift in wavenumber (Table 1). Similar spectral changes have also been observed following the annealing of methanol and ethanol ices deposited at low temperature36,39 and are indicative of crystallisation of the ice. Hence, the changes observed in Fig. 1 upon annealing of 2-propanol are assigned to crystallisation. The crystal structure of 2-propanol has been studied by Cirkel and Boese43 who found a helical chain structure linked by repeating O–H⋯O hydrogen bonds. Crystallisation of 2-propanol on HOPG is coverage dependent, since 20 Lm 2-propanol does not exhibit any spectral changes upon annealing.
Fig. 2A and B show TPD traces recorded for 2-propanol desorption from HOPG following deposition at 26 K. For low exposures (Fig. 2A), a single peak is observed which varies in peak temperature from 143 K (1 Lm) to 141 K (10 Lm). With increasing exposure (Fig. 2B) a second peak is seen to grow into the spectrum which appears at 138 K (15 Lm). This peak increases in temperature with increasing exposure, with a peak temperature of 144 K up to an exposure of 50 Lm. The peak that appears initially is assigned to the desorption of physisorbed monolayer 2-propanol adsorbed on HOPG. This is confirmed by the approximately constant peak temperature, centred at around 141–143 K, and the fact that increasing exposure gives rise to TPD traces that do not share leading edges.
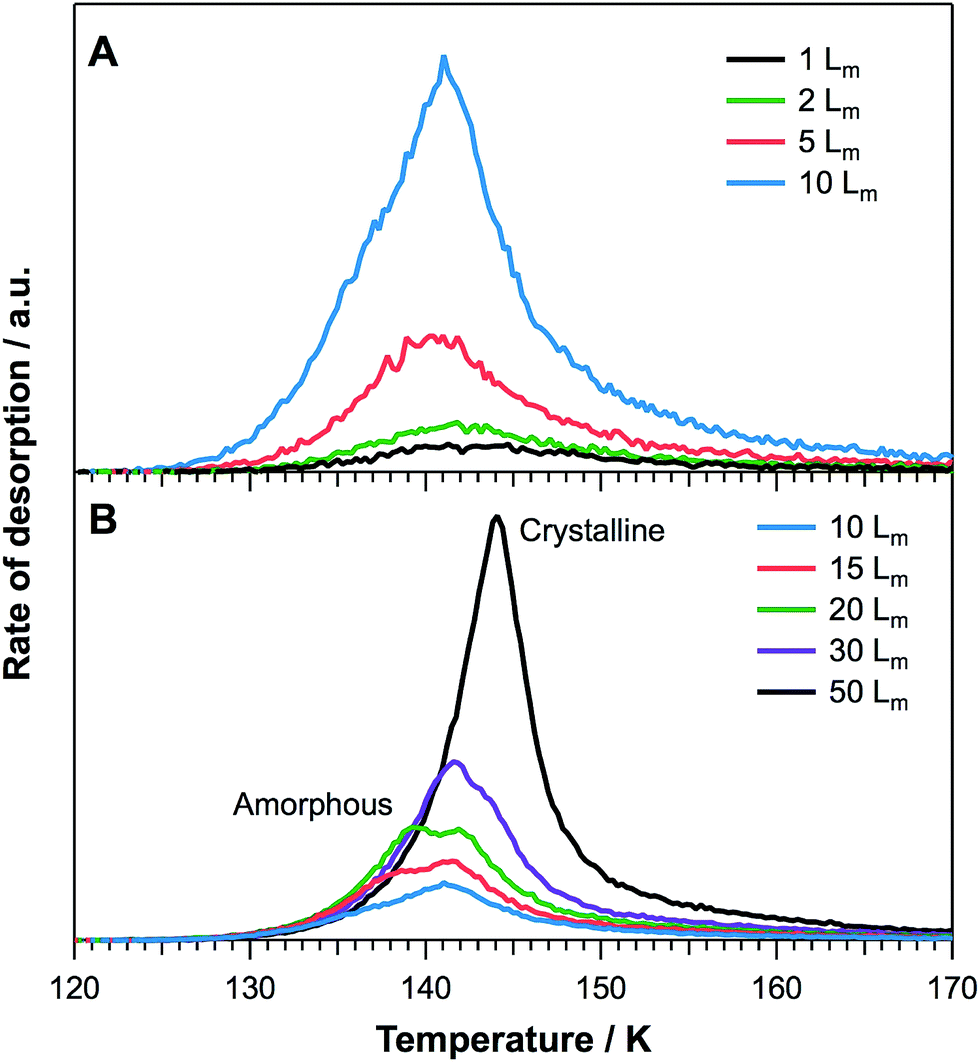 | ||
| Fig. 2 TPD spectra for 2-propanol deposited on HOPG at 26 K. (A) Low exposures showing monolayer formation from 1–10 Lm. (B) High exposures from 10–50 Lm showing the development of amorphous and crystalline multilayers. | ||
The second peak to appear in the spectrum can be assigned to the desorption of multilayer 2-propanol. This multilayer initially desorbs as amorphous 2-propanol for exposures of 15 and 20 Lm. For higher exposures (≥30 Lm), RAIR spectra (Fig. 1) show that 2-propanol undergoes a structural change, assigned to the formation of crystalline ice. Hence, for 30 and 50 Lm exposures, 2-propanol desorbs as a crystalline phase. This observation accounts for the fact that the TPD traces for exposures ≤20 Lm do not share leading edges with higher exposures.
Similar behaviour is observed for the desorption of water ice, where amorphous and crystalline phases desorb at different rates. This manifests itself as a distinctive bump on the leading edge of water TPD spectra.44 However, the phase change of 2-propanol occurs approximately 30 K prior to desorption, therefore leading to the observation of divergent leading edges in the TPD peaks for amorphous and crystalline 2-propanol. The same effect of divergent leading edges in the TPD has also been seen for glycolaldehyde on HOPG at 26 K.28
Quantitative analysis of the TPD spectra shown in Fig. 2 is reported in Table 2. The methodology employed has been described in detail previously.15 The order of desorption is obtained from the gradient of a plot of ln[I(T)] against ln[θrel] for a series of TPD curves of varying initial coverage at fixed temperature. Here I(T) is the recorded mass spectrometer intensity and θrel is the area under the relevant TPD curve. The calculation is performed at a range of fixed temperatures to determine an average value for the desorption order. Errors for the desorption order and other parameters are estimated as twice the standard error of the mean. The order of desorption for monolayer 2-propanol is 1.23 ± 0.03 with an energy ranging from ∼45–50 kJ mol−1, increasing with coverage (Fig. 3). The resulting average desorption energy for the monolayer is 46.6 ± 3.7 kJ mol−1. This desorption energy is lower compared to 57.3 kJ mol−1 reported for 2-propanol desorption from SWCNTs.35 However, this is unsurprising due to the unsaturated surface of SWCNTs, which is likely to give rise to stronger bonding. As seen in Table 2, the monolayer pre-exponential factor is calculated as 1012.9±0.3 s−1 (first-order units reported here for simplicity). This is a reasonable value for monolayer desorption, and compares with that observed for other species.15
| Species | Order, n | Energy, Edes (kJ mol−1) | Pre-exponential, νn |
|---|---|---|---|
| Monolayer | 1.23 ± 0.03 | 46.6 ± 3.7 | 1012.9±0.3 s−1 |
| Amorphous multilayer | ∼0 | 50.4 ± 1.2 | 1035.8±0.5 molecules per m2 per s |
| Crystalline multilayer | 53.6 ± 2.0 |
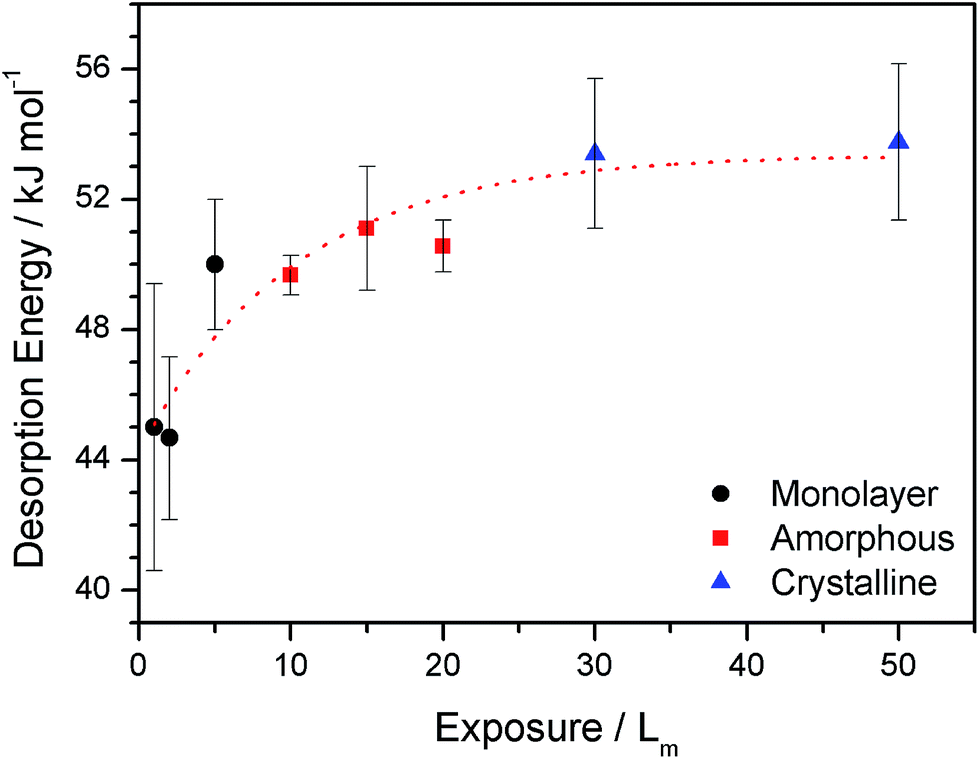 | ||
| Fig. 3 Calculated desorption energies for monolayer (circles) and amorphous (squares) and crystalline (triangles) multilayer 2-propanol as a function of exposure. The desorption energies were determined from the TPD data shown in Fig. 2. | ||
The observed fractional order of desorption (Table 2) for monolayer 2-propanol is evidence for intermolecular interactions between 2-propanol molecules on the HOPG surface, leading to the formation of islands. This is consistent with the TPD spectra which show the continuous evolution of the monolayer peak, even at exposures where multilayers begin to grow into the spectrum. This islanding suggests that interactions between 2-propanol molecules are stronger than those between 2-propanol and the HOPG surface. This is not surprising due to the presence of the hydrogen bonding alcohol group in 2-propanol. This is shown in Fig. 3, where the desorption energy of 2-propanol increases with increasing exposure. Molecular dynamics simulations for 2-propanol on Pt(111) show an increasing adsorption energy with an increasing number of 2-propanol molecules, in excellent agreement with Fig. 3.33 This increase in energy was attributed to the formation of hydrogen bonds between the 2-propanol molecules. Similar islanding behaviour, where hydrogen bonding becomes important with increasing coverage, has also been observed for methanol and ethanol adsorbed on HOPG.36,40
For the multilayer, the order of desorption is zero, as expected. Fig. 2 shows that 2-propanol desorbs as both amorphous and crystalline forms, as confirmed by RAIR spectra. Furthermore, Fig. 3 clearly shows two different multilayer energy regimes, which can hence be assigned to the different desorption energies of the amorphous and crystalline forms of 2-propanol. From Fig. 3, the desorption energy of amorphous 2-propanol is 50.4 ± 1.2 kJ mol−1 (10–20 Lm) and that for crystalline 2-propanol is slightly higher at 53.6 ± 2.0 kJ mol−1. As the multilayer energies are higher than the energy for the monolayer, this indicates that there are stronger interactions between molecules within the bulk 2-propanol ice than between the 2-propanol monolayer and the surface. The pre-exponential factor for the multilayer is 1035.8±0.5 molecules per m2 per s1, which is similar to that obtained for multilayer ethanol ices on HOPG.39
The desorption energy for multilayer 2-propanol compares well with other experimentally determined alcohol multilayer energies on graphitic surfaces. For example, the 2-propanol energy is similar to that found by Smith et al. for multilayer ethanol adsorbed on graphene (50.8 kJ mol−1)44 and by Burke et al. for multilayer and bilayer ethanol on HOPG (56.3 kJ mol−1).39 The multilayer desorption energy is also in very good agreement with that derived theoretically for 2-propanol adsorption on Pt(111), which lies in the range of 55–57 kJ mol−1.33 However, the desorption energy is considerably higher than that derived by Goering et al.35 for multilayer 2-propanol on SWCNTs (31.2 kJ mol−1) and Vannice et al. on Pt(111)7 (42.8 kJ mol−1). It is likely that this difference arises from the use of a first-order pre-exponential factor to derive the desorption energy in both of these cases.
3.2. The effects of water on 2-propanol
To investigate the interactions of 2-propanol with water ice, three binary ice configurations were grown: 2-propanol on ASW, 2-propanol on CI and co-deposited mixtures of 2-propanol and water ice. Fig. 4 shows TPD spectra for the desorption of 2-propanol from various binary water ices. For reference, and to assist with peak assignments, Fig. 5 shows a comparison of 20 Lm of 2-propanol desorbing from all three ice configurations in addition to 20 Lm of pure 2-propanol.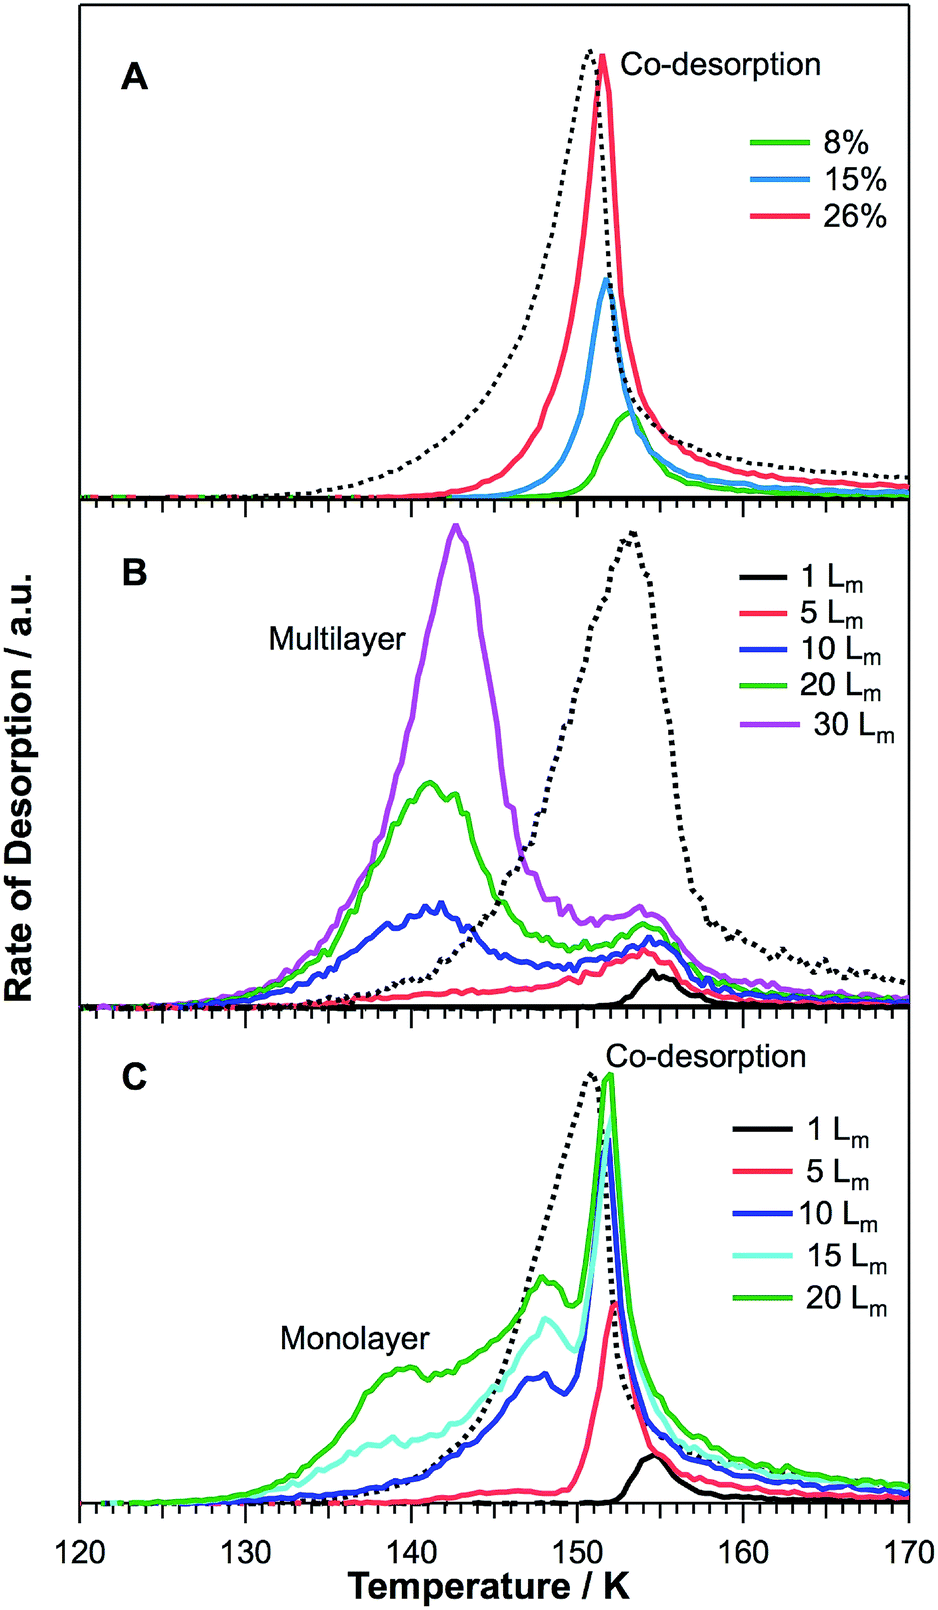 | ||
| Fig. 4 TPD spectra for binary ices of 2-propanol and water adsorbed on HOPG at 26 K. (A) TPD spectra for co-deposited ices. (B) TPD traces following increasing exposure of 2-propanol on CI. (C) TPD traces following increasing exposure of 2-propanol on ASW. In all cases a representative water desorption trace (dotted trace) has been included for comparison. | ||
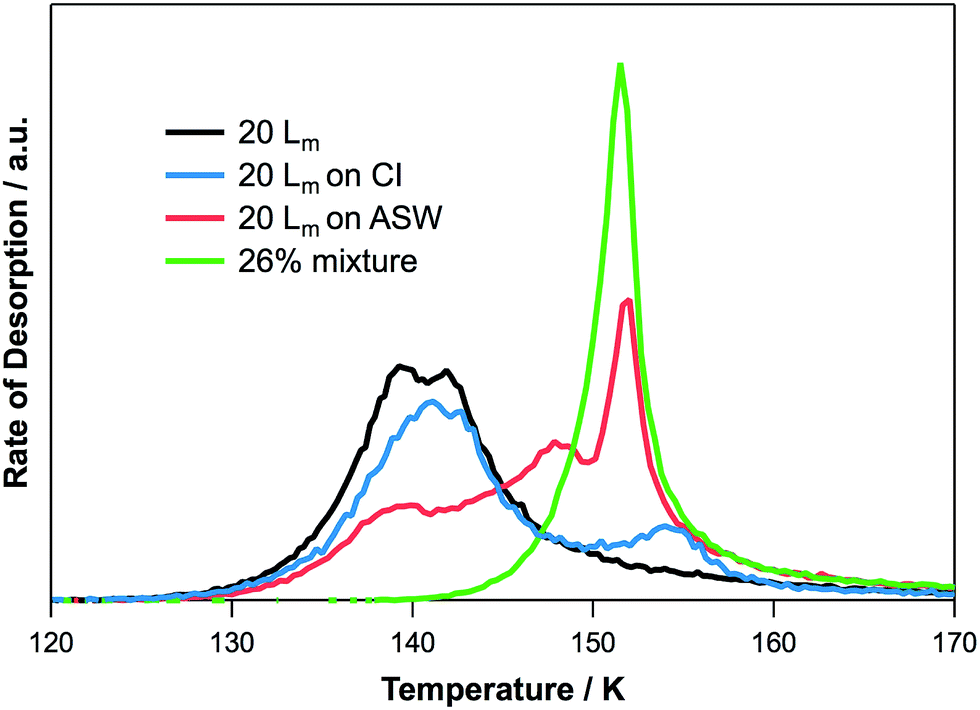 | ||
| Fig. 5 Comparison of the TPD traces for 20 Lm of 2-propanol adsorbed in different ice configurations. | ||
Fig. 4A shows 2-propanol TPD traces for various mixtures ranging from 8–26% of 2-propanol co-deposited with water at 26 K. The TPD spectra are characterised by a single desorption peak, which increases in intensity and downshifts in temperature with increasing amounts of 2-propanol in the ice. This peak can be assigned to 2-propanol co-desorption with water, as it desorbs at the same temperature as water ice. The decreasing peak temperature is assigned to a decrease in the bulk water desorption temperature due to an increasing amount of amorphous water desorption, as discussed later.
TPD traces for 2-propanol desorption from CI are shown in Fig. 4B. The TPD spectra are characterised by two desorption peaks for higher exposures of 2-propanol, in agreement with a previous study.34 At the lowest exposures (1–5 Lm) only the higher temperature of these two peaks is seen. With increasing 2-propanol dose, this higher temperature peak appears to saturate and does not shift in desorption temperature. The higher temperature peak is the first to be seen following the lowest 2-propanol exposures and can therefore be assigned to the desorption of 2-propanol bonded to CI, which then co-desorbs with the CI. The lower temperature peak has a desorption temperature that increases with increasing 2-propanol exposure and shares leading edges. This peak has the same desorption temperature and characteristics as that observed for pure 2-propanol on HOPG (see Fig. 2 and 5) and hence can be assigned to the formation of amorphous multilayers of 2-propanol on the CI surface.
It might be expected that CI is unable to form hydrogen bonds, thus suggesting that co-desorption is not possible for species adsorbed on CI. However, Schaff and Roberts34 showed that CI has around 1/6th of the number of dangling bonds compared to the surface of ASW. These dangling bonds are available for hydrogen bonding to species adsorbed on the surface, however they are saturated relatively rapidly due to the smaller concentration when compared with ASW. This is in excellent agreement with the data in Fig. 4B, which clearly shows saturation of the higher temperature co-desorption peak.
The desorption of 2-propanol from ASW is shown in Fig. 4C. The TPD spectra are characterised by three distinct peaks. At the lowest exposures, a single peak can be observed. This desorbs at the same temperature as the water and shows a slight downshift in temperature with increasing 2-propanol exposure. The peak appears to saturate following a 2-propanol exposure of 10 Lm and can be confidently assigned by comparison with the desorption spectra for 2-propanol from mixed ices (Fig. 4A and 5). Hence this peak is assigned to the co-desorption of 2-propanol bonded to the ASW surface. Unlike the mixed ice, this peak saturates for adsorption on ASW due to the limited surface area of the ASW ice. In comparison to the water surface-bound peak observed for 2-propanol on CI however, this peak saturates at a higher exposure due to the greater number of dangling bonds available on ASW to hydrogen bond to 2-propanol.34 The lowest temperature peak, which grows into the spectrum following an exposure of 15 Lm, can be assigned to the desorption of pure 2-propanol layers from the ASW surface. This same peak can be seen in Fig. 5 for desorption of 2-propanol from HOPG and water-ice containing systems. The intermediate temperature peak, observed following 2-propanol exposures of 10 Lm and above on the ASW surface, is not seen for any of the other ice configurations. Hence this peak is most likely due to the adsorption of 2-propanol in the pores of the ASW surface.
RAIR spectra recorded at 26 K for 2-propanol adsorbed on ASW and CI surfaces (not shown) are identical to those recorded on HOPG. However, RAIR spectra recorded for mixed ices show small differences in the CH3 modes, as shown in Fig. 6A. The band at 960 cm−1 for pure 2-propanol ice and for 2-propanol adsorbed on both ASW and CI shifts to 950 cm−1 in the mixed ice. Other bands associated with the CH3 groups at 1385 and 1134 cm−1 in the pure 2-propanol ice also shift, to 1388 and 1130 cm−1 respectively. Any changes to the ν(O–H) region of the 2-propanol ice spectrum are masked by the ν(O–H) mode of the water ice. These changes are due to an interaction with water as a result of complete mixing that occurs during deposition of the mixed ice. These changes are not observed for the layered ices, even following annealing.
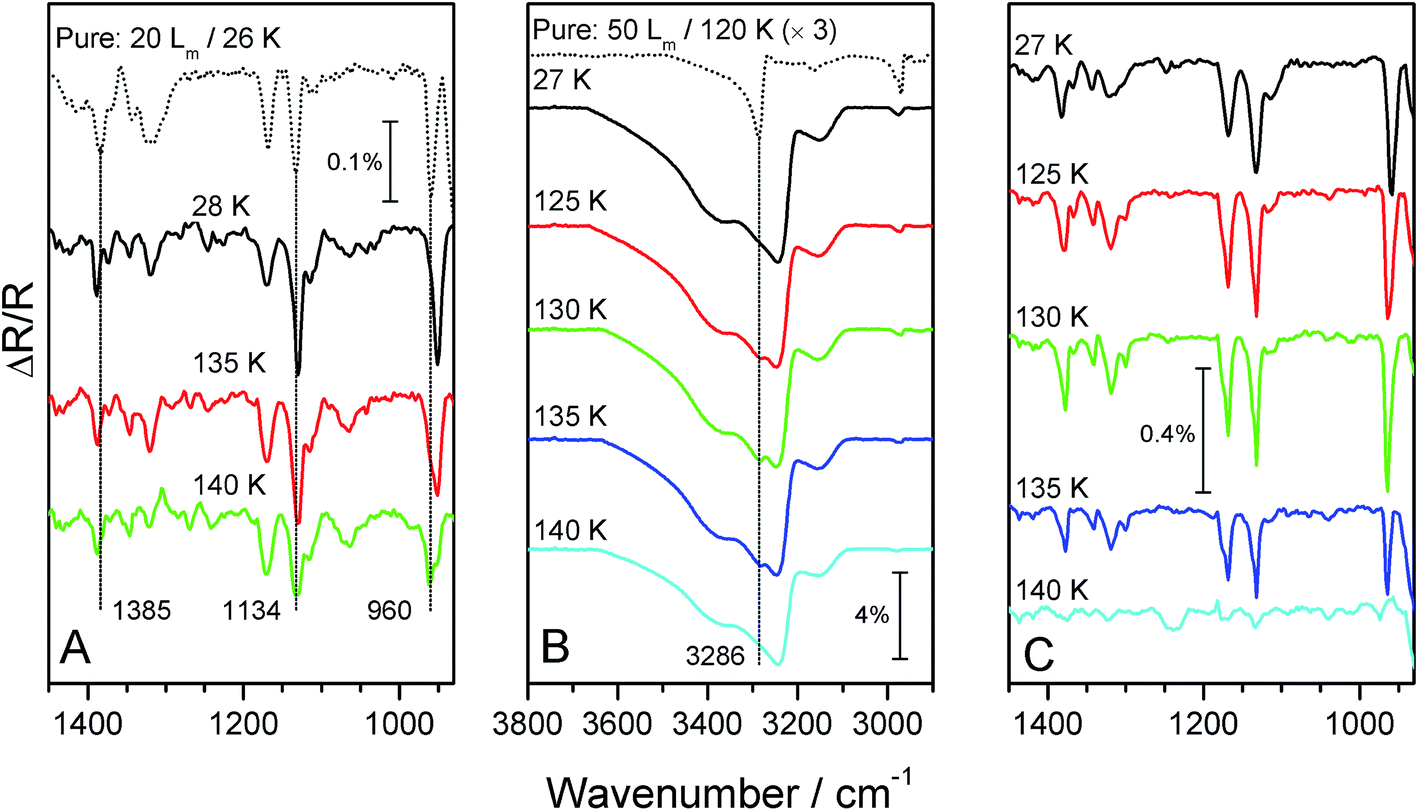 | ||
| Fig. 6 RAIR spectra for binary 2-propanol and water ices adsorbed on HOPG at 26 K. (A) RAIR spectra for a 28% 2-propanol/water mixture following annealing. A spectrum for pure 2-propanol at 26 K is shown for comparison. (B) and (C) Show RAIR spectra for 50 Lm of 2-propanol deposited on CI at 26 K followed by subsequent annealing. A RAIR spectrum for 50 Lm of pure 2-propanol annealed to 120 K is shown in (B) to allow the assignment of the additional feature observed in the ν(O–H) region. | ||
Annealing the mixed ice gives rise to splitting of the 950 cm−1 band into 2 distinct peaks at 962 and 950 cm−1 at 140 K (Fig. 6A). At this temperature, the water ice has begun to desorb, as indicated by a drop in intensity of the water ν(OH) band (not shown). Hence these two peaks can be assigned to 2-propanol molecules interacting with water ices (950 cm−1) and with other 2-propanol molecules (962 cm−1). This latter assignment can be made with reference to the position of this CH3 mode in the pure 2-propanol spectrum (dotted trace Fig. 6A).
In contrast to the mixed ices, annealing of 2-propanol adsorbed on ASW leads to no changes in the RAIR spectra until desorption of 2-propanol and water occurs. There is no evidence of 2-propanol crystallisation, even for higher exposures such as those that exhibit crystallisation for the pure alcohol ice (≥30 Lm). Hence, the presence of water inhibits the crystallisation of the 2-propanol, even in a layered ice. The observation that the 2-propanol infrared spectra are the same for adsorption on both HOPG and ASW surfaces suggests that the interactions between 2-propanol molecules are similar to those between 2-propanol and water molecules. This is unsurprising due to the hydrogen bonding ability of both molecules. This effect is similar to that observed when glycolaldehyde is adsorbed on ASW,45 where water also prevents crystallisation during annealing. Annealing gives rise to thermal rearrangement of the 2-propanol and water layers. However, the mixing is less extensive compared to that of the co-deposited ice, as evidenced by the unchanged ρ(CH3) mode at 960 cm−1 and by the growth of a pure 2-propanol peak in the TPD spectra for this system (Fig. 4C).
Annealing of 50 Lm of 2-propanol on CI shows evidence that the 2-propanol film undergoes a structural rearrangement during heating (Fig. 6B and C). At 125 K an additional peak can be seen to appear in the ν(O–H) region of the spectrum at 3286 cm−1, with other bands at 1378, 1169, 1132 and 960 cm−1 all showing spectral changes. Further heating sees the 2-propanol bands disappear from the spectrum at 140 K, in agreement with the TPD spectra (Fig. 4B). These spectral changes are assigned to a structural rearrangement of 2-propanol, however these changes are not as significant as those observed for the pure ice (Fig. 1 and dotted trace Fig. 6B). This is likely to be due to the fact that some of the 2-propanol molecules are already hydrogen bonded to the water ice surface, as evidenced by the small co-desorption peak in the TPD spectra (Fig. 4B). Hence, the concentration of pure 2-propanol is slightly lower when compared to the same amount of alcohol adsorbed on HOPG. Thus the extent of crystallisation is smaller.
3.3. The effects of 2-propanol on water desorption and crystallisation
Fig. 7 shows water TPD spectra for the corresponding binary layered (Fig. 7B) and co-deposited ices (Fig. 7C). A pure water ice TPD trace following dosing at 26 K is included for comparison (Fig. 7A). Clearly the presence of 2-propanol, even at the lowest exposures (1 Lm), affects the water desorption profile for both layered and co-deposited ices. Similar trends are observed for both ice configurations.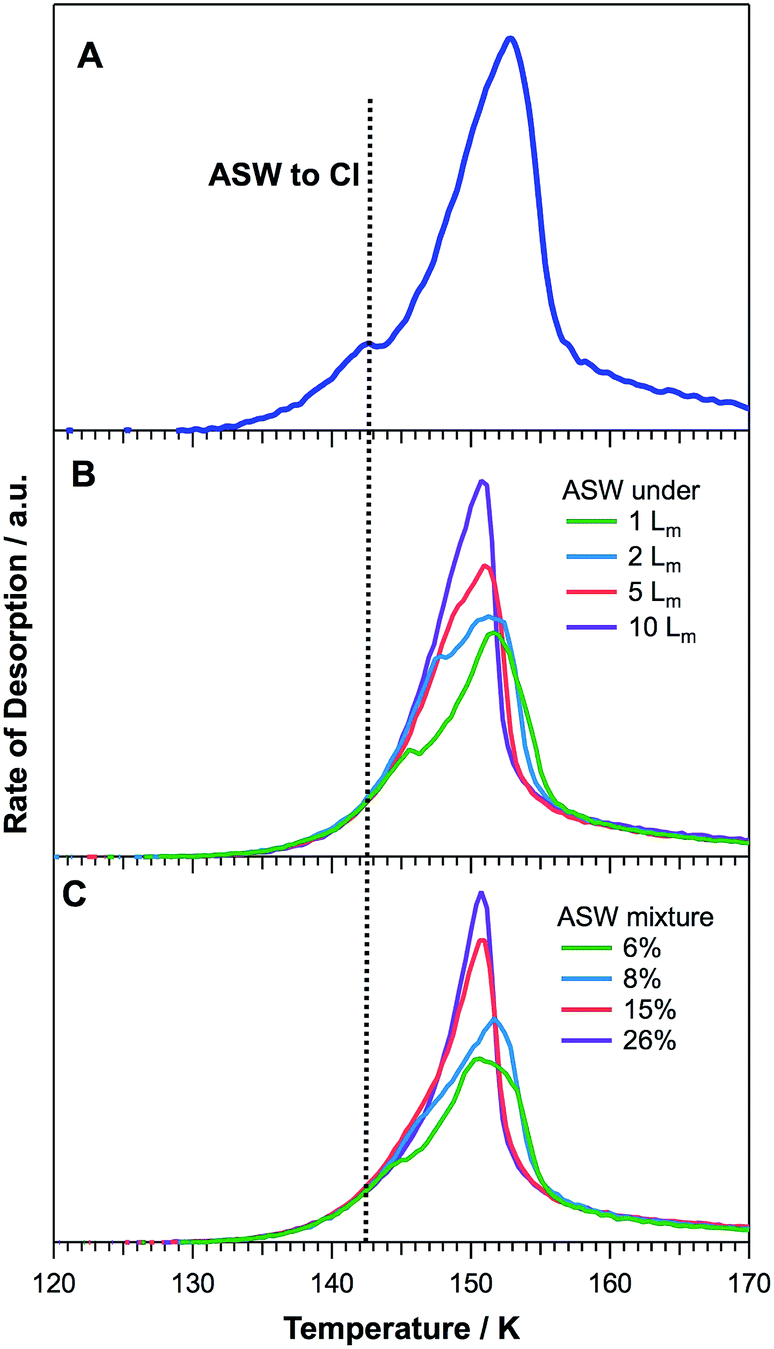 | ||
| Fig. 7 Water TPD spectra from various binary 2-propanol and water ices adsorbed on HOPG at 26 K. (A) Pure water desorption, showing the ASW-CI phase transition. (B) Water TPD spectra for layered ices of 2-propanol on ASW. (C) Water TPD spectra following the co-deposition of 2-propanol and water. The dotted vertical line shows the temperature of the ASW-CI phase transition for 50 Lm of pure water. | ||
Several characteristics of water desorption, and hence the conversion from ASW to CI during the heating process prior to desorption, are altered due to the presence of 2-propanol on and within the ice. The bump corresponding to the ASW to CI phase transition (Fig. 7A) increases in temperature with increasing amounts of 2-propanol. This trend is more pronounced in the layered ices where lower relative 2-propanol concentrations are shown (1 and 2 Lm). The bump completely disappears for layered ices with a 2-propanol layer of 10 Lm and for mixed ices ≥15%. At the same time, the water peak temperature decreases with increasing amounts of 2-propanol and the peak area exhibits an increase. Finally, the trailing edges of the water spectra for higher 2-propanol concentrations shift to lower temperatures.
These changes in the water TPD spectra can be assigned to the 2-propanol altering the crystallisation kinetics of the adsorbed ASW and its conversion to CI prior to desorption. The increasing amounts of 2-propanol inhibit the crystallisation of ASW, as indicated by the increasing temperature of the characteristic bump on the leading edges of the TPD spectra. This in turn gives rise to the desorption of a more amorphous form of water, which is characterised by a lower desorption temperature. Speedy et al. reported that the evaporation rate of ASW is greater than that of CI due to the increased stability of CI.46 This accounts for both the increased peak area of the increasingly amorphous water desorption and the lower desorption peak temperature.
RAIR spectra for ices containing 2-propanol and water ice are shown in Fig. 8, which focuses on the ν(O–H) stretching mode of water. For pure water adsorbed on HOPG (Fig. 8A), this spectral region clearly shows a marked changed in the ν(O–H) band profile and intensity, which has previously been assigned to the conversion of ASW to CI.34,47,48 The inhibition of water crystallisation caused by 2-propanol, whether in mixed (Fig. 8B) or layered (Fig. 8C) ices, can clearly be seen in the figure. Both the layered and mixed ices show a broad ν(O–H) band centred at 3455 cm−1 upon adsorption at base temperature. During annealing, this band shows a gradual shift to ∼3425 cm−1 and sharpens slightly. Concurrently, two small shoulders at 3320 and ∼3174 cm−1 develop. These changes in the ν(O–H) band profile are evidence of structural changes in the water ice. However, the water ice does not undergo a complete phase change to CI, as the RAIR spectra do not exhibit the same features as seen for pure water (Fig. 8A). By 140 K, pure water ice has fully converted to CI, as evidenced by the distinct RAIRS profile of the ν(O–H) band. In contrast, both the layered and mixed 2-propanol containing ices clearly show that the water has not converted to CI at 140 K. Furthermore, in both of the 2-propanol containing ices, water desorption has already commenced by 140 K. This observation is in excellent agreement with the TPD spectra shown in Fig. 7, and is fully consistent with the observation that ASW desorbs at a lower temperature than CI.46
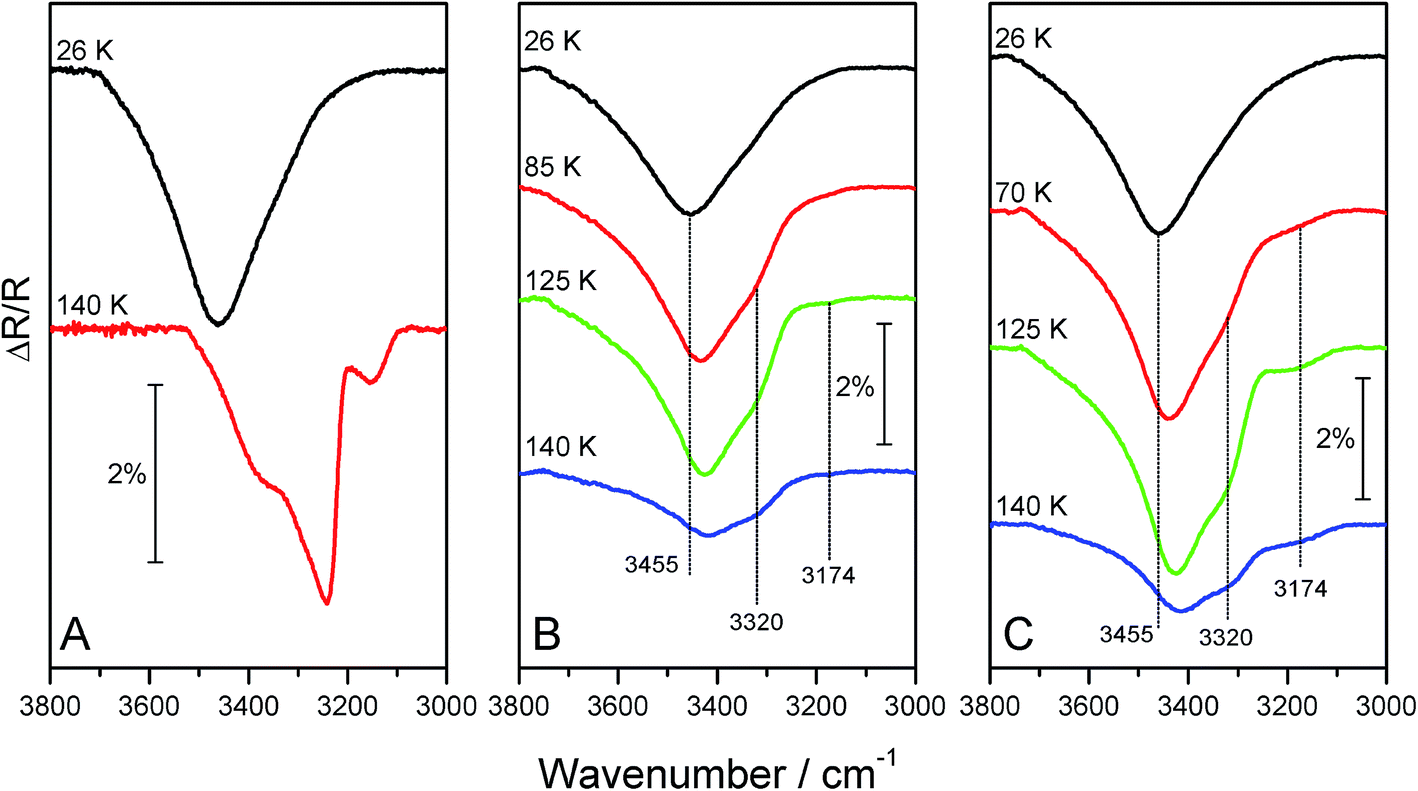 | ||
| Fig. 8 RAIR spectra showing the ν(OH) region of (A) pure water deposited on HOPG at 26 K and subsequently annealed to 140 K; (B) a 28% mixture of 2-propanol and water and (C) 20 Lm of 2-propanol deposited on ASW. Annealing temperatures of the binary ices are outlined in the figure. | ||
This inhibition of water crystallisation by 2-propanol is due to the ability of 2-propanol to hydrogen bond to the water, which then disrupts the ability of the ASW to form CI. Investigations of the phase diagram for water and 2-propanol at ambient pressure32 show that water and 2-propanol form two different clathrate structures, where ∼5 water molecules interact with one 2-propanol molecule. It is not clear exactly what the bonding between the water and 2-propanol is under UHV conditions at cryogenic temperatures, however hydrogen bonding will occur between the two species, thus changing the water crystallisation kinetics.
Other alcohols have also been shown to change the ASW to CI water phase transition.30,31 For example, methanol lowers the ASW to CI phase transition temperature, giving rise to an earlier onset of crystallisation, as evidenced by an early release of volatile species.30 The likelihood that this effect of 2-propanol and methanol on the ASW-CI phase transition can be assigned to hydrogen bonding between the species is confirmed by a study of the three C2O2H4 isomers.49 This study showed that the increasing ability of the molecule to hydrogen bond to the water caused a much larger effect on water crystallisation. For example, acetic acid inhibited water crystallisation markedly, whereas methyl formate had little effect.28
4. Conclusions
We have conducted a detailed TPD and RAIRS study of the adsorption, desorption and interactions between 2-propanol and water adsorbed on graphite at 26 K. 2-Propanol strongly physisorbs on HOPG and initially forms an amorphous layer when grown at low temperature. TPD spectra show evidence of islanding on the surface, most likely due to the formation of hydrogen bonds between the adsorbed molecules. Annealing the adlayer to 120 K leads to a structural rearrangement of the 2-propanol, which can be assigned to crystallisation. The desorption energy, derived from TPD, varies as a function of coverage, with monolayers desorbing with an energy of 46.6 ± 3.7 kJ mol−1. With increasing coverage, the desorption of first amorphous and then crystalline multilayers is observed with desorption energies of 50.4 ± 1.2 and 53.6 ± 2.0 kJ mol−1 respectively.As expected, strong interactions occur between the 2-propanol and water, giving rise to modified TPD profiles for both species. These differences are observed for all configurations of binary ices: co-deposited mixed ices, 2-propanol adsorbed on top of ASW and 2-propanol deposited on top of CI. In addition to changing the desorption behaviour of both molecules, the binary ices also lead to marked changes in the crystallisation of both the 2-propanol and the water ice. 2-Propanol does not crystallise in either a mixed ice or a layered ice at exposures where the corresponding pure ice is observed to crystallise. This behaviour is in complete agreement with that observed for methanol38 and ethanol40 ices annealed in layered or mixed ices on an HOPG surface. For both of these alcohols, the presence of ASW inhibits the crystallisation of the alcohol, just as observed for 2-propanol. However, on CI there is some evidence of structural rearrangement of the 2-propanol, although the crystallisation is not as extensive as observed for the same dose of the pure alcohol.
Changes in the crystallisation of water ice are also seen in the ASW and mixed ice systems containing 2-propanol. RAIR spectra show that the ASW to CI phase transition usually seen for water ice is not observed, even in the presence of small amounts of 2-propanol. This is further confirmed by the TPD spectra of water ice, which show the desorption of only amorphous water following exposures of 2-propanol ≥10 Lm (or 8% in a co-deposited ice). Other small alcohols, such as methanol30,31,38 and ethanol40 have also been shown to affect the kinetics of the ASW to CI phase transition of water ice. Ethanol behaves similarly to 2-propanol, by inhibiting the ASW to CI phase transition.40 In contrast, in the presence of methanol, the ASW to CI phase transition still occurs, but the temperature of the phase transition is lowered by approximately 15 K under laboratory experimental conditions.30,31
The data presented here help to shed light on the desorption and trapping properties of interstellar ices adsorbed on dust grains. Alcohols are ubiquitous in space and play a key role in the chemistry of interstellar space.16–23 For example, simple alcohols such as methanol, ethanol and propanol drive chemistry leading to the formation of more complex organic molecules such as ethers and esters.17 Despite 2-propanol not yet being detected in the ISM, its observation is predicted.24 Hence, understanding the physical chemistry of its interactions with water ices is important to furthering our understanding of the physics and chemistry of interstellar ices. Previous studies classified the desorption behaviour of COMs45 and showed that 2-propanol was expected to behave as a complex water-like species. Molecules of this type exhibit co-desorption with water ice (as seen for 2-propanol) and their hydrogen bonding abilities strongly affect the water ASW-CI phase transition. This, in turn, will affect the desorption of more volatile species in the ISM, which trap within the amorphous water ice50,51 and are only released when the water desorbs. This study clearly demonstrates the importance of on-going laboratory investigations of model interstellar ices including COMs to help to lead to a deeper understanding of astrophysical processes in ices. This, in turn, feeds into astrophysical models that further our understanding of the formation of COMs in a range of astrophysical environments.52
Conflicts of interest
There are no conflicts of interest to declare.Acknowledgements
The University of Sussex are thanked for a studentship for SAA and a post-doctoral fellowship for DJB. The STFC are acknowledged for a post-doctoral fellowship for TLS (grant number ST/M000869/1).References
- S. Zhou, C. Qian and X. Chen, Catal. Lett., 2011, 141, 726–734 CrossRef CAS.
- M. Bowker and R. J. Madix, Surf. Sci., 1982, 116, 549–572 CrossRef CAS.
- P. Uvdal, B. C. Wiegand, J. G. Serafin and C. M. Friend, J. Chem. Phys., 1992, 97, 8727 CrossRef CAS.
- B. A. Sexton, K. D. Rendulic and A. E. Hughes, Surf. Sci., 1982, 121, 181–198 CrossRef CAS.
- J. L. Davis and M. A. Barteau, Surf. Sci., 1990, 235, 235–248 CrossRef CAS.
- J. L. Davis and M. A. Barteau, Surf. Sci., 1987, 187, 387–406 CrossRef CAS.
- M. A. Vannice, W. Erley and H. Ibach, Surf. Sci., 1991, 254, 12–20 CrossRef CAS.
- J. B. Benziger and R. J. Madix, J. Catal., 1980, 65, 36–48 CrossRef CAS.
- J. P. Camplin and E. M. McCash, J. Chem. Soc., Faraday Trans., 1996, 92, 4695 RSC.
- L. J. Shorthouse, A. J. Roberts and R. Raval, Surf. Sci., 2001, 480, 37–46 CrossRef CAS.
- N. Gleason, J. Guevremont and F. Zaera, J. Phys. Chem. B, 2003, 107, 11133–11141 CrossRef CAS.
- D. Chadwick and P. J. R. O'Malley, J. Chem. Soc., Faraday Trans. 1, 1987, 83, 2227–2241 RSC.
- C. Martin, V. Rives and G. Solana, React. Kinet. Catal. Lett., 1996, 58, 243–248 CrossRef CAS.
- J. Zawadzki, M. Wisniewski, J. Weber, O. Heintz and B. Azambre, Carbon, 2001, 39, 187–192 CrossRef CAS.
- D. J. Burke and W. A. Brown, Phys. Chem. Chem. Phys., 2010, 12, 5947–5969 RSC.
- E. Herbst and E. F. van Dishoeck, Annu. Rev. Astron. Astrophys., 2009, 47, 427–480 CrossRef CAS.
- S. B. Charnley, M. E. Kress, A. G. G. M. Tielens and T. J. Millar, Astrophys. J., 1995, 448, 232–239 CrossRef CAS.
- E. L. Gibb, D. C. B. Whittet, W. A. Schutte, A. C. A. Boogert, J. E. Chiar, P. Ehrenfreund, P. A. Gerakines, J. V. Keane, A. G. G. M. Tielens, E. F. van Dishoeck and O. Kerkhof, Astrophys. J., 2000, 536, 347–356 CrossRef.
- D. Bockelee-Morvan, D. C. Lis, J. E. Wink, D. Despois, J. Crovisier, R. Bachiller, D. J. Benford, N. Biver, P. Colom, J. K. Davies, E. Gerard, B. Germain, M. Houde, D. Mehringer, R. Moreno, G. Paubert, T. G. Phillips and H. Rauer, Astron. Astrophys., 2000, 1114, 1101–1114 Search PubMed.
- F. Merlin, E. Quirico, M. A. Barucci and C. de Bergh, Astron. Astrophys., 2012, 540, 1–8 Search PubMed.
- T. J. Millar, H. Olofsson, A. Hjalmarson and P. D. Brown, Astron. Astrophys., 1988, 205, L5 CAS.
- N. Biver, D. Bockelée-Morvan, R. Moreno, J. Crovisier, P. Colom, D. C. Lis, A. Sandqvist, J. Boissier, D. Despois and S. N. Milam, Sci. Adv., 2015, 1, e1500863 Search PubMed.
- M. Ikeda, M. Ohishi, A. Nummelin, J. E. Dickens, P. Bergman, A. Hjalmarson and W. M. Irvine, Astrophys. J., 2001, 560, 792–805 CrossRef CAS.
- A. Karton and D. Talbi, Chem. Phys., 2014, 436–437, 22–28 CrossRef CAS.
- D. A. Williams and E. Herbst, Surf. Sci., 2002, 500, 823–837 CrossRef CAS.
- B. T. Draine, Annu. Rev. Astron. Astrophys., 2003, 41, 241–289 CrossRef.
- E. Herbst, J. Phys. Chem. A, 2005, 109, 4017–4029 CrossRef CAS PubMed.
- D. J. Burke, F. Puletti, P. M. Woods, S. Viti, B. Slater and W. A. Brown, J. Phys. Chem. A, 2015, 119, 6837–6849 CrossRef CAS PubMed.
- G. Vidali, J. E. Roser, G. Manico and V. Pirronello, J. Geophys. Res., 2004, 109, 1–10 CrossRef.
- D. J. Burke and W. A. Brown, Mon. Not. R. Astron. Soc., 2015, 448, 1807–1815 CrossRef CAS.
- R. Souda, Phys. Rev. B, 2007, 75, 184116 CrossRef.
- L. S. Aladko, A. Y. Manakov, A. G. Ogienko and A. L. Ancharov, J. Inclusion Phenom. Macrocyclic Chem., 2009, 63, 151–157 CrossRef CAS.
- K. B. Tarmyshov and F. Muller-Plathe, J. Chem. Phys., 2007, 126, 74702 CrossRef PubMed.
- J. E. Schaff and J. T. Roberts, J. Phys. Chem., 1996, 100, 14151–14160 CrossRef CAS.
- J. Goering, E. Kadossov and U. Burghaus, J. Phys. Chem. C, 2008, 112, 10114–10124 CAS.
- A. S. Bolina, A. J. Wolff and W. A. Brown, J. Chem. Phys., 2005, 122, 44713 CrossRef CAS PubMed.
- S. D. Green, A. S. Bolina, R. Chen, M. P. Collings, W. A. Brown and M. R. S. McCoustra, Mon. Not. R. Astron. Soc., 2009, 398, 357–367 CrossRef.
- A. J. Wolff, C. Carlstedt and W. A. Brown, J. Phys. Chem. C, 2007, 111, 5990–5999 CAS.
- D. J. Burke, A. J. Wolff, J. L. Edridge and W. A. Brown, J. Chem. Phys., 2008, 128, 104702 CrossRef CAS PubMed.
- D. J. Burke, A. J. Wolff, J. L. Edridge and W. A. Brown, Phys. Chem. Chem. Phys., 2008, 10, 4956–4967 RSC.
- R. Wiesendanger, L. Eng, H. R. Hidber, P. Oelhafen, L. Rosenthaler, U. Staufer and H.-J. Guntherodt, Surf. Sci., 1987, 189/190, 24–28 CrossRef.
- J. H. S. Green, Trans. Faraday Soc., 1963, 59, 1559–1563 RSC.
- S. A. Cirkel and R. Boese, Acta Crystallogr., Sect. A: Found. Crystallogr., 2004, 60, s205 CrossRef.
- R. S. Smith, J. Matthiesen and B. D. Kay, J. Phys. Chem. A, 2014, 118, 8242–8250 CrossRef CAS PubMed.
- D. J. Burke, F. Puletti, P. M. Woods, S. Viti, B. Slater and W. A. Brown, J. Chem. Phys., 2015, 143, 25–27 CrossRef PubMed.
- R. J. Speedy, P. G. Debenedetti, R. S. Smith, C. Huang and B. D. Kay, J. Chem. Phys., 1996, 105, 240–244 CrossRef CAS.
- E. Backus, M. Grecea, A. Kleyn and M. Bonn, Phys. Rev. Lett., 2004, 92, 236101 CrossRef PubMed.
- A. S. Bolina, A. J. Wolff and W. A. Brown, J. Phys. Chem. B, 2005, 109, 16836–16845 CrossRef CAS PubMed.
- D. J. Burke, F. Puletti, W. A. Brown, P. M. Woods, S. Viti and B. Slater, Mon. Not. R. Astron. Soc., 2015, 447, 1444–1451 CrossRef.
- S. Viti, M. P. Collings, J. W. Dever, M. R. S. McCoustra and D. A. Williams, Mon. Not. R. Astron. Soc., 2004, 354, 1141–1145 CrossRef CAS.
- M. P. Collings, M. A. Anderson, R. Chen, J. W. Dever, S. Viti, D. A. Williams and M. R. S. McCoustra, Mon. Not. R. Astron. Soc., 2004, 354, 1133–1140 CrossRef.
- R. T. Garrod, Astrophys. J., 2013, 765, 60 CrossRef.
| This journal is © The Royal Society of Chemistry 2017 |