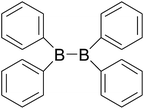
 Open Access Article
Creative Commons Attribution 3.0 Unported Licence
Theoretical study on homolytic B–B cleavages of diboron(4) compounds†
Jiaoyang Wang,
Wenrui Zheng * and
Yuanyuan Zheng
College of Chemistry and Chemical Engineering, Shanghai University of Engineering Science, Shanghai 201620, China. E-mail: wrzheng@sues.edu.cn; Fax: +86 21 67791220; Tel: +86 21 67791216
First published on 23rd October 2017
Abstract
The organic synthesis reactions of diboron(4) compounds in which B–B cleavage is involved can introduce a new set of boron-containing organic reagents that were proven to be very useful in many organic synthetic routes and can be regarded as ideal candidates for green chemistry. So it is very valuable and significant to understand one of the thermodynamic properties of the B–B bond, the strength of the B–B bond, which can be measured by using the homolytic bond dissociation enthalpies (BDEs). To this end, the 34 B–B BDEs of diboron(4) compounds were calculated by theoretical methods including composite high-level ab initio and density functional theory (DFT) methods. The results show that it is reasonable and reliable to regard the 34 B–B BDE averages of the five high-level methods including G3, G3B3, CBS-Q, CBS-QB3 and ROCBS-QB3 as the standard reference values and the SOGGA11-X method provides the best accuracy with the smallest root mean square error (RMSE) of 4.4 kJ mol−1. Subsequently, the B–B BDEs of three types of diboron(4) compounds according to their different molecular symmetry were investigated in detail by using this method. The results indicate that the different substituents have different effects on B–B BDE values. Natural bond orbital (NBO) analysis and investigations of the ground-state effect (GE) and the radical-state effect (RE) as well as frontier orbital energy analysis were performed in order to further disclose the essence of corresponding BDE change patterns. In addition, in order to better understand the catalytic process involving B–B cleavages by transitional-metal catalysts, the Pt–B and Cu–B BDE predictions after B–B cleavage were also conducted at this level. The results demonstrate that the participation of transition metals such as Pt and Cu can make the B–B cleavage much easier and the different substituents have different effects on the stability of transition metal boryl complexes.
1 Introduction
In recent years, the knowledge of diboron(4) compounds which originated in 1925 has been developed rapidly, and a series of synthetic reactions involving these compounds have been extensively studied by chemists. A new set of boron-containing organic reagents that are very versatile and useful in many synthetic routes to form valuable natural products, pharmaceutical intermediates and biologically active compounds can be obtained through the synthetic reactions.1,2 These new boron-containing organic reagents are regarded as ideal candidates for green chemistry, because they are generally considered to be nontoxic and environmentally friendly compounds for plants, mammals and other complex life forms.3 In general, the synthetic reactions involving diboron(4) compounds such as B2X4, B2(NR2)4, B2(alkyl)n, B2(OR)4, etc. mainly include borylation reactions,4–11 diboration reactions,12–18 borylative cyclization reactions,19–21 borylative ring opening reactions,22–27 boracarboxylation reactions,28 hydroboration and carboboration reactions,29–32 etc. For instance, Miyaura et al.33,34 developed the borylation reactions using dialkoxyboranes or diboron(4) compounds, such as B2cat2 (ref. 35) (cat = 1,2-O2C6H4), B2pin2 (ref. 36 and 37) (pin = 1,2-O2C2Me4), and B2neop2 (ref. 38) (neop = OCH2CMe2CH2O) with organic halides under the condition of using a palladium catalyst. Marder et al.39 reported the rhodium(I)-catalyzed diboration reaction of E-styryl boronate esters with B2cat2, in which the 1,1,1-triborylalkane is the dominant product. Ito and co-workers40 introduced the copper-catalyzed borylative cyclization reaction of allylic phosphates with B2pin2, and the 3-membered ring products were obtained. Szabó et al.41 studied the borylative ring opening reaction of substituted vinylcyclopropanes and vinyl aziridines with tetrahydroxydiboron catalyzed by palladium. Besides the above exemplified reactions catalyzed by the transitional-metal catalyst, there are also many researches on the reactions involving diboron(4) compounds under the transition-metal-free condition, such as borylation reactions,10,11 diboration reactions16–18 and borylative ring opening reactions,25–27 etc.Based on the quantities of experimental studies on the reactions involving diboron(4) compounds, it is found that the B–B cleavages of diboron(4) compounds, which are involved in the reactions, play an extremely important role. Therefore, it is momentous and necessary to understand the relevant thermodynamic properties of the B–B bonds. One of the thermodynamic properties, the strength of the B–B bond, can be measured by using the homolytic bond dissociation enthalpies (BDEs). Unfortunately, the experimental B–B BDE values of diboron(4) compounds are very scarce, probably due to the difficulty in obtaining boron radicals during the experimental BDE measurements.42 With the rapid development of quantum chemistry and computers, the BDE calculations of organic compounds can be performed well by theoretical methods, such as composite methods and DFT methods etc.43–48 For the examples of the theoretical researches on BDEs of organoboron compounds, Rablen49 used ab initio molecular orbital calculations at the G-2 and CBS-4 levels to investigate the B–H BDEs in a series of donor–acceptor complexes of borane, and the results showed excellent agreement with experimental data. In our previous work, the C–B BDEs including C(sp)–B, C(sp2)–B and C(sp3)–B of organoboron compounds such as boronic acids, trifluoroborate salts, boronate esters, etc. were calculated, and the M06-HF method was found to perform the best with the highest precision (the root mean square error equals to only 6.4 kJ mol−1).50 The theoretical studies on B–B BDEs of organoboron compounds were rarely reported. For example, Ducati et al.51 used the BP86/TZ2P method to calculate the B–B BDEs of OCBBCO, N2BBN2 and [OBBBBO]2−, and the values are 625.7 kJ mol−1, 606.5 kJ mol−1 and 346.9 kJ mol−1, separately. Sakaki et al.52 calculated the B–B BDEs of BH2–BH2 and B(OH)2–B(OH)2 by using the MP4SDQ method and the values are 375.8 kJ mol−1 and 433.0 kJ mol−1, respectively.
In our present study, the B–B BDEs of diboron(4) compounds as well as the substituent effects were systematically investigated by using theoretical methods including composite high-level ab initio methods and a series of DFT methods, which are considered to be very beneficial to better understand the B–B cleavages of diboron(4) compounds in synthesis reactions and provide more valuable guidance for the later experimental researches.
2 Theoretical calculation strategy and method
2.1 Computational strategy
The B–B bond cleavage of diboron(4) compounds is shown in the following reaction. The enthalpy change of this reaction under the conditions of 1 atm and 298.15 K in the gas phase represents the homolytic bond dissociation enthalpy (BDE) of the B–B bond.53
 | (1) |
The enthalpy of each species can be calculated using the following equation:
| H (298 K) = E + ZPE + Htrans + Hrot + Hvib + RT | (2) |
In this equation, ZPE represents the zero point energy. The Htrans, Hrot, and Hvib are the standard temperature correction terms calculated with equilibrium statistical mechanics with harmonic oscillator and rigid rotor approximations.54,55
2.2 Computational method
In our present study, the theoretical calculation methods including composite high-level ab initio methods and 28 DFT methods were used for B–B BDE calculations of diboron(4) compounds and all of the calculations were carried out with Gaussian 09 packages.56 In the composite high-level ab initio methods, the Gaussian-n (Gn) series (G3,57 G4,58 G3B3,59,60 G4MP2 (ref. 61)) and the complete-basis-set CBS series (CBS-4M,62,63 CBS-Q,64 CBS-QB3,65,66 ROCBS-QB3 (ref. 67)) which are suitable for the systems of less than 8 non-hydrogen atoms were selected. In addition, the 28 DFT methods including M06-HF,68 M05-2X,69 wB97,70 MN12-SX,71 BMK,72 SOGGA11-X,73 wB97XD,74 M06-2X,75 M06,76 KMLYP,77 MN12-L,78 M11,79 N12-SX,71 MPW1B95,80 BP86-D3,81 MPW1P86,82 N12,83 B3P86,84 B3LYP-D3,85 M05,86 M06-L,87 CAM-B3LYP,88 PBE1PBE,89 SOGGA11,90 MPW1K,91 B3LYP,66 M11-L,92 B97D93 were used. For the DFT calculations, the geometry optimizations and the frequency calculations of molecules and the corresponding radicals were performed at the B3LYP/6-31+G(d) level, which is suitable for structure optimization due to its high accuracy and lower computational cost.94–98 The basis set of 6-311++G(2df,2p) was adopted for the single-point energy calculations. For the calculations of the transition metals Pt and Cu, the effective core potential LANL2DZ basis set was used for the geometry optimizations and the SDD basis set was used for the single-point energy calculations.3 Results and discussion
3.1 The evaluation of composite high-level methods
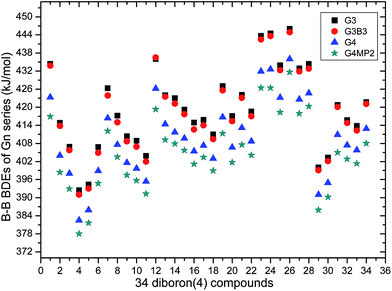
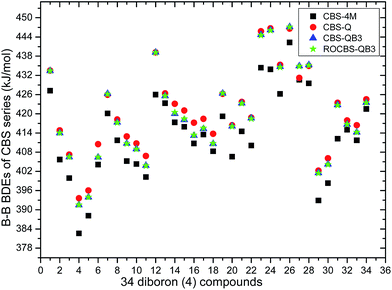
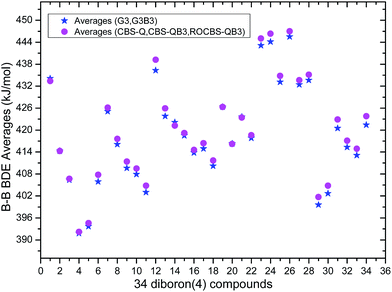
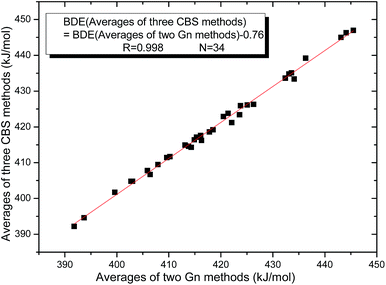
In view of the high computing resources demand of the composite high-level ab initio methods which have high accuracy for the calculation of molecular energy,57,99–104 we designed 34 diboron(4) compounds including B2X4, B2(NR2)4, B2(alkyl)n, B2(OR)4, etc. in which less than 6 non-hydrogen atoms are included as the training set. In this training set, the experimental B–B BDE values of the 34 designed diboron(4) compounds are unknown. In order to better evaluate and compare the precisions of the different composite high-level ab initio methods, the Gaussian-n (Gn) series (G3, G3B3, G4,G4MP2) as well as the complete-basis-set CBS series (CBS-4M, CBS-Q, CBS-QB3, ROCBS-QB3) were used. The calculated B–B BDE values were listed in the Table 1. Moreover, the corresponding average values of B–B BDEs were also listed.The 34 B–B BDE value distributions by the eight high-level methods were depicted in the following figures, in which the consistency of the eight methods including Gn and CBS series for B–B BDE calculations can be intuitively shown. In Fig. 1, the 34 B–B BDE distributions of the Gn series were listed. It can be seen that the 34 B–B BDEs calculated by G4 and G4MP2 are lower than those by G3 and G3B3, and the G4MP2 gave the smallest 34 B–B BDEs. Moreover, there is a very good consistency between G3 and G3B3 values for all the 34 B–B BDEs. Therefore, the 34 B–B BDE average values of G3 and G3B3 methods were calculated. In Fig. 2, the 34 B–B BDE distributions of CBS series were depicted. Similarly, it is shown that the 34 B–B BDE values calculated by CBS-Q, CBS-QB3 and ROCBS-QB3 are very close and the CBS-4M gives the smallest 34 B–B BDE values. Due to the good self-consistency between the CBS-Q, CBS-QB3 and ROCBS-QB3 methods in CBS series for 34 B–B BDE calculations, the 34 average values of these three methods were calculated, which are listed in the Table 1. Based on the above observations, the distributions of 34 B–B BDE average values of Gn series (G3, G3B3) and CBS series (CBS-Q, CBS-QB3, ROCBS-QB3) were depicted in Fig. 3, which indicates that there is a good agreement between the two different high-level method series. Furthermore, the good linear relationship between the 34 B–B BDE averages of Gn and CBS series was shown in Fig. 4, and the correlation coefficient (R) is high to 0.998.
Overall, the 34 B–B BDE averages of the five high-level methods including G3, G3B3, CBS-Q, CBS-QB3 and ROCBS-QB3 were calculated and listed in the Table 1. Considering that the 34 experimental B–B BDEs are unknown, it is reasonable and reliable to regard the 34 B–B BDE averages of the five high-level methods as the standard reference values for the DFT methods evaluation in the subsequent study.
3.2 The evaluation of DFT methods
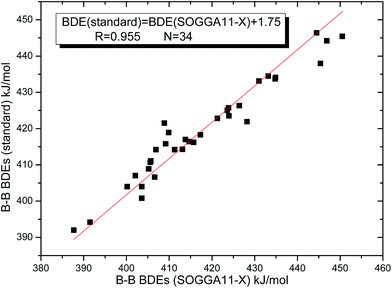
For the B–B BDE calculations of the large systems, the composite high-level ab initio methods are not applicable. Currently, the density functional theory (DFT) method has been developed as a popular theoretical tool for the BDE calculations because of its relatively low CPU-costs, no serious spin-contamination and reasonable calculation precision.105–108 In order to find out an economical and accurate method to predict the B–B BDEs of large diboron(4) compounds, the 28 DFT methods were selected to calculate the 34 B–B BDEs in Table 1 and the corresponding results are listed in the ESI.† Among these DFT methods, there are some functionals with dispersion correction such as B3LYP-D3, B97D and long-range correction such as wB97XD, CAM-B3LYP. The generalized gradient approximations (GGA) such as SOGGA11, the hybrid GGA such as MPW1K, SOGGA11-X, the meta-GGA like M06-L, M11-L, the global-hybrid meta-GGA such as MPW1B95, M05, M05-2X, M06, M06-2X, M06-HF and the range-separated hybrid meta-GGA like M11 as well as the nonseparable gradient approximation (NGA) like N12, the meta-NGA like MN12-L and the range-separated hybrid meta-NGA like MN12-SX were included. Furthermore, these functionals such as N12, M11, M11-L, MN12-L, MN12-SX, SOGGA11, SOGGA11-X were produced after 2010.By comparing the 34 B–B BDEs calculated by the 28 DFT methods with the standard reference values, the corresponding mean deviation (MD), mean absolute deviation (MAD) and root mean square error (RMSE) values were listed in the Table 2. From this table, it can be seen that the SOGGA11-X method gives the highest precision for the B–B BDE calculations, and the RMSE value is the smallest of 4.4 kJ mol−1. The MD, MAD values are −1.8 kJ mol−1 and 3.3 kJ mol−1, respectively. In addition, the KMLYP method is the second better, and the corresponding RMSE, MD and MAD values are 6.3 kJ mol−1, 5.4 kJ mol−1 and 5.4 kJ mol−1, separately. The M11-L method gives the worst accuracy, because the RMSE value reaches to the highest of 51.5 kJ mol−1, and the MD and MAD values are −51.4 kJ mol−1 and 51.4 kJ mol−1. The B3LYP method, which is a relatively popular method,66 does not give high precision for the B–B BDE calculations, and the MD, MAD, RMSE values are −34.5 kJ mol−1, 34.5 kJ mol−1 and 34.6 kJ mol−1, respectively. The precisions of corresponding dispersion correction function and long-range correction function, i.e. B3LYP-D3 and CAM-B3LYP, have been improved a little as compared to the B3LYP. In addition, the wB97 method has a better precision than the long-range correction method wB97XD. The RMSE values of M06-HF, M06, M06-2X and M06-L methods are 9.0 kJ mol−1, 13.4 kJ mol−1, 20.1 kJ mol−1 and 27.9 kJ mol−1, in which the precision is gradually worse. Besides, some functionals that appeared after 2010 such as MN12-SX, MN12-L, M11, N12, SOGGA11 do not give good precision for the B–B BDE calculations. Subsequently, the good linear relationship between the 34 B–B BDEs calculated by SOGGA11-X method and the standard reference values was depicted in Fig. 5, in which the correlation coefficient (R) is 0.955. In view of the above analysis, the best method SOGGA11-X was used to investigate the B–B BDEs of large diboron(4) compounds in the following discussions.
| DFT methods | MD | MAD | RMSE | DFT methods | MD | MAD | RMSE |
|---|---|---|---|---|---|---|---|
| a Note: MD (mean deviation) = ∑(xi − yi)/N; MAD (mean absolute deviation) = ∑|xi − yi|/N; RMSE (root mean square error) = [∑(xi − yi)2/N]1/2 (N = 34, xi represents the BDEs of DFT methods, and yi represents the standard reference values). | |||||||
| M06-HF | −7.0 | 7.0 | 9.0 | BP86-D3 | −23.6 | 23.6 | 23.7 |
| M05-2X | 9.0 | 9.1 | 9.9 | MPW1P86 | −24.7 | 24.7 | 24.9 |
| wB97 | 8.0 | 8.1 | 8.7 | N12 | −21.9 | 21.9 | 22.1 |
| MN12-SX | −17.0 | 17.0 | 17.6 | B3P86 | −25.5 | 25.5 | 25.6 |
| BMK | −10.9 | 10.9 | 11.2 | B3LYP-D3 | −22.2 | 22.2 | 22.2 |
| SOGGA11-X | −1.8 | 3.3 | 4.4 | M05 | −7.9 | 8.3 | 9.5 |
| wB97XD | −10.5 | 10.5 | 10.7 | M06-L | −27.5 | 27.5 | 27.9 |
| M06-2X | −19.9 | 19.9 | 20.1 | CAM-B3LYP | −23.3 | 23.3 | 23.5 |
| M06 | −13.2 | 13.2 | 13.4 | PBE1PBE | −28.0 | 28.0 | 28.1 |
| KMLYP | 5.4 | 5.4 | 6.3 | SOGGA11 | −25.7 | 25.7 | 26.0 |
| MN12-L | −23.7 | 23.7 | 24.3 | MPW1K | −29.9 | 29.9 | 30.1 |
| M11 | −19.8 | 19.8 | 20.0 | B3LYP | −34.5 | 34.5 | 34.6 |
| N12-SX | −8.7 | 8.7 | 9.3 | M11-L | −51.4 | 51.4 | 51.5 |
| MPW1B95 | −16.5 | 16.5 | 16.6 | B97D | −25.3 | 25.3 | 25.8 |
3.3 The B–B BDE predictions of diboron(4) compounds
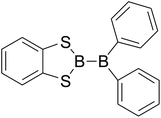
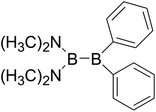
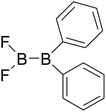
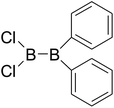
The B–B homolytic cleavage of diboron(4) compounds which are involved in quantities of reported reactions, can be mainly divided into three types described in the following according to the different molecular symmetry of the compounds. Herein, the R1 and R2 groups include –X, –NR2, –alkyl, –SR and –OR etc.
 | (3) |
 | (4) |
 | (5) |
Firstly, the B–B BDEs of diboron(4) compounds that were shown in reaction (3) were calculated by using SOGGA11-X method with the basis set of 6-311++G(2df,2p), and the values were listed in the Table 3. For the B2(OR)4 compounds, the largest B–B BDE of 488.3 kJ mol−1 was found in [2,2′]bi[benzo[1,3,2]dioxaborolyl] (Entry 5), and the smallest B–B BDE was 428.9 kJ mol−1 when R1 is –OCH3 (Entry 1). The difference between them is as high as 59.4 kJ mol−1. The B–B BDE values of [2,2′]bi[[1,3,2]dioxaborolanyl] (Entry 2), 4,4,5,5,4′,4′,5′,5′-octamethyl-[2,2′]bi[[1,3,2]dioxaborolanyl] (Entry 3) and [2,2′]bi[[1,3,2]dioxaborinanyl] (Entry 4) which are extensively used in the synthetic reactions, were 468.8 kJ mol−1, 460.0 kJ mol−1 and 443.0 kJ mol−1, separately. For the B2(SR)4 compound, the B–B BDE of [2,2′]bi[benzo[1,3,2]dithiaborolyl] (Entry 6) was 460.9 kJ mol−1, which is much smaller (27.4 kJ mol−1) comparing with the same structure B2(OR)4 compound [2,2′]bi[benzo[1,3,2]dioxaborolyl] (Entry 5). The optimized conformations of the two compounds (Entries 5 and 6) at the B3LYP/6-31+G(d) level are shown in Fig. 6, in which the [2,2′]bi[benzo[1,3,2]dioxaborolyl] is plane conformation while the [2,2′]bi[benzo[1,3,2]dithiaborolyl] is distorted. The conformation difference may lead to the B–B BDE difference between them. For the B2(NR2)4 and B2(alkyl)4 compounds (Entries 7–10), the B–B BDEs were 387.2 kJ mol−1, 396.9 kJ mol−1, 349.3 kJ mol−1 and 401.2 kJ mol−1, respectively, which are obviously lower than other R1 groups including –OR, –SR, etc. Especially, the B–B BDE of B2(C(CH3)3)4 (Entry 9) is the lowest in all of the diboron(4) compounds. In addition, for the B2X4 compounds, the convenient solution-phase syntheses of B2F4, B2Cl4 and B2I4 from the common precursor B2Br4 were proposed by Braunschweig et al. in the recent study.109 In our calculations, the B–B BDE of B2F4 (Entry 11) is higher than B2Cl4 (Entry 12), and the difference between them is 21.8 kJ mol−1, which shows that the more electronegative halides make the B–B bond stronger. Similarly, there is a large conformation difference between B2F4 and B2Cl4 (Fig. 6), that is, the B2F4 is plane conformation, while the B2Cl4 is perpendicular, which is in accordance with the results of Demachy et al.110 From above analysis, it is found that the different R1 groups including –X, –NR2, –alkyl, –SR and –OR, etc. have great effects on the B–B BDE values. Besides, the B–B bond lengths and the Wiberg bond orders of B–B bond were listed in Table 3. It can be seen that the range of B–B bond lengths is from 1.680 Å to 1.740 Å, and the Wiberg bond orders of B–B bond are around 1.000 for all of the diboron(4) compounds.
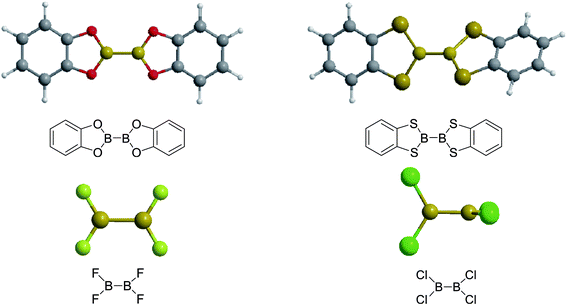 | ||
| Fig. 6 The molecular optimized conformations at the B3LYP/6-31+G(d) level of four diboron(4) compounds in reaction (3). | ||
Usually, in order to better investigate the substituent effects on BDEs, the β-substituent effects can be separated into the ground-state effect (GE) and the radical-state effect (RE).55,111–113 As a reference, the R1 effects on B–B BDEs in our system can similarly be divided into GE and RE defined by the enthalpy changes of the reactions (a) and (b) in Scheme 1, and the GE and RE values calculated by the SOGGA11-X method are shown in the Table 3. Generally speaking, the positive GE (RE) values indicate that the stability of the molecules (radicals) is enhanced while the negative values represent the stability of the molecules (radicals) is weakened by the substituents, and the overall effects determine the change pattern of the B–B BDEs. From the Table 3, it can be seen that for the B2(C(CH3)3)4 (Entry 9) with the smallest B–B BDE value of 349.3 kJ mol−1, the GE value is a larger absolute negative value (−40.41 kJ mol−1) while the RE value is a larger positive value (34.03 kJ mol−1), which indicates that the stability of molecule is strongly weakened while the stability of radical is greatly enhanced. On the contrary, for the [2,2′]bi[benzo[1,3,2]dioxaborolyl] (Entry 5) with the largest B–B BDE of 488.3 kJ mol−1, the GE value is a larger positive value (26.44 kJ mol−1) while the RE value is a smaller absolute negative value (−2.01 kJ mol−1), and the opposite effect of GE and RE on the stability of the molecule and radical both lead to the remarkably increase of the B–B BDE value. Moreover, for the B2Cl4 (Entry 12) with the B–B BDE value of 423.6 kJ mol−1, the GE and RE are both positive values of 2.00 kJ mol−1 and 18.08 kJ mol−1, separately. It is obvious that the larger positive RE value has a stronger effect on B–B BDE than the smaller positive GE value, which lead to the relatively smaller B–B BDE value. Besides, the linear relationships between GE values and RE values with B–B BDEs were obtained, which are depicted in Fig. 7(a) and (b). It can be seen that the correlation coefficient R and slope between GE values with B–B BDEs are 0.759 and 1.64, while the correlation coefficient R and slope between RE values with B–B BDEs are 0.892 and −2.61, respectively. The larger absolute slope of RE values with B–B BDEs demonstrates that the RE has a stronger effect on B–B BDEs than GE for the 12 diboron(4) compounds.
 | ||
| Scheme 1 GE (a) and RE (b) of these diboron(4) compounds in reaction (3). | ||
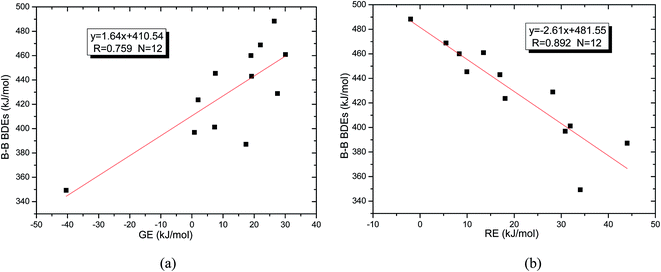 | ||
| Fig. 7 (a) Correlation between GE values with B–B BDEs. (b) Correlation between RE values with B–B BDEs. | ||
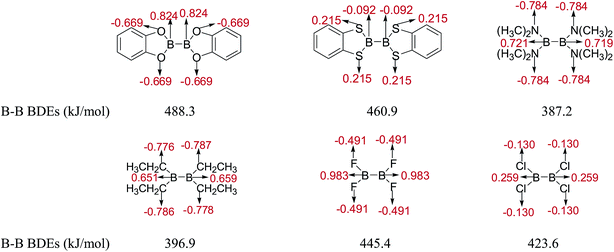
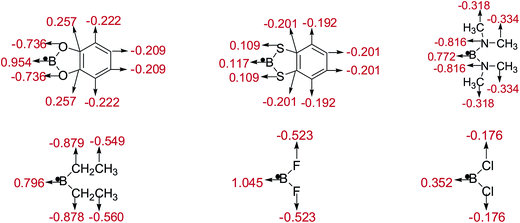
The natural charges of atoms in molecules and radicals after B–B cleavage of representative diboron(4) compounds by the natural bond orbital (NBO)111 analysis at the SOGGA11-X/6-311++G(2df,2p) level are shown in Fig. 8 and 9. Firstly, for the [2,2′]bi[benzo[1,3,2]dioxaborolyl] (Entry 5) and [2,2′]bi[benzo[1,3,2]dithiaborolyl] (Entry 6) compounds, the NBO analysis of molecules (in Fig. 8) gives the large positive natural charges (0.824) for the two B atoms in [2,2′]bi[benzo[1,3,2]dioxaborolyl], while the small absolute negative natural charges (−0.092) on the two B atoms are found in [2,2′]bi[benzo[1,3,2]dithiaborolyl]. Meanwhile, the four O atoms in [2,2′]bi[benzo[1,3,2]dioxaborolyl] carry the large absolute negative charges (−0.669) while the four S atoms in [2,2′]bi[benzo[1,3,2]dithiaborolyl] carry the small positive charges (0.215). The large difference of natural charge distributions may be related to the different optimized conformations of the two diboron(4) compounds which are shown in Fig. 6. And the natural charge distributions of their corresponding radicals (in Fig. 9) show that the B atom carry the large positive charge (0.954) and the O atoms carry the large absolute negative charges (−0.736) in benzo[1,3,2]dioxaborole, while the B and S atoms all carry the small positive charges (0.117, 0.109) in benzo[1,3,2]dithiaborole, which may be consistent with the large RE difference of the two compounds. Secondly, it is found that in the molecules of B2(N(CH3)2)4 and B2(C2H5)4 as well as in the corresponding radicals, the natural charges of B atoms are both relatively smaller than those in B2(OR)4 compound [2,2′]bi[benzo[1,3,2]dioxaborolyl]. In the compound of B2F4 with plane conformation, the two B atoms carry the large positive natural charges (0.983) and the four F atoms carry the large absolute negative charges (−0.491), in contrast, the B atoms carry small positive natural charges (0.259) and the four Cl atoms carry the small absolute negative charges (−0.130) in the compound of B2Cl4 with perpendicular conformation (in Fig. 8). Similarly, the significantly different charge distributions of –BF2 and –BCl2 are found.
In addition, the energies of frontier orbitals of the singly occupied molecular orbital (SOMO) of radicals after B–B cleavage were calculated, which are shown in Table 3. It can be seen that for the five B2(OR)4 compounds, the SOMO energies are −5.3 eV, −6.2 eV, −6.8 eV, −5.4 eV and −6.9 eV, respectively. The results indicated that the change of B–B BDE values generally presents a trend, that is, the BDE value is higher, the absolute energy of the SOMO is larger, which shows that the absolute energies of the SOMO are larger, the corresponding radicals are more instable. For the B2(SR)4 compound of [2,2′]bi[benzo[1,3,2]dithiaborolyl] (Entry 6), the absolute energy of the SOMO is 0.4 eV lower than [2,2′]bi[benzo[1,3,2]dioxaborolyl] (Entry 5). For the B2(NR2)4 and B2(alkyl)4 compounds (Entries 7–10), the absolute energies of the SOMO were generally lower than other diboron(4) compounds. In addition, for the B2X4 compounds (Entries 11 and 12), absolute energies of the SOMO of B2F4 is 0.8 eV higher than B2Cl4. Apparently, we can come to the conclusion that the B–B BDE change patterns of different R1 groups are in accordance with the absolute energies of the SOMO of the diboron(4) compounds.
Secondly, for the diboron(4) compounds that were shown in reaction (4), the B–B BDEs were calculated and the results were listed in the Table 4. From the Table 4, it can be seen that the largest B–B BDEs are found when R1 and R2 are both –OR or –SR groups and the smallest B–B BDEs are found when R1 and R2 are both –NR2 or –alkyl groups. For example, for all of the diboron(4) compounds, the largest and smallest B–B BDEs are found in R1 = benzo[1,3,2]dioxaborole, R2 = benzo[1,3,2]dithiaborole (Entry 19) and R1 = –N(CH3)2, R2 = –CH2CH3 (Entry 32), and the BDE values are 476.8 kJ mol−1 and 386.9 kJ mol−1, respectively. When only one of the substituents, i.e. R1 (or R2) is –OR or –SR groups, the BDEs are relatively larger while when only one of the substituents, i.e. R1 (or R2) is –NR2 or –alkyl groups, the B–B BDEs are relatively smaller. For example, for R1 = [1,3,2]dioxaborolane, R2 = –Cl (Entry 10), the B–B BDE is 446.4 kJ mol−1 and for R1 = –N(CH3)2, R2 = –Cl (Entry 31), the B–B BDE is 418.0 kJ mol−1. Comparing the B–B BDEs of R1 (or R2) = –F with –Cl, it is found that the B–B BDEs of –F are about 15 kJ mol−1 larger than –Cl. For example, for R1 = –OCH3, R2 = –F (Entry 3), the B–B BDE is 442.6 kJ mol−1 (with plane conformation in Fig. 10) while for R1 = –OCH3, R2 = –Cl (Entry 4), the B–B BDE is 427.4 kJ mol−1 (with perpendicular conformation in Fig. 10), and the difference between them is 15.2 kJ mol−1. Besides, comparing R1 = benzo[1,3,2]dioxaborole with R1 = benzo[1,3,2]dithiaborole (Entries 20–29), it can be seen that the B–B BDEs of R1 = benzo[1,3,2]dithiaborole are smaller, for example, for R1 = benzo[1,3,2]dioxaborole, R2 = –N(CH3)2, the B–B BDE value is 445.9 kJ mol−1 (with distorted conformation in Fig. 10) while for R1 = benzo[1,3,2]dithiaborole, R2 = –N(CH3)2, the B–B BDE value is 429.8 kJ mol−1 (with perpendicular conformation in Fig. 10), and the difference between them is 16.1 kJ mol−1.
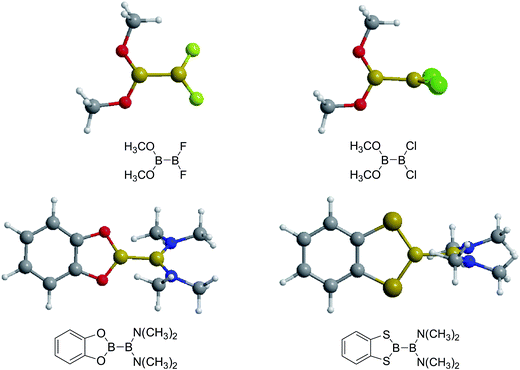 | ||
| Fig. 10 The molecular optimized conformations at the B3LYP/6-31+G(d) level of four diboron(4) compounds in reaction (4). | ||
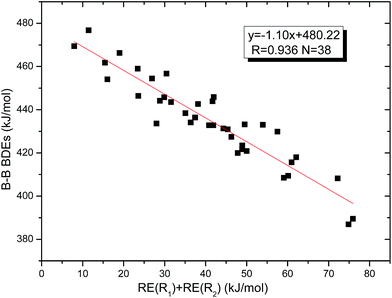
Similar with reaction (3), the GE values of these diboron(4) compounds in reaction (4) defined by the enthalpy change of the reaction in Scheme 2 are listed in the Table 4. Meanwhile, the RE values of corresponding radicals which were calculated in reaction (3) are also listed in the Table 4. In order to investigate the total effects of the two substituents R1 and R2 on B–B BDEs, the overall RE values, i.e. the sum of the RE (R1) and RE (R2) are listed in the Table 4. It can be seen that all of the GE values and the overall RE values are positive. In addition, by observing the 38 B–B BDE values as well as the corresponding GE and overall RE values of diboron(4) compounds with different R1 and R2 groups, it is found that the B–B BDE values are determined by the co-effects of GE and overall RE. For example, for the diboron(4) compound in which R1 = benzo[1,3,2]dioxaborole and R2 = benzo[1,3,2]dithiaborole, the B–B BDE value is the largest of 476.8 kJ mol−1, and the GE is a larger positive value (30.53 kJ mol−1) while the overall RE is a smaller positive value (11.47 kJ mol−1), it is clear that the GE has a stronger effect on B–B BDE than the overall RE. For the diboron(4) compound in which R1 = –N(CH3)2 and R2 = –CH2CH3, the B–B BDE value is the smallest of 386.9 kJ mol−1, and the GE is a smaller positive value (3.97 kJ mol−1) while the overall RE is a larger positive value (74.86 kJ mol−1), which shows that the overall RE plays a more important role on B–B BDE than GE. Besides, the linear relationship between the overall RE values with B–B BDEs was obtained, which is depicted in Fig. 11. It can be seen that the correlation coefficient R and slope are 0.936 and −1.10, respectively. The excellent correlation coefficient demonstrates that the B–B BDE change patterns in reaction (4) are in good agreement with the values of the sum of the RE (R1) and RE (R2).
 | ||
| Scheme 2 GE of these diboron(4) compounds in reaction (4). | ||
The natural charges of atoms in molecules of three representative diboron(4) compounds in which there is a large B–B BDE difference by the NBO analysis are shown in Fig. 12. It is found that the natural charges of B atoms which are connected to the –OR (–OR = benzo[1,3,2]dioxaborole), –N(CH3)2 and –CH2CH3 groups are larger positive, while the natural charges of the B atoms which are connected to the –SR group (–SR = benzo[1,3,2]dithiaborole) are smaller absolute negative. In addition, in the –OR (–OR = benzo[1,3,2]dioxaborole), –N(CH3)2 and –CH2CH3 groups, the natural charges of O, N and C atoms are larger absolute negative, while in the –SR group (–SR = benzo[1,3,2]dithiaborole), the natural charges of S atoms are smaller positive. Apparently, the different substituents can lead to large differences in the natural charge distributions of atoms.
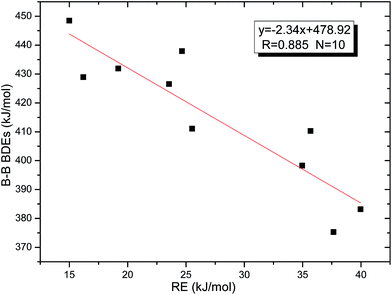
Thirdly, the B–B BDEs of diboron(4) compounds that were shown in reaction (5) were calculated and the values are listed in the Table 5. From the Table 5, it can be found that the only difference between the diboron(4) compounds in reaction (5) and reaction (4) is the R1 and R2 substituent positions, that is, the symmetry of diboron(4) compounds is different. Comparing the B–B BDEs of the two types of the compounds in Tables 4 and 5, the small differences between them can be found, which indicates that the positions of the substituent groups R1 and R2 have little influence on the B–B BDEs. For example, when R1 = –F and R2 = –N(CH3)2 (Entry 1 in Table 5), the B–B BDE is 437.9 kJ mol−1, while for the same substituent groups in Table 4 (Entry 30), the B–B BDE is 433.0 kJ mol−1, and there is only 4.9 kJ mol−1 difference between them. Herein, similar with reaction (3), the GE and RE of these diboron(4) compounds are defined by the enthalpy changes of the reactions (a) and (b) in Scheme 3, and the values are also listed in the Table 5. Comparing the GE values of the diboron(4) compounds in Tables 5 and 4, it is found that there is little difference between the corresponding GE values of the two types of the compounds, which indicates that the different positions of the substituent groups R1 and R2 have little effect on the stability of the molecules. In addition, the linear relationship between the RE values with B–B BDEs was obtained, which is depicted in Fig. 13. It can be seen that the correlation coefficient R and slope are 0.885 and −2.34, respectively, which is better than the correlation between the GE values with B–B BDEs (y = 1.48x + 397.61, R = 0.624). The larger absolute slope of RE values with B–B BDEs (−2.34) shows that the RE plays a stronger role on the B–B BDEs than GE for all of the 10 diboron(4) compounds.
 | ||
| Scheme 3 GE (a) and RE (b) of these diboron(4) compounds in reaction (5). | ||
3.4 The Pt–B and Cu–B BDE predictions after B–B cleavages
In the quantities of experimental studies on the synthetic reactions involving B–B cleavage, the transitional-metal catalysts such as Pt, Pd, Ni, Cu, etc. were universally used. There remain some interesting problems, for example, how the different transition metals specifically affect the B–B cleavage in the reaction process? What are the conformations of the complexes formed after the B–B cleavage? How do the different substituents that appeared in the diboron(4) compounds affect the stability of these complexes? Therefore, in order to better understand the catalytic process involving B–B cleavage by the transitional-metal catalysts, in our present study, the Pt and Cu catalysts were selected as the representatives.The platinum(0) complexes are generally considered to be very effective and common catalysts for the diboration reaction process,114–117 and the catalytic cycling process mainly includes the three steps: oxidative addition (Scheme 4(a)), coordinate on and insertion one of the Pt–B bonds, reductive elimination.14,118 The copper(I) complexes are used as a new and useful catalytic tool for the diboration process,116,119–121 and there are a series of σ-bond metathesis steps in this reaction process, in which the Cu–B bond is formed in the initial metathesis step (Scheme 4(b)) and the two boryl groups are eventually transferred to the substrate.1 Apparently, the Pt–B and Cu–B bonds play an important role in the whole reaction process. How about the strength of the newly formed Pt–B and Cu–B bonds after the B–B cleavage? Therefore, the Pt–B and Cu–B BDEs were calculated by using the SOGGA11-X method and the values are listed in the Table 6. In addition, the ligand L is selected as the P(CH3)3 for the copper(I) complexes.
By comparing the Pt–B and Cu–B BDEs of transition metal boryl complexes with the corresponding B–B BDEs of diboron(4) compounds (in the Table 3), it is found that the Pt–B and Cu–B BDEs are greatly reduced. The ΔBDE values between Pt–B and B–B BDEs as well as Cu–B and B–B BDEs are also listed in the Table 6. For the Pt–B BDEs, it is found that the BDE values are largely reduced (over 100 kJ mol−1) when R1 are –OR, –SR, –NR2 and –alkyl groups, especially when R1 is –C(CH3)3, the Pt–B BDE value is reduced as high as 190.9 kJ mol−1. However, when R1 are –F and –Cl groups, the Pt–B BDE values are reduced by 86.8 kJ mol−1 and 86.9 kJ mol−1, separately. For the Cu–B BDEs, it can be seen that the Cu–B BDE values are decreased by over 100 kJ mol−1 except for the R1 are –C(CH3)3, –F and –Cl groups (73.2 kJ mol−1, 89.5 kJ mol−1 and 82.1 kJ mol−1). The results indicate that the participation of transition metals such as Pt and Cu makes the B–B cleavages become much easier, so that the subsequent processes of the whole reaction can proceed smoothly and the desired products can be obtained. By comparison, when R1 is –C(CH3)3, the Pt–B BDE is much lower than the Cu–B BDE, which indicates that the –C(CH3)3 group is much more favorable to the B–B cleavage under the condition of platinum than copper catalyst from the thermodynamic viewpoint. For the Pt–B and Cu–B BDEs with different substituents, it can be seen that the –OCH3, –NR2 and –alkyl groups are disadvantageous for the complexes stability, that is, the Pt–B and Cu–B cleavages are more favorable and the boryl groups can be better transferred to the substrates.
The energies of frontier orbitals including the highest occupied molecular orbital (HOMO) and the lowest unoccupied molecular orbital (LUMO) of molecules as well as the differences between HOMO and LUMO are also listed in Table 6. From the Table 6, it is found that the Pt–B and Cu–B BDE values are larger (except for the Pt–B BDE of R1 is –C(CH3)3), the absolute energy differences between HOMO and LUMO (EHOMO − ELUMO in Table 6) are larger too. The larger absolute energy differences indicate that the corresponding molecules are more difficult to be activated. In addition, the two good linear relationships between Pt–B (except for the Pt–B BDE of R1 is –C(CH3)3) and Cu–B BDEs with their corresponding EHOMO − ELUMO were obtained, which are depicted in Fig. 14(a) and (b). It can be seen that the slope between Pt–B BDEs with EHOMO − ELUMO is −79.17, while the slope between Cu–B BDEs with EHOMO − ELUMO is −64.06, which demonstrates that the orbital energy effect of platinum complexes is more pronounced than copper complexes.
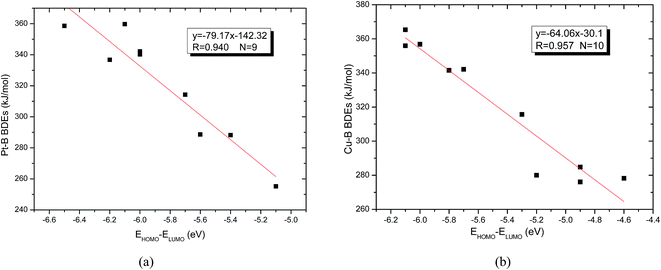 | ||
| Fig. 14 (a) Correlation between Pt–B BDEs with EHOMO − ELUMO. (b) Correlation between Cu–B BDEs with EHOMO − ELUMO. | ||
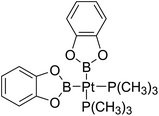
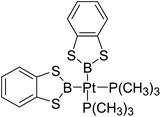
The optimized conformations of platinum complexes with different R1 groups such as [1,3,2]dioxaborinane, –C(CH3)3, –F and the corresponding Pt–B bond lengths as well as the bond angles (B–Pt–B) are shown in Fig. 15. It can be found that the Pt–B bond lengths are all around 2.000 Å, and the three bond angles are 76.38°, 94.75° and 79.64°, respectively. Moreover, when R1 are [1,3,2]dioxaborinane and –F groups, the Pt center exhibits planar conformation, while when R1 is –C(CH3)3, the Pt center is non-planar, which may lead to their Pt–B BDE difference. In addition, for all of the copper complexes with different R1 groups, the Cu centers exhibit linear conformations (not shown in Fig. 15).
3.5 The B–B BDE predictions of several diboron(4) compounds
In our calculations, the B–B BDE predictions of several diboron(4) compounds which were used by experimental chemists in the lab have also been conducted by using SOGGA11-X method, and the values are listed in the Table S2 in the ESI.† These theoretical values can provide experimental chemists with the constructive guidance for the design and development of the diboranes in the reactions.4 Conclusions
The organic synthesis reactions of diboron(4) compounds in which B–B cleavages are involved can introduce a new set of boron-containing organic reagents that was proven to be very useful in many organic synthetic routes and be regarded as ideal candidates for green chemistry. Therefore, it is significant to understand one of the thermodynamic properties of the B–B bond, the strength of the B–B bond, which can be measured by using the homolytic bond dissociation enthalpies (BDEs). In our present study, the 34 diboron(4) compounds in which no more than 6 non-hydrogen atoms are included were selected as the training set and the B–B BDEs were calculated by using the theoretical methods including composite high-level ab initio methods such as G3, G3B3, G4, G4MP2, CBS-Q, CBS-QB3, ROCBS-QB3 and CBS-4M as well as 28 density functional theory (DFT) methods. The results show that it is reasonable and reliable to regard the 34 B–B BDE averages of the five high-level methods including G3, G3B3, CBS-Q, CBS-QB3 and ROCBS-QB3 as the standard reference B–B BDEs, and the SOGGA11-X method is the most accurate method to predict the B–B BDE values with the smallest RMSE value of 4.4 kJ mol−1. The linear correlation coefficient (R) between the 34 B–B BDEs calculated by SOGGA11-X method and the standard reference B–B BDE values is 0.955. Therefore, the B–B BDEs of three types of diboron(4) compounds according to their different molecular symmetry were investigated in detail by using the SOGGA11-X method. The NBO analysis, the GE and RE as well as the frontier orbital energy analysis were performed to further disclose the essence of corresponding BDE change patterns. In order to better understand the catalytic process involving B–B cleavages by the transitional-metal catalysts, the Pt–B and Cu–B BDE predictions after B–B cleavages were also conducted at this level. In addition, the B–B BDE values of several diboron(4) compounds which were used by experimental chemists in the lab were also predicted by using the SOGGA11-X method. The major conclusions are summarized as follows:(1) In the B–B BDE prediction of diboron(4) compounds in reaction (3), it is found that when R1 groups are –OR, –SR, –F and –Cl, the B–B BDEs are larger while when R1 groups are –NR2 and –alkyl, the B–B BDEs are smaller. The GE and RE values provide a way to better understand the different R1 effects on B–B BDEs. The linear relationships between GE values and RE values with B–B BDEs were obtained, which indicates that the RE has a stronger effect on B–B BDEs than GE for the 12 diboron(4) compounds. In addition, the NBO analysis and energies of frontier orbitals further illustrated the B–B BDE change patterns. It can be seen that the absolute energies of the SOMO are larger, the B–B BDE values are larger.
(2) In the B–B BDE prediction of diboron(4) compounds in reaction (4), it is found that when R1 and R2 are both –OR or –SR groups, the B–B BDEs are largest while when R1 and R2 are both –NR2 or –alkyl groups, the B–B BDEs are smallest. Moreover, for the compounds that only one of the substituents, i.e. R1 (or R2) is –OR or –SR groups, the BDEs are relatively larger while for the compounds that only one of the substituents, i.e. R1 (or R2) is –NR2 or –alkyl groups, the B–B BDEs are relatively smaller. In addition, it is found that the B–B BDE values are determined by the co-effects of GE and overall RE. The excellent linear relationship between the overall RE values with B–B BDEs demonstrates that the B–B BDE change patterns are in good agreement with the values of the sum of the RE (R1) and RE (R2).
(3) Comparing the B–B BDEs of the two types of diboron(4) compounds in reaction (5) and reaction (4), the small difference between them indicates that the positions of the substituent groups R1 and R2 have little influence on the B–B BDEs. Similarly, there is also little difference between the GE values of the two types of compounds, which indicates that the different positions of the R1 and R2 have little effect on the stability of the molecules. In addition, the linear relationship between the RE values with B–B BDEs was obtained, which is better than the correlation between the GE values with B–B BDEs, and the larger absolute slope of RE values with B–B BDEs shows that the RE plays a stronger role on the B–B BDEs than GE for all of the 10 diboron(4) compounds.
(4) In the Pt–B and Cu–B BDE predictions of transition metal boryl complexes with different substituents after B–B cleavage, it is found that the participation of transition metals such as Pt and Cu can make the B–B cleavages much easier. The Pt–B BDE is much lower than the Cu–B BDE when R1 is –C(CH3)3, which indicates that the –C(CH3)3 group is much more favorable to the B–B cleavage under the condition of platinum than copper catalyst from the thermodynamic viewpoint. By observing the Pt–B and Cu–B BDEs with different R1 groups, it is found that the –OCH3, –NR2 and –alkyl groups are unfavorable for the complexes stability. In addition, the frontier orbitals energy analysis further illustrates the Pt–B and Cu–B BDE change patterns, and the two good linear relationships between Pt–B and Cu–B BDEs with their corresponding EHOMO − ELUMO were obtained, and the results demonstrate that the orbital energy effect of platinum complexes is more prominent than copper complexes. In the optimized conformations of platinum complexes, it is found that the Pt centers exhibit planar conformations except for R1 = –C(CH3)3 group, while the Cu centers are all linear for the copper complexes with different R1 groups.
Conflicts of interest
There are no conflicts to declare.Acknowledgements
This project is sponsored by the Shanghai University of Engineering Science Innovation Funds for Graduate Students (No. 16KY0412, No. 17KY0409). We also thank the Shanghai Supercomputer Center for the computational resources.References
- E. C. Neeve, S. J. Geier, I. A. I. Mkhalid, S. A. Westcott and T. B. Marder, Chem. Rev., 2016, 116, 9091–9161 CrossRef CAS PubMed.
- A. Stock, A. Brandt and H. Fischer, Ber. Dtsch. Chem. Ges. B, 1925, 58, 643–657 CrossRef.
- W. Yang, X. Gao and B. Wang, Med. Res. Rev., 2003, 23, 346–368 CrossRef CAS PubMed.
- H. Zhao, L. Dang, T. B. Marder and Z. Lin, J. Am. Chem. Soc., 2008, 130, 5586–5594 CrossRef CAS PubMed.
- C. Solé and E. Fernández, Chem.–Asian J, 2009, 4, 1790–1793 Search PubMed.
- A. L. Moure, R. Gómez Arráyas and J. C. Carretero, Chem. Commun., 2011, 47, 6701–6703 RSC.
- K. Knott, J. Fishovitz, S. B. Thorpe, I. Lee and W. L. Santos, Org. Biomol. Chem., 2010, 8, 3451–3456 CAS.
- H. E. Sailes, J. P. Watts and A. Whiting, J. Chem. Soc., Perkin Trans. 1, 2000, 3362–3374 RSC.
- I. A. I. Mkhalid, J. H. Barnard, T. B. Marder, J. M. Murphy and J. F. Hartwig, Chem. Rev., 2010, 110, 890–931 CrossRef CAS PubMed.
- D. Qiu, L. Jin, Z. Zheng, H. Meng, F. Mo, X. Wang, Y. Zhang and J. B. Wang, J. Org. Chem., 2013, 78, 1923–1933 CrossRef CAS PubMed.
- A. J. J. Lennox and G. C. Lloyd-Jones, Chem. Soc. Rev., 2014, 43, 412–443 RSC.
- G. Urry, J. Kerrigan, T. D. Parsons and H. Schlesinger, J. Am. Chem. Soc., 1954, 76, 5299–5301 CrossRef CAS.
- R. W. Rudolph, J. Am. Chem. Soc., 1967, 89, 4216–4217 CrossRef CAS.
- H. Braunschweig, Angew. Chem., Int. Ed., 1998, 37, 1786–1801 CrossRef CAS.
- B. Wrackmeyer, Angew. Chem., Int. Ed., 1999, 38, 771–772 CrossRef CAS.
- A. Bonet, C. Pubill-Ulldemolins, C. Bo, H. Gulyás and E. Fernández, Angew. Chem., Int. Ed., 2011, 50, 7158–7161 CrossRef CAS PubMed.
- A. Bonet, C. Solé, H. Gulyás and E. Fernández, Org. Biomol. Chem., 2012, 10, 6621–6623 CAS.
- C. Pubill-Ulldemolins, A. Bonet, C. Bo, H. Gulyás and E. Fernández, Chem.–Eur. J., 2012, 18, 1121–1126 CrossRef CAS PubMed.
- K. Kubota, H. Iwamoto, E. Yamamoto and H. Ito, Org. Lett., 2015, 17, 620–623 CrossRef CAS PubMed.
- D. D. Vachhani, H. H. Butani, N. Sharma, U. C. Bhoya, A. K. Shah and E. V. Van der Eycken, Chem. Commun., 2015, 51, 14862–14865 RSC.
- C. T. Yang, Z. Q. Zhang, H. Tajuddin, C. C. Wu, J. Liang, J. H. Liu, Y. Fu, M. Czyzewska, P. G. Steel, T. B. Marder and L. Liu, Angew. Chem., Int. Ed., 2012, 51, 528–532 CrossRef CAS PubMed.
- M. Shimizu, T. Fujimoto, H. Minezaki, T. Hata and T. Hiyama, J. Am. Chem. Soc., 2001, 123, 6947–6948 CrossRef CAS.
- S. Crotti, F. Bertolini, F. Macchia and M. Pineschi, Org. Lett., 2009, 11, 3762–3765 CrossRef CAS PubMed.
- M. Pineschi, Synlett, 2014, 25, 1817–1826 CrossRef CAS.
- G. Palau-Lluch, X. Sanz, E. La Cascia, M. G. Civit, N. Miralles, A. B. Cuenca and E. Fernández, Pure Appl. Chem., 2015, 87, 181–193 CrossRef CAS.
- X. Sanz, G. M. Lee, C. Pubill-Ulldemolins, A. Bonet, H. Gulyás, S. A. Westcott, C. Bo and E. Fernández, Org. Biomol. Chem., 2013, 11, 7004–7010 CAS.
- S. Pietsch, E. C. Neeve, D. C. Apperley, R. Bertermann, F. Y. Mo, D. Qiu, M. S. Cheung, L. Dang, J. B. Wang, U. Radius, Z. Lin, C. Kleeberg and T. B. Marder, Chem.–Eur. J., 2015, 21, 7082–7098 CrossRef CAS PubMed.
- L. Zhang, J. Cheng, B. Carry and Z. Hou, J. Am. Chem. Soc., 2012, 134, 14314–14317 CrossRef CAS PubMed.
- K. Semba, T. Fujihara, J. Terao and Y. Tsuji, Chem.–Eur. J., 2012, 18, 4179–4184 CrossRef CAS PubMed.
- A. Parra, L. Amenos, M. Guisan-Ceinos, A. López, J. L. García Ruano and M. Tortosa, J. Am. Chem. Soc., 2014, 136, 15833–15836 CrossRef CAS PubMed.
- Y. Q. Zhou, W. You, K. B. Smith and M. K. Brown, Angew. Chem., Int. Ed., 2014, 53, 3475–3479 CrossRef CAS PubMed.
- W. Su, T. J. Gong, X. Lu, M. Y. Xu, C. G. Yu, Z. Y. Xu, H. Z. Yu, B. Xiao and Y. Fu, Angew. Chem., Int. Ed., 2015, 54, 12957–12961 CrossRef CAS PubMed.
- K. Takahashi, T. Ishiyama and N. Miyaura, Chem. Lett., 2000, 982–983 CrossRef CAS.
- K. Takahashi, T. Ishiyama and N. Miyaura, J. Organomet. Chem., 2001, 625, 47–53 CrossRef CAS.
- C. N. Welch and S. G. Shore, Inorg. Chem., 1968, 7, 225–230 CrossRef CAS.
- W. Biffar, H. Nöth, H. Pommerening and B. Wrackmeyer, Chem. Ber., 1980, 113, 333–341 CrossRef CAS.
- T. Ishiyama, M. Murata, T. A. Ahiko and N. Miyaura, Org. Synth., 2000, 77, 176–185 CrossRef CAS.
- P. Nguyen, G. Lesley, N. J. Taylor, T. B. Marder, N. L. Pickett, W. Clegg, M. R. J. Elsegood and N. C. Norman, Inorg. Chem., 1994, 33, 4623–4624 CrossRef CAS.
- P. Nguyen, R. B. Coapes, A. D. Woodward, N. J. Taylor, J. M. Burke, J. A. K. Howard and T. B. Marder, J. Organomet. Chem., 2002, 652, 77–85 CrossRef CAS.
- C. Zhong, S. Kunii, Y. Kosaka, M. Sawamura and H. Ito, J. Am. Chem. Soc., 2010, 132, 11440–11442 CrossRef CAS PubMed.
- S. Sebelius, V. J. Olsson and K. J. Szabó, J. Am. Chem. Soc., 2005, 127, 10478–10479 CrossRef CAS PubMed.
- F. G. Bordwell and X. M. Zhang, Acc. Chem. Res., 1993, 26, 510–517 CrossRef CAS.
- J. Kovac, J. Chem. Educ., 2012, 89, 1485–1486 CrossRef CAS.
- A. Wong, D. Laurencin, G. Wu, R. Dupree and M. E. Smith, J. Phys. Chem. A, 2008, 112, 9807–9813 CrossRef CAS PubMed.
- L. W. Mire, S. D. Wheeler, E. Wagenseller and D. S. Marynick, Inorg. Chem., 1998, 37, 3099–3106 CrossRef CAS.
- X. J. Qi, Y. Feng, L. Liu and Q. X. Guo, Chin. J. Chem., 2005, 23, 194–199 CrossRef CAS.
- X. Q. Yao, X. J. Hou, H. J. Jiao, H. W. Xiang and Y. W. Li, J. Phys. Chem. A, 2003, 107, 9991–9996 CrossRef CAS.
- Y. Feng, L. Liu, J. T. Wang, H. Huang and Q. X. Guo, J. Chem. Inf. Comput. Sci., 2003, 43, 2005–2013 CrossRef CAS PubMed.
- P. R. Rablen, J. Am. Chem. Soc., 1997, 119, 8350–8360 CrossRef CAS.
- J. Y. Wang, W. R. Zheng, L. L. Ding and Y. X. Wang, New J. Chem., 2017, 41, 1346–1362 RSC.
- L. C. Ducati, N. Takagi and G. Frenking, J. Phys. Chem. A, 2009, 113, 11693–11698 CrossRef CAS PubMed.
- S. Sakaki and T. Kikuno, Inorg. Chem., 1997, 36, 226–229 CrossRef CAS.
- S. J. Blanksby and G. B. Ellison, Acc. Chem. Res., 2003, 36, 255–263 CrossRef CAS PubMed.
- Y. H. Cheng, X. Zhao, K. S. Song, L. Liu and Q. X. Guo, J. Org. Chem., 2002, 67, 6638–6645 CrossRef CAS PubMed.
- K. S. Song, L. Liu and Q. X. Guo, J. Org. Chem., 2003, 68, 262–266 CrossRef CAS PubMed.
- M. J. Frisch, G. W. Trucks, H. B. Schlegel, G. E. Scuseria, M. A. Robb, J. R. Cheeseman, G. Scalmani, V. Barone, B. Mennucci, G. A. Petersson, H. Nakatsuji, M. Caricato, X. Li, H. P. Hratchian, A. F. Izmaylov, J. Bloino, G. Zheng, J. L. Sonnenberg, M. Hada, M. Ehara, K. Toyota, R. Fukuda, J. Hasegawa, M. Ishida, T. Nakajima, Y. Honda, O. Kitao, H. Nakai, T. Vreven, J. A. Montgomery Jr, J. E. Peralta, F. Ogliaro, M. Bearpark, J. J. Heyd, E. Brothers, K. N. Kudin, V. N. Staroverov, R. Kobayashi, J. Normand, K. Raghavachari, A. Rendell, J. C. Burant, S. S. Iyengar, J. Tomasi, M. Cossi, N. Rega, J. M. Millam, M. Klene, J. E. Knox, J. B. Cross, V. Bakken, C. Adamo, J. Jaramillo, R. Gomperts, R. E. Stratmann, O. Yazyev, A. J. Austin, R. Cammi, C. Pomelli, J. W. Ochterski, R. L. Martin, K. Morokuma, V. G. Zakrzewski, G. A. Voth, P. Salvador, J. J. Dannenberg, S. Dapprich, A. D. Daniels, O. Farkas, J. B. Foresman, J. V. Ortiz, J. Cioslowski and D. J. Fox, Gaussian 09 Revision A.1, Gaussian Inc., Wallingford CT, 2009 Search PubMed.
- L. A. Curtiss, K. Raghavachari, P. C. Redfern, V. Rassolov and J. A. Pople, J. Chem. Phys., 1998, 109, 7764–7776 CrossRef CAS.
- L. A. Curtiss, P. C. Redfern and K. Raghavachari, J. Chem. Phys., 2007, 126, 084108 CrossRef PubMed.
- A. G. Baboul, L. A. Curtiss and P. C. Redfern, J. Chem. Phys., 1999, 110, 7650–7657 CrossRef CAS.
- Y. Fu, X. Y. Dong, Y. M. Wang, L. Liu and Q. X. Guo, Chin. J. Chem., 2005, 23, 474–482 CrossRef CAS.
- L. A. Curtiss, P. C. Redfern and K. Raghavachari, J. Chem. Phys., 2007, 127, 124105 CrossRef PubMed.
- J. W. Ochterski, G. A. Petersson and K. B. Wiberg, J. Am. Chem. Soc., 1995, 117, 11299–11308 CrossRef CAS.
- A. D. Becke, J. Chem. Phys., 1993, 98, 5648–5652 CrossRef CAS.
- Y. Fu, Y. Mou, B. L. Lin, L. Liu and Q. X. Guo, J. Phys. Chem. A, 2002, 106, 12386–12392 CrossRef CAS.
- J. A. Montgomery Jr, M. J. Frisch, J. W. Ochterski and G. A. Petersson, J. Chem. Phys., 1999, 110, 2822–2827 CrossRef.
- C. Lee, W. Yang and R. G. Parr, Phys. Rev. B: Condens. Matter Mater. Phys., 1988, 37, 785–789 CrossRef CAS.
- G. P. F. Wood, L. Radom, G. A. Petersson, E. C. Barnes, M. J. Frisch and J. A. Montgomery Jr, J. Chem. Phys., 2006, 125, 1–16 CrossRef PubMed.
- Y. Zhao and D. G. Truhlar, J. Phys. Chem. A, 2006, 110, 13126–13130 CrossRef CAS PubMed.
- Y. Zhao, N. E. Schultz and D. G. Truhlar, J. Chem. Theory Comput., 2006, 2, 364–382 CrossRef PubMed.
- J. D. Chai and M. Head-Gordon, J. Chem. Phys., 2008, 128, 084106 CrossRef PubMed.
- R. Peverati and D. G. Truhlar, Phys. Chem. Chem. Phys., 2012, 14, 16187–16191 RSC.
- A. D. Boese and J. M. L. Martin, J. Chem. Phys., 2004, 8, 3405–3442 CrossRef PubMed.
- R. Peverati and D. G. Truhlar, J. Chem. Phys., 2011, 135, 191102 CrossRef PubMed.
- J. D. Chai and M. Head-Gordon, Phys. Chem. Chem. Phys., 2008, 10, 6615–6623 RSC.
- Y. Zhao and D. G. Truhlar, Theor. Chem. Acc., 2008, 120, 215–241 CrossRef CAS.
- Y. Zhao and D. G. Truhlar, Theor. Chem. Acc., 2008, 41, 157–167 CrossRef CAS PubMed.
- H. S. Rzepa, Org. Lett., 2005, 7, 4637–4639 CrossRef CAS PubMed.
- R. Peverati and D. G. Truhlar, Phys. Chem. Chem. Phys., 2012, 14, 13171–13174 RSC.
- R. Peverati and D. G. Truhlar, J. Phys. Chem. Lett., 2011, 2, 2810–2817 CrossRef CAS.
- Y. Zhao and D. G. Truhlar, J. Phys. Chem. A, 2004, 108, 6908–6918 CrossRef CAS.
- J. Yang and M. P. Waller, J. Phys. Chem. A, 2013, 117, 174–182 CrossRef CAS PubMed.
- J. P. Perdew, K. Burke and Y. Wang, Phys. Rev. B: Condens. Matter Mater. Phys., 1996, 54, 16533–16539 CrossRef CAS.
- R. Peverati and D. G. Truhlar, J. Chem. Theory Comput., 2012, 8, 2310–2319 CrossRef CAS PubMed.
- J. P. Perdew, Phys. Rev. B: Condens. Matter Mater. Phys., 1986, 33, 8822–8824 CrossRef.
- S. Grimme, J. Antony, S. Ehrlich and H. Krieg, J. Chem. Phys., 2010, 132, 154104 CrossRef PubMed.
- Y. Zhao, N. E. Schultz and D. G. Truhlar, J. Chem. Phys., 2005, 123, 161103 CrossRef PubMed.
- Y. Zhao and D. G. Truhlar, J. Chem. Phys., 2006, 125, 194101 CrossRef PubMed.
- T. Yanai, D. P. Tew and N. C. Handy, Chem. Phys. Lett., 2004, 393, 51–57 CrossRef CAS.
- M. Ernzerhof and G. E. Scuseria, J. Chem. Phys., 1999, 110, 5029–5036 CrossRef CAS.
- R. Peverati, Y. Zhao and D. G. Truhlar, J. Phys. Chem. Lett., 2011, 2, 1991–1997 CrossRef CAS.
- B. J. Lynch, P. L. Fast, M. Harris and D. G. Truhlar, J. Phys. Chem. A, 2000, 104, 4811–4815 CrossRef CAS.
- R. Peverati and D. G. Truhlar, J. Phys. Chem. Lett., 2012, 3, 117–124 CrossRef CAS.
- S. Grimme, J. Comput. Chem., 2006, 27, 1787–1799 CrossRef CAS PubMed.
- Y. Fu, L. Liu, H. Z. Yu, Y. M. Wang and Q. X. Guo, J. Am. Chem. Soc., 2005, 127, 7227–7234 CrossRef CAS PubMed.
- B. Lambie, R. Ramaekers and G. Maes, J. Phys. Chem. A, 2004, 108, 10426–10433 CrossRef CAS.
- A. Modelli, L. Mussoni and D. Fabbri, J. Phys. Chem. A, 2006, 110, 6482–6486 CrossRef CAS PubMed.
- Y. Jiang, H. Yu, Y. Fu and L. Liu, Sci. China: Chem., 2015, 58, 673–683 CrossRef CAS.
- A. D. Becke, Phys. Rev. A: At., Mol., Opt. Phys., 1988, 38, 3098–3100 CrossRef CAS.
- J. A. Pople, M. Head-Gordon, D. J. Fox, K. Raghavachari and L. A. Curtiss, J. Chem. Phys., 1989, 90, 5622–5629 CrossRef CAS.
- L. A. Curtiss, K. Raghavachari, G. W. Trucks and J. A. Pople, J. Chem. Phys., 1991, 94, 7221–7230 CrossRef CAS.
- J. W. Ochterski, G. A. Petersson and J. A. Montgomery Jr, J. Chem. Phys., 1996, 104, 2598–2619 CrossRef CAS.
- G. P. F. Wood, L. Radom, G. A. Petersson, E. C. Barnes, M. J. Frisch and J. A. Montgomery Jr, J. Chem. Phys., 2006, 125, 094106 CrossRef PubMed.
- L. L. Ding, W. R. Zheng and Y. X. Wang, New J. Chem., 2015, 39, 6935–6943 RSC.
- Y. X. Wang and W. R. Zheng, J. Sulfur Chem., 2015, 36, 155–159 CrossRef CAS.
- Y. Feng, L. Liu, J. T. Wang, S. W. Zhao and Q. X. Guo, J. Org. Chem., 2004, 69, 3129–3138 CrossRef CAS PubMed.
- A. K. Chandra, P. C. Nam and M. T. Nguyen, J. Phys. Chem. A, 2003, 107, 9182–9188 CrossRef CAS.
- W. R. Zheng, W. X. Xu, Y. X. Wang and Z. C. Chen, Comput. Theor. Chem., 2014, 1027, 116–124 CrossRef CAS.
- W. R. Zheng, Z. L. Guo, Z. C. Chen, Q. Yang and T. Huang, Res. Chem. Intermed., 2012, 38, 1791–1806 CrossRef CAS.
- M. Arrowsmith, J. Böhnke, H. Braunschweig, A. Deißenberger, R. D. Dewhurst, W. C. Ewing, C. Hörl, J. Mies and J. H. Muessig, Chem. Commun., 2017, 53, 8265–8267 RSC.
- I. Demachy and F. Volatron, J. Phys. Chem., 1994, 98, 10728–10734 CrossRef CAS.
- J. Shi, X. Y. Huang, J. P. Wang and R. Li, J. Phys. Chem. A, 2010, 114, 6263–6272 CrossRef CAS PubMed.
- Y. D. Wu and D. W. K. Lai, J. Org. Chem., 1996, 61, 7904–7910 CrossRef CAS PubMed.
- Y. M. Wang, C. Zhou, Y. Fu, L. Liu and Q. X. Guo, Chin. J. Org. Chem., 2005, 25, 1398–1402 CAS.
- J. Takaya and N. Iwasawa, ACS Catal., 2012, 2, 1993–2006 CrossRef CAS.
- V. M. Dembitsky, H. A. Ali and M. Srebnik, Advances in Organometallic Chemistry, Academic Press, Cambridge, 2004, pp. 193–250 Search PubMed.
- S. A. Westcott and E. Fernández, Advances in Organometallic Chemistry, Academic Press, Cambridge, 2015, pp. 39–89 Search PubMed.
- R. Barbeyron, E. Benedetti, J. Cossy, J. J. Vasseur, S. Arseniyadis and M. Smietana, Tetrahedron, 2014, 70, 8431–8452 CrossRef CAS.
- T. Ishiyama, N. Matsuda, M. Murata, F. Ozawa, A. Suzuki and N. Miyaura, Organometallics, 1996, 15, 713–720 CrossRef CAS.
- D. S. Laitar, P. Mueller and J. P. Sadighi, J. Am. Chem. Soc., 2005, 127, 17196–17197 CrossRef CAS PubMed.
- D. S. Laitar, E. Y. Tsui and J. P. Sadighi, J. Am. Chem. Soc., 2006, 128, 11036–11037 CrossRef CAS PubMed.
- V. Lillo, M. R. Fructos, J. Ramírez, A. A. C. Braga, F. Maseras, M. M. Díaz-Requejo, P. J. Perez and E. Fernández, Chem.–Eur. J, 2007, 13, 2614–2621 CrossRef CAS PubMed.
Footnote |
| † Electronic supplementary information (ESI) available. See DOI: 10.1039/c7ra09006d |
| This journal is © The Royal Society of Chemistry 2017 |


