 Open Access Article
Creative Commons Attribution 3.0 Unported Licence
A stable 3D Cd(II) metal–organic framework for highly sensitive detection of Cu2+ ions and nitroaromatic explosives†
Jian-Long Du *ab,
Ju-Ping Gaoab,
Chao-Ping Liab,
Xiao-Ying Zhangab,
Jin-Xin Houab,
Xu Jing*ad,
Ya-Juan Muc and
Li-Jun Liab
aCollege of Chemistry & Environmental Science, Chemical Biology Key Laboratory of Hebei Province, Hebei University, Baoding 071002, P. R. China. E-mail: dujl@hbu.cn; Jingxu3@126.com; Tel: +86-312-5079359
bKey Laboratory of Medicinal Chemistry, Molecular Diagnosis of Ministry of Education, Hebei University, Baoding 071002, P. R. China
cCollege of Traditional Chinese Medicine, Hebei University, Baoding 071000, P. R. China
dState Key Laboratory of Fine Chemicals, Dalian University of Technology, Dalian 116024, P. R.China
First published on 25th October 2017
Abstract
A Cd(II) coordination polymer, [Cd3(L)2(H2O)5]·(H2O)4 (1) (H3L = 9-(4-carboxy-phenyl)-9H-carbazoly-3,6-dicarboxylic acid) has been synthesized solvothermally. Compound 1 exhibits excellent luminescence and good stability in aqueous and DMF solution. In particular, 1 can detect Cu2+ ions through fluorescence quenching in aqueous solution. In addition, 1 also shows a highly sensitive response to some nitroaromatic compounds (NACs) in DMF solution. Thus, 1 can serve as a promising luminescent sensor for detecting Cu2+ ions and NACs.
1. Introduction
Nowadays, rapid detection of metal ions and nitroaromatic compounds (NACs) has attracted much attention because of their importance for environmental safety and homeland security.1–4 Among different metal ions, Cu2+ ion is one of the most essential ions in living biosystems, especially in the brain.5 Both deficiency and overload of copper may cause some types of severe diseases, for instance hematological manifestations, Alzheimer's, and Wilson's diseases.6 On the other hand, with the development of chemical industry all over the world, some widely used chemicals such as nitroaromatic compounds (NACs) have become a highlight research focus in recent years due to their high toxicity to the environment and human health, especially due to their easy explosivity. Therefore, the development of convenient, cost effective Cu2+ ions and NAC detecting methods is a very important issue.Metal–organic frameworks (MOFs) have diversity of structures,7–9 which have been widely applied in recent years.10–17 Among different types of MOFs, excellent stability and specific structure endow luminescent MOFs the ability to detect metal ions (Cu2+, Fe3+), explosives (nitrobenzene, 4-nitrophenol, TNT, and 2,4,6-trinitrophenol), and inorganic anions (NO3−, Cl−, CrO42−).18–28 Compared with other detailed methods, luminescent MOFs as the probes have the advantages of outstanding sensitivity, fast response, easy manipulation and cost-effective. Recently, luminescent MOFs act as chemical sensors have been reported. Cao have designed a water stable luminescent MOF, which can rapidly sensing of Fe3+ and Al3+ ions from mixed metal ions.29 Jia have chosen a fluorescent anionic MOF sensing of Cr3+ ion and TNP.30 To the best of our knowledge, luminescent MOFs act as sensors of both Cu2+ ion and NACs are still relatively rare.31
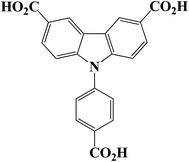
Herein, we select a tricarboxylic acid (9-(4-carboxy-phenyl)-9H-carbazolyl-3,6-dicarboxylic acid, H3L) as a ligand (Scheme 1), Cd(II) ions as the metal nodes to synthesis a luminescent Cd-MOF. Choosing these materials to construct MOFs is mainly based on the following considerations: (1) H3L ligand is a π electron-rich organic ligand with good electron-transferring ability. The carboxylate groups can take multi coordination modes to meet the coordination requirements of the metal ions; (2) Cd(II) ions have different coordination numbers and can provide multi-coordination modes, which help to construct high dimensional coordination networks; (3) MOFs built from π-conjugated ligands and d10 metal ions, such as Cd2+ ion, are promising luminescent candidates. Therefore, a novel luminescent Cd-MOF (1), has been designed and synthesized using H3L ligand and Cd2+ ion under solvothermal condition, which exhibits good stability in both aqueous and DMF solution. Compound 1 can detect Cu2+ ions and NACs through fluorescence quenching with high sensitivity. In addition, the possible quenching mechanisms have also been discussed.
2. Experimental
2.1 Materials and general methods
All reagents were obtained commercially and purified by standard methods prior to use. H3L was synthesized by modified the literature method (Scheme S1 in the ESI†). 1H NMR spectra were recorded on a Bruker Advance III 600 spectrometer medium at 25 °C with tetramethylsilane as the internal reference. The IR absorption spectra were recorded in the range of 4000–400 cm−1 on a Nicolet 380 FT-IR spectrophotometer with KBr pellets. Elemental analyses were performed on a CE-440 elemental analyzer. Power X-ray diffractions patterns (PXRD) were collected on a Bruker D8 ADVANCE diffractometer with Cu-Kα radiation (λ = 1.5418 Å). Thermogravimetric analysis (TGA) was performed under a nitrogen atmosphere with a heating rate of 10 °C min−1 using a NETZSCH STA 449C unit. Fluorescence spectra were recorded on a Hitachi F-7000 fluorescence spectrophotometer which was equipped with a xenon lamp and a quartz carrier at ambient temperature. X-ray photoelectron spectroscopy (XPS) was performed on the Thermo Scientific ESCALab 250Xi using 200 W monochromated Al Kα radiation.2.2 Synthesis of compound 1
[Cd3(L)2(H2O)5]·(H2O)4 A mixture of H3L (3 mg, 0.008 mmol), 3CdSO4·8H2O (50 mg, 0.065 mmol) DMF (2 mL), and H2O (3 mL), was put into a 10 mL glass vial and subsequently heated to 80 °C for 48 h, after cooled, yellow block crystals of 1 was obtained. Yield: 32%. FT-IR (KBr pellet, cm−1): 3431 m, 1653 w, 1603 s, 1542 m, 1472 m, 1390 s, 1294 w, 1277 w, 781 s, 680 w, 648 w, 526 w, 487 w. Anal. calcd for C42H38N2O21Cd3: C, 40.55; H, 3.08; N, 2.25; found: C, 40.61; H, 3.14; N, 2.19%.2.3 Crystal structures determination
Single-crystal X-ray diffraction measurements for compound 1 was carried out on a Bruker AXS Smart APEX-II diffractometer with Mo-Kα radiation (λ = 0.71073 Å) at 293 K. Data processing was completed with the SAINT processing program.32 The structure was solved by direct methods and refined on F2 by full-matrix least-squares with the SHELX-97 program.33 All non-hydrogen atoms were refined with anisotropic displacement parameters, the C19 carboxyl and its coordinated atoms of Cd4 and Cd5 were all refined with a disorder model. Hydrogen atoms were added theoretically, riding on the concerned atoms and refined with fixed thermal factors, and the hydrogen on water molecules were not located. Attempts to locate and model the highly disordered solvent molecules in the pores were unsuccessful. Therefore, the SQUEEZE routine of PLATON was used to remove the diffraction contribution from guests to produce a set of solvent-free diffraction intensities. The guest molecules can be calculated according to the TGA and elemental analyses. The crystallographic data for 1 is summarized in Table S1,† and selected bond lengths and angles are given in Table S2† of the ESI.CCDC reference number 1556041 (for 1).†
2.4 Luminescent measurement
For the properties of sensing with respect to various metal ions, the compound 1 (18 mg) was grinded into the powder and suspended in 18 mL aqueous solution, sonicated for 30 min to ensure even dispersion. M(NO3)x (1 × 10−3 M; M = Na+, K+, Ag+, Mg2+, Co2+, Ca2+, Ni2+, Zn2+, Cd2+, Mn2+, Cu2+, Hg2+, and Cr3+) was added into the aqueous suspension of compound 1 at room temperature, respectively. For the sensing of NACs, compound 1 (2 mg) was immersed in 2 mL of the different organic solvents (acetonitrile (MeCN), N,N′-dimethyl formamide (DMF), tetrahydrofuran (THF), dichloromethane (DCM), acetone (DMK), methanol (MeOH), and nitrobenzene (NB)) at room temperature, then used for luminesent measurements immediately.3. Results and discussion
3.1 Crystal structure of [Cd3(L)2(H2O)5]·(H2O)4
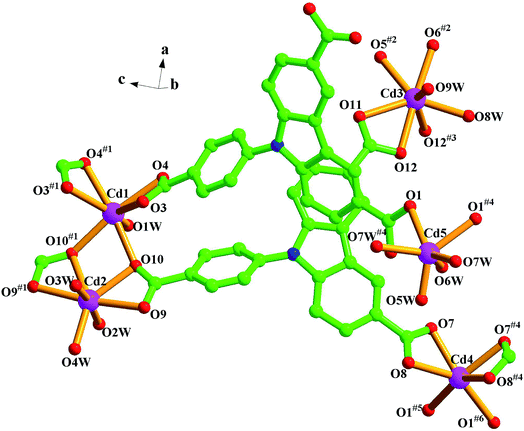
Single-crystal structure analysis reveals that compound 1 crystallizes in the orthorhombic system with a Pbam space group. The asymmetry unit contains three crystallographically independent Cd2+ ions, two L3− ligands, five coordination water molecules, and four lattice water molecules. As illustrated in Fig. 1 and S1,† Cd1, Cd2, and Cd3 are involved in seven-coordinate sites, but the detailed environments are different. Cd1 is coordinated by six carboxylate oxygen atoms (O3, O3#1, O4, O4#1, O10, O10#1) from four L3− ligands and one water molecule (O1W). Around Cd2, four carboxylate oxygen atoms (O9, O9#1, O10, O10#1) of two different L3− ligands and three water molecules (O2W, O3W, O4W). For Cd3, seven coordinated oxygen atoms come from five carboxylate oxygen atoms (O5#2, O6#2, O11, O12, O12#3) in three different ligands, and two water molecules (O8W, O9W). So Cd1, Cd2 and Cd3 adopt distorted pentagonal bipyramidal geometries. While, Cd4 and Cd5 show six-coordinate modes and they are located at octahedral geometries. Around Cd4, there are six carboxylate oxygen atoms (O1#5, O1#6, O7, O8, O7#4, O8#4) from four different L3− ligands, while Cd5(II) is surrounded by two oxygen atoms (O1, O1#4) from different L3− ligands and four water molecules (O5W, O6W, O7W, O7W#4). And all the Cd–O bond distances between 1.86(4) and 2.480(8) Å, with O–Cd–O angles are between 53.5(3)° and 176.7(4)°.From a topological viewpoint, every two Cd2+ ions (Cd1 and Cd2, Cd3 and Cd3#3, Cd4 and Cd5) are bridged by carboxyl groups, which form a binuclear cluster. Each cluster is linked by four L3−, which can be regarded as four-connected node (Fig. 2b). And the carboxyl groups of each L3− ligand are respectively linked to three binuclear clusters, therefore, each L3− ligand can be considered as a three-connected node (Fig. 2a). With the linkage of ligands, the whole molecule exhibits a 3D coordination network, which can be simplified into a (3, 4, 4, 4) net with the symbol of (4·82)4(42·84)2(84·122) (Fig. 2c).
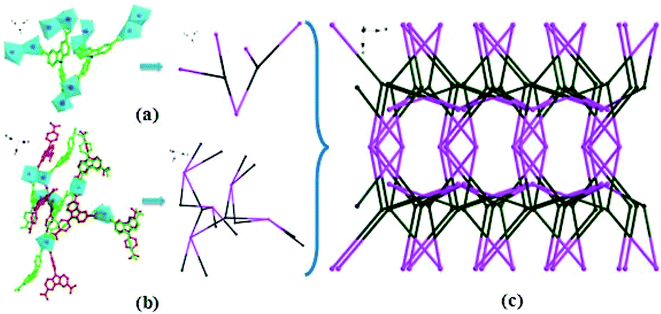 | ||
| Fig. 2 View of (a) L3− ligand considered as a three-connected node; (b) Cd(II) regarded as four-connected node; (c) the 3, 4, 4, 4-connected 3D topology of 1. | ||
3.2 PXRD and thermal stability of 1
The PXRD patterns show that the main peaks of the synthesized MOFs are closely consistent with the simulated one, indicating the high phase purity of the samples of 1 (Fig. S2†). Thermal gravimetric analysis (TGA) of 1 was conducted under nitrogen atmosphere from 25 °C to 800 °C with a heating rate of 10 °C min−1. A weight loss from 25 °C is due to the departure of five coordinated water molecules and four free water moleculues (obsd 13.38%, calcd 13.02%). And the framework of 1 begins to collapse at about 380 °C, indicating that compound 1 has good thermal stability (Fig. S3†).3.3 Luminescent properties
MOFs containing d10 metal ions had been attracted much attention for their potential applications as chemical sensors.34 The luminescent behaviors of the H3L ligand and compound 1 were tested (Fig. S4†). Upon excitation at 356 nm for H3L and 366 nm for compound 1, the MOF shows the resemblant emission peak with the organic ligand at about 420 nm, indicating that the luminescence of 1 is mainly based on the ligand-centered π–π* electronic transitions. Because of the good stability of 1 in both aqueous and DMF solution, it may be selected as the potential fluorescent materials (Fig. S2†).3.4 Sensing of metal ions
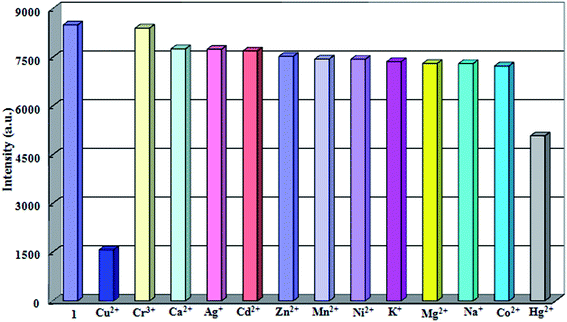
For the purpose of studying sensing ability to different metal ions, 1 (18 mg) was grinded into the powder and suspended in 18 mL aqueous solution, sonicated for 30 min to ensure even dispersion. M(NO3)x (1 × 10−3 M; M = Na+, K+, Ag+, Mg2+, Co2+, Ca2+, Ni2+, Zn2+, Cd2+, Mn2+, Cu2+, Hg2+ and Cr3+) was added into the aqueous suspension of 1 at room temperature, respectively. As shown in Fig. 3, Cu2+ ion exhibits an extremely significant quenching effect on the luminescence intensity, while Hg2+ ion shows a little degree of luminescence quenching, and almost no intensity change can be observed in the case of other metal ions, indicating 1 could detect Cu2+ ions through luminescence quenching. Further, the anti-interference experiments were investigated by introduction of Na+, K+, Ag+, Mg2+, Co2+, Ca2+, Ni2+, Zn2+, Cd2+, Mn2+, Hg2+ and Cr3+ into the system (Fig. 4). As a result, it indicated that 1 displayed the higher selectivity for Cu2+ ions among other metal ions.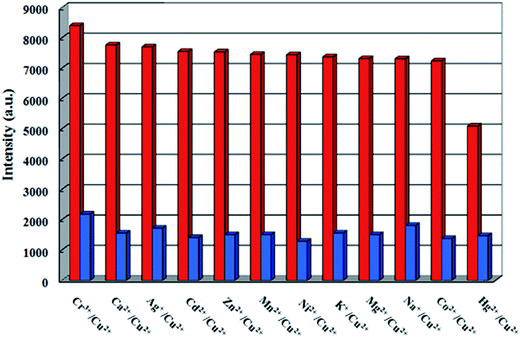 | ||
| Fig. 4 Luminescence intensity of 1 in the presence of different metal ions (1 M, red: 1 + other metal ions, blue: 1 + other metal ions + Cu2+ ion). | ||
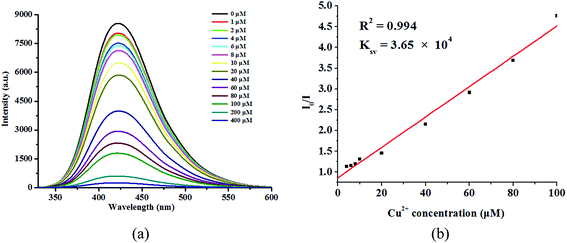
To better understand the luminescence response of 1 to Cu2+ ions, the quantitative luminescence titration experiments were performed. The luminescence intensity of 1 gradually decreases with increasing concentration of Cu2+ ions (Fig. 5a). When the concentration of Cu2+ ions increases to 4 × 10⁻⁴ M, the quenching efficiency could almost reach 100%. Quantitatively, the quenching efficiency can be explained by the Stern–Volmer equation: I0/I = 1 + Ksv[M]. The Ksv was calculated to be 3.65 × 10⁴ M−l (Fig. 5b), which is higher than some reported MOFs for Cu2+ ions sensing in aqueous solution.35–37
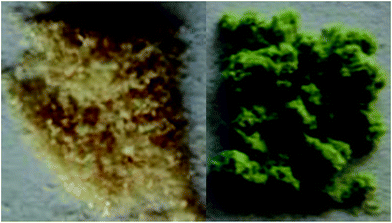
Moreover, compound 1 performed a significant color change, after it was soaked in the aqueous solution of Cu(NO3)2 with 10−3 M, indicating that it can be considered as a naked-eye detector for Cu2+ ions (Fig. 6), and the PXRD patterns of the product are in agreement with the simulated one (Fig. S5a†), showing that 1 keeps its original framework after soaking study. And the quenching mechanism can not be attributed to crystallographic alteration. As shown in Fig. 1a, the ions (Cd4 and Cd5) are located in six-coordinate environments. While, the coordination number of Cd2+ ion is usually more than six, the coordination polyhedrons are not stable and can be exchanged by other metal ions.38,39 In addition, the significant color change of 1 reveals that Cu2+ ions may be incorporated into 1. XPS (X-ray photoelectron spectroscopy) measurements were carried out to confirm the valency of copper in 1 and the peak at 932.58 eV can be considered to be Cu2p3 spectra according to the former reports (Fig. S6†). The results suggest the presence of Cu2+ ions in Cd-MOF. Because of the unsaturated electronic state (3d9) of Cu2+ ion, the excited electrons can transfer from the organic ligand (L3−) to the empty d orbital of Cu2+ ions through the coordinate bonds. The transfer process hinders the photoluminescence and leading to the luminescence quenching phenomenon.37 Moreover, the recyclable experiments (Fig. S7†) also indicate that Cd2+ ions of 1 may be partly exchanged by Cu2+ ions, because the luminescent intensity of 1 decreases after every run sensing. The high sensitivity and highly stability make 1 as a potential candidate for sensing Cu2+ ions in aqueous solution.
3.5 Sensing of nitroaromatic compounds
To investigate the sensitivity of 1 to small molecules, the luminescent intensities of some solvent suspensions were investigated. Several analyte molecules, such as acetonitrile (MeCN), N,N′-dimethyl formamide (DMF), tetrahydrofuran (THF), dichloromethane (DCM), acetone (DMK), methanol (MeOH), and nitrobenzene (NB) were selected. The emission spectra of different solvent suspensions have a degree of luminescence change upon excitation at 366 nm (Fig. 7). While NB exhibits the most effect quenching behavior for 1, it turn out to be 1 can serve as the sensor for detecting NB.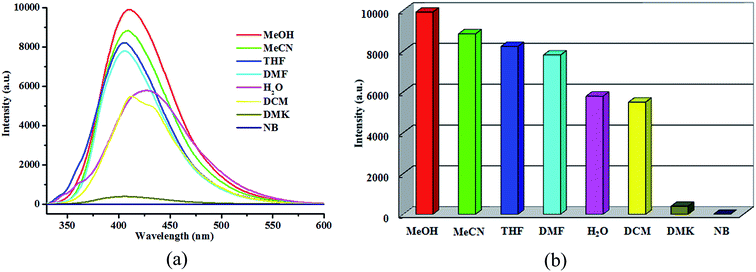 | ||
| Fig. 7 View of (a) emission spectra of 1 in different organic solvents; (b) luminescence intensities of 1 in different organic solvents. | ||
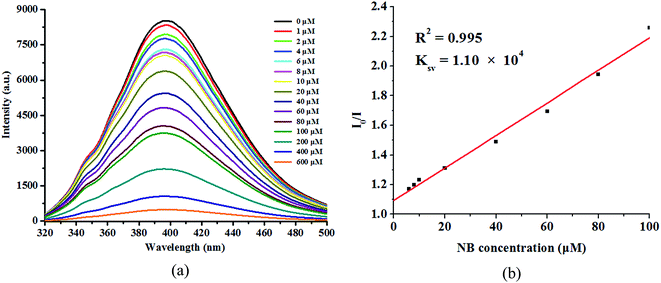
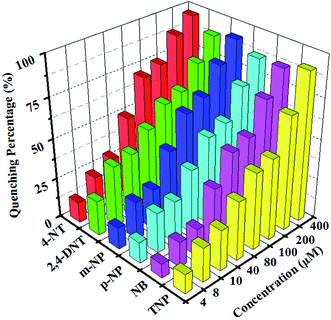
The relationship between the luminescent intensities and the concentration of NB, was studied by gradual addition of NB to the DMF suspension of 1 (Fig. 8a). The luminescent intensity of 1 is quenched completely at the concentration of NB up to 6 × 10⁻⁴ M, indicating that compound 1 has a good detectability to NB, and can also keep its original structure (Fig. S5b†). The Ksv value for NB was calculated to be 1.10 × 10⁴ M−l (Fig. 8b). The good quenching effect of NB prompted us to further test other NACs. 4-NT, 2,4-DNT, m-NP, p-NP, and TNP were added to studied the corresponding emission responses (Fig. S8†). In S8, a new emission between 460–480 nm appeared when the concentration of TNP was added up to 200 μM, which could be attributed to either energy transfer from the excited donor or the direct excitation of the analyte.40,41 The concentration of NACs is 60 μM, the fluorescence quenching efficiencies of 4-NT, 2,4-DNT, m-NP, p-NP, TNP and NB are 97%, 97%, 95%, 94%, 97%, 94%, respectively (Fig. 9). It shows that 1 can also be highly sensitive to identify a variety of NACs. Furthermore, compound 1 can be recycled by centrifuging the dispersed solution and washing several times by DMF. The quenching efficiencies for sensing TNP is basically unchanged up to three cycles, suggesting that 1 can also be a potential NACs fluorescent sensor (Fig. S9†).
The electron-rich π-conjugated ligand has a higher LUMO energy than the analytes (Table S3†). One possible quenching mechanism may be ascribed to the photo-induced electron transfer (PET) from an electron-rich excited MOF to the electron-deficient NACs.42,43 But the order of quenching efficiency is not in accordance with the LUMO energies, which indicates that may exist other mechanisms. The absorption spectra of NACs and the emission spectrum of 1 have been carefully studied, the overlap between them usually results in the resonance energy transfer (RET) process, which also can cause the quenching of the fluorescence intensity (Fig. S10†).44–46 Under the influence of two different mechanisms, all NACs show similar quenching efficiencies in the present research.
4. Conclusions
In summary, a new 3D luminescent Cd-MOF (1) was synthesized by solvothermal reaction. The compound can detect Cu2+ ions and NACs sensitively through luminescence quenching method. Furthermore, it can be considered as a naked-eye detector for Cu2+ ions. And the structure of 1 remains stable after soaked in Cu(NO3)2 or NB solution. All the results suggest that 1 is a promising luminescent sensor for Cu2+ ions and NACs.Conflicts of interest
There are no conflicts to declare.Acknowledgements
This work was supported by the National Natural Science Foundation of China (21501041), the Natural Science Foundation of Hebei Province, China (B2017201094, B2017201131), the State Key Laboratory of Fine Chemicals (KF1501), and Post-graduate's Innovation Fund Project of Hebei Province (CXZZSS2017011).References
- L. Y. Pang, N. N. Bai, J. C. Jin, G. P. Yang, Y. L. Wu, X. J. Luan and Y. Y. Wang, ChemistrySelect, 2016, 1, 3946–3953 CrossRef CAS.
- X. Zhang, Z. J. Wang, S. G. Chen, Z. Z. Shi, J. X. Chen and H. G. Zheng, Dalton Trans., 2017, 46, 2332–2338 RSC.
- Y. Salinas, R. Martinez-Manez, M. D. Marcos, F. Sancenon, A. M. Castero, M. Parra and S. Gil, Chem. Soc. Rev., 2012, 41, 1261–1296 RSC.
- A. Lan, K. Li, H. Wu, D. H. Olson, T. J. Emge, W. Ki, M. Hong and J. Li, Angew. Chem., Int. Ed., 2009, 48, 2334–2338 CrossRef CAS PubMed.
- G. L. Wang, J. J. Xu and H. Y. Chen, Nanoscale, 2010, 2, 1112–1114 RSC.
- C. Guo, P. Li, M. Pei and G. Zhang, Sens. Actuators, B, 2015, 221, 1223–1228 CrossRef CAS.
- H. C. Zhou, M. Li, X. R. Lin, W. Chen, G. H. Chen, X. C. Huang and D. Li, Angew. Chem., Int. Ed., 2015, 54, 10454–10459 CrossRef PubMed.
- J. W. Liu, L. F. Chen, H. Cui, J. Y. Zhang, L. Zhang and C. Y. Su, Chem. Soc. Rev., 2014, 43, 6011–6061 RSC.
- C. Y. Sun, X. L. Wang, X. Zhang, C. Qin, P. Li, Z. M. Su, D. X. Zhu, G. G. Shan, K. Z. Shao, H. Wu and J. Li, Nat. Commun., 2013, 4, 2717–2725 Search PubMed.
- D. De, T. K. Pal, S. Neogi, S. Senthilkumar, D. Das, S. S. Gupta and P. K. Bharadwaj, Chem.–Eur. J., 2016, 22, 3387–3396 CrossRef CAS PubMed.
- P. P Bag, D. Wang, Z. Chen and R. Cao, Chem. Commun., 2016, 52, 3669–3672 RSC.
- N. B. Nguyen, G. H. Dang, D. T. Le, T. Truong and N. T. S. Phan, ChemPlusChem, 2016, 81, 361–369 CrossRef CAS.
- L. Wang, G. L. Fan, X. F. Xu, D. M. Chen, L. Wang, W. Shi and P. Cheng, J. Mater. Chem. A, 2017, 5, 5541–5549 CAS.
- Y. Cheng, J. Wu, C. Guo, X. G. Li, B. Ding and Y. Li, J. Mater. Chem. B, 2017, 5, 2524–2535 RSC.
- J. W. Ye, L. M. Zhao, R. F. Bogale, Y. Gao, X. X. Wang, X. M. Qian, S. Guo, J. Z. Zhao and G. L. Ning, Chem.–Eur. J., 2015, 21, 2029–2037 CrossRef CAS PubMed.
- W. P. Lustig, S. Mukherjee, N. D. Rudd, A. V. Desai, J. Li and S. K. Ghosh, Chem. Soc. Rev., 2017, 46, 3242–3285 RSC.
- B. Wang, Q. Yang, C. Guo, Y. X. Sun, L. H. Xie and J. R. Li, ACS Appl. Mater. Interfaces, 2017, 9, 10286–10295 CAS.
- D. M. Chen, N. N. Zhang, C. S. Liu and M. Du, J. Mater. Chem. C, 2017, 5, 2311–2317 RSC.
- J. T. Guo, W. Z. Zeng, Q. F. Chen, L. P. Chen, Y. Yang, C. L. Cang, D. J. Ren and Y. X. Jiang, Nature, 2016, 531, 249–252 CrossRef PubMed.
- M. Chen, W. M. Xu, J. Y. Tian, H. Cui, J. X. Zhang, C. S. Liu and M. Du, J. Mater. Chem. C, 2017, 5, 2015–2021 RSC.
- H. J. Feng, L. Xua, B. Liuc and H. Jiao, Dalton Trans., 2016, 45, 17392–17400 RSC.
- J. Sahoo, S. B. Waghmode, P. S. Subramanian and M. Albrecht, ChemistrySelect, 2016, 1, 1943–1948 CrossRef CAS.
- J. Dong, H. Xu, S. L. Hou, Z. L. Wu and B. Zhao, Inorg. Chem., 2017, 56, 6244–6250 CrossRef CAS PubMed.
- X. X. Li, H. Y. Xu, F. Z. Kong and R. H. Wang, Angew. Chem., Int. Ed., 2013, 125, 14014–21401 CrossRef.
- C. Q. Zhang, Y. Yan, Q. H. Pan, L. B. Sun, H. M. He, Y. L. Liu, Z. Q. Liang and J. Y. Li, Dalton Trans., 2015, 44, 13340–13346 RSC.
- Y. Y. Jiang, L. B. Sun, J. F. Du, Y. C. Liu, H. Z. Shi, Z. Q. Liang and J. Y. Li, Cryst. Growth Des., 2017, 17, 2090–2096 CAS.
- C. H. Zhang, L. B. Sun, Y. Yan, Y. C. Liu, Z. Q. Liang, Y. L. Liu and J. Y. Li, J. Mater. Chem. C, 2017, 5, 2084–2089 RSC.
- D. Wang, L. B. Sun, C. Q. Hao, Y. Yan and Z. Q. Liang, RSC Adv., 2016, 6, 57828–57834 RSC.
- L. H. Cao, F. Shi, W. M. Zhang, S. Q. Zang and T. C. W. Mak, Chem.–Eur. J., 2015, 21, 15705–15712 CrossRef CAS PubMed.
- X. X. Jia, R. X. Yao, F. Q. Zhang and X. M. Zhang, Inorg. Chem., 2017, 56, 2690–2696 CrossRef CAS PubMed.
- Y. L. Wu, G. P. Yang, Y. Q. Zhao, W. P. Wu, B. Liu and Y. Y. Wang, Dalton Trans., 2015, 44, 3271–3277 RSC.
- Bruker AXS, SAINT Software Reference Manual, Madison, WI, 1998 Search PubMed.
- G. M. Sheldrick, Acta Crystallogr., Sect. A: Found. Crystallogr., 2008, 64, 112 CrossRef CAS PubMed.
- B. Gole, A. K. Bar and P. S. Mukherjee, Chem. Commun., 2011, 47, 12137–12139 RSC.
- T. T. Zheng, J. Zhao, Z. W. Fang, M. T. Li, C. Y. Sun, X. Li, X. L. Wang and Z. M. Su, Dalton Trans., 2017, 46, 2456–2461 RSC.
- Y. Xiao, Y. Cui, Q. Zheng, S. Xiang, G. Qian and B. Chen, Chem. Commun., 2010, 46, 5503–5505 RSC.
- Z. M. Zhou, W. Shi, H. M. Li, H. Li and P. Cheng, J. Phys. Chem. C, 2014, 118, 416–426 Search PubMed.
- Z. Zhang, L. Wojtas, M. Eddaoudi and M. J. Zaworotko, J. Am. Chem. Soc., 2013, 135, 5982–5985 CrossRef CAS PubMed.
- Z. Zhang, L. Zhang, L. Wojtas, P. Nugent, M. Eddaoudi and M. J. Zaworotko, J. Am. Chem. Soc., 2012, 134, 924–927 CrossRef CAS PubMed.
- K. S. Asha, K. Bhattacharyya and S. Mandal, J. Mater. Chem. C, 2014, 2, 10073–10081 RSC.
- S. Ramanchandran, Z. D. Popovic, K. S. Schuermann, F. Cucinotta, G. Calzaferri and L. D. Cola, Small, 2011, 7, 1488–1494 CrossRef PubMed.
- G. Y. Wang, L. L. Yang, Y. Li, H. Song, W. J. Ruan, Z. Chang and X. H. Bu, Dalton Trans., 2013, 42, 12865–12868 RSC.
- H. Sohn, M. J. Sailor, D. Magde and W. C. Trogler, J. Am. Chem. Soc., 2003, 125, 3821–3830 CrossRef CAS PubMed.
- D. Banerjee, Z. C. Hu and J. Li, Dalton Trans., 2014, 43, 10668–10685 RSC.
- Z. C. Hu, B. J. Deibert and J. Li, Chem. Soc. Rev., 2014, 43, 5815–5840 RSC.
- L. L. Zhang, Z. X. Kang, X. L. Xin and D. F. Sun, CrystEngComm, 2016, 18, 193–206 RSC.
Footnote |
| † Electronic supplementary information (ESI) available. CCDC 1556041 (for 1). For ESI and crystallographic data in CIF or other electronic format see DOI: 10.1039/c7ra08977e |
| This journal is © The Royal Society of Chemistry 2017 |

