
 Open Access Article
 This Open Access Article is licensed under a
 Creative Commons Attribution 3.0 Unported Licence
Bimetallic zeolitic imidazolate frameworks-derived porous carbon-based materials with efficient synergistic microwave absorption properties: the role of calcining temperature†
Suyun Wanga,
Xiang Kea,
Suting Zhonga,
Yaru Laia,
Danlin Qiana,
Yanping Wanga,
Qinghua Wangb and
Wei Jiang *a
*a
aNational Special Superfine Powder Engineering Technology Research Center, Nanjing University of Science and Technology, 210094, Nanjing, China. E-mail: superfine_jw@126.com
bMilitary Representative Office 763, 030008, Taiyuan, China
First published on 2nd October 2017
Abstract
The composites of metal Co embedded in porous and N-doped graphitized carbon matrix (Co@pNGC) have been successfully synthesized by thermal decomposition of the bimetallic zeolitic imidazolate frameworks (bi-ZIFs) at different temperatures. The experimental results show that the calcination temperature played a decisive role on the graphitization, specific surface area, pore structure and electromagnetic wave (EM) absorption properties of Co@pNGC. The composites, Co@pNGC-600 and Co@pNGC-700 obtained at 600 °C and 700 °C, respectively, exhibit an outstanding EM wave absorption performance, which attributes to the synergistic effects of dielectric and magnetic loss, porous structure and multicomponent interfaces. Specifically, the optimal reflection loss of Co@pNGC-600 is −50.7 dB at 11.3 GHz and the widest effective absorption bandwidth (<−10 dB) could reach upto 5.5 GHz (12.3–17.8 GHz). The minimum thickness corresponding to the effective absorption is only 1.2 mm for Co@pNGC-700. Hence, these obtained porous carbon composites are promising microwave absorbing materials due to their lightweight, thin thickness, low filling, broad bandwidth, and strong absorption.
1. Introduction
With the wide application of radio technology and electronic devices, electromagnetic wave radiation has triggered a new pollution in modern society. In everyday life, radiation will not only interfere with the normal operation of the electronic equipment but also produce a great threat to the ecological environment and human health.1,2 Furthermore, in the military environment, the radar detection technology causes a serious threat to the abilities of survivability and penetration of military targets. The application of EM absorption materials is a wise and effective method to avoid the acquisition of radar and achieve a stealth mode.3,4 Consequently, it is urgent to handle these problems by fabricating a novel and effective electromagnetic wave absorbent.5It is well-known that excellent absorbing materials must meet two conditions, which are impedance matching and attenuation characteristics.6 Dielectric loss and magnetic loss are two dominating loss mechanisms for the attenuation of the incident electromagnetic wave. Carbon-based materials such as carbon-fibers,7,8 carbon nanotubes9,10 and graphene11,12 have an excellent electrical conductivity but poor impedance match due to their single dielectric loss. Generally, preparation of carbon-based composites by incorporating magnetic constituents is widely recognized as an effective approach to reduce the magnetic loss and microwave absorption performance. For example, Xu et al.13 successfully prepared Fe3O4@C composites through in situ polymerization of phenolic resin on the Fe3O4 surface and then subjecting it to high temperature calcination. They studied the effects of different thicknesses of this core–shell complex on the absorbing property by adjusting the proportion of different components and obtained a strong absorbing performance at high frequencies. Chakrabarti et al.14 fabricated GaFeO3 nanoparticles encapsulated in multi-walled carbon nanotubes by a sol–gel method and found that the reflection loss was up to −25 dB with 10% of MW-CNTs in wax. However, these composites require two components to be compounded together by two steps, making the experimental process cumbersome and difficult to control.
In addition, an extensive attention has been paid to the porous materials in various fields such as catalysts,15 and oil absorption material.16 In particular, for the EM absorbing materials, the porous structure is not only conducive to the dissipation of the electromagnetic wave but also suitable for the abovementioned applications because of its light weight. Liu et al.17 synthesized porous nickel/carbon microspheres by combining solvothermal method with carbon reduction, and the reflection loss of the composite could reach up to −28.4 dB when the coating thickness was 1.8 mm and the filler loading was 75%. Porous flower-like NiO composites have been prepared by Kong et al.18 The minimum reflection loss (RL) value could reach −65.1 dB at 13.9 GHz, while an efficient bandwidth of 3 GHz was obtained. Although these materials possess a good microwave performance, the fact that the filler loading is too high or the absorption frequency bandwidth is narrow limits their practical application to some extent.
Compared with other metal–organic framework materials, zeolite imidazolate frameworks (ZIFs) have been regarded as an ideal template to acquire carbon material with a high porosity and specific surface area, well-defined morphology, and an excellent chemical stability.19,20 For the EM absorbing materials, their most interesting characteristic is that the organic material can be converted into the target porous carbon state and the metal ions are reduced in situ to metal, which effectively avoids the combination of the dielectric materials and the magnetic materials as in other chemical processes. According to the literatures,21,22 porous carbon derived from ZIF-8 ([Zn(MeIM)2]) (MeIM = 2-methylimidazole) owns a relatively high N content and surface area, but carbon is in an amorphous state. Conversely, porous carbon originated from ZIF-67 ([Co(MeIM)2]) crystals has highly graphitic carbon, which is caused by the catalytic effect of Co species in the carbon matrix. However, the surface area and N content are relatively low. Moreover, the co-existence of Zn2+ and Co2+ exhibits other advantages during the calcination process: (1) the appropriate proportion of Zn and Co species could promote the formation of carbon nanotubes on the surface; (2) the agglomeration of Co nanoparticles could be effectively inhibited owing to the existence of Zn species; (3) Zn evaporation could leave a large number of pores and increase the specific surface area.23 It is well established that N-doped graphitized carbon and the porous structure can vastly enhance the dielectric loss and facilitate the EM absorption performance.24,25
Herein, to integrate the advantages of two types of the carbon matrix, derived from ZIF-8 and ZIF-67, we fabricated bi-ZIFs and then calcined it at different high temperatures to gain the complexes of metal Co embedded in porous and N-doped graphitized carbon matrix (Co@pNGC). The preparation of these porous composites is easy and suitable for mass production. The structure and properties of the composites obtained at different thermal decomposition temperatures were explored by many characterization techniques and the mechanism of electromagnetic wave absorption was also elaborated systematically. There is no denying that such hybrids have a promising application in EM absorbing materials.
2. Materials and methods
2.1 Experimental chemicals
Cobalt nitrate hexahydrate (Co(NO3)2·6H2O, 99%), zinc nitrate hexahydrate (Zn(NO3)2·6H2O, 99%), 2-methylimidazole (MeIM, 99%), and methanol (99.9%) were purchased from Sinopharm Chemical Reagent Co. Ltd. All reagents were used without further purification.2.2 Synthesis of the bi-ZIFs precursors and Co@pNGC composites
Typically, 2.36 g Zn(NO3)2·6H2O and 4.72 g Co(NO3)2·6H2O were dissolved in 240 mL of methanol by sonication for 10 min. Then, 100 mL methanol solution containing 2-methylimidazole (7.88 g) was added to the above mixture under vigorous stirring for 5 min. Subsequently, the violet solution was obtained and placed in an electric oven at 30 °C for 20 h. Finally, the bi-ZIFs precursors were separated by centrifugation, washed thoroughly with methanol for four times, and dried overnight at 80 °C. The as-prepared bi-ZIFs precursors were placed in a combustion boat and heated at the rate of 1 °C min−1 and maintained at 600–800 °C for 3 h under a pure N2 atmosphere. The products were denoted as Co@pNGC-600, Co@pNGC-700, and Co@pNGC-800 based on the calcination temperatures.2.3 Characterizations of samples
Powder X-ray diffraction (XRD) patterns of the samples were recorded on a Germany Bruker D8-Advanced diffractometer equipped with Cu Kα radiation (λ = 1.5418 Å). The morphologies and sizes of the samples were observed by transmission electron microscopy (TEM, Philips Tecnai 12) and field emission scanning electron microscopy (FE-SEM, Hitachi S-4800). Quantitative analysis of the elements and the elemental mappings in the samples were recorded using an energy-dispersive X-ray spectrometer (EDX) attached to the SEM. Furthermore, the specific surface area and pore size were calculated by the Brunauer–Emmett–Teller (BET) model and Barrett–Joyner–Halenda (BJH) method, respectively. Raman microscopy (Horiba Aramis) was used to characterize the degree of graphitization. The ID/IG ratio of each sample was estimated by measuring the average D/G ratio intensity from three different locations on each sample. Magnetic measurements were conducted with a vibrating sample magnetometer (VSM, Lakeshore-735). Electromagnetic parameters including the complex permittivity (εr = ε′ − jε′′) and the permeability (μr = μ′ − jμ′′) of the composites were measured by an Agilent N5244A vector network analyzer in the frequency range of 2–18 GHz to evaluate the electromagnetic absorption. The toroidal-shaped samples with an inner diameter of 3.04 mm and an outer diameter of 7 mm for electromagnetic wave absorption measurement were prepared by mixing paraffin wax with 20 wt% products.3. Results and discussion
Fig. 1a and b display the XRD and EDX patterns of the bi-ZIFs precursors. As shown in the XRD pattern in Fig. 1a, the positions of diffraction peaks of the as-synthesized bi-ZIFs precursors are similar to those in the patterns simulated for a single crystal of ZIF-8 and ZIF-67. Because ZIF-8 and ZIF-67 are isostructural, we speculated that the bi-ZIFs crystals were successfully synthesized.19 To verify the constituents, EDX spectra (Fig. 1b) were collected during SEM imaging. It confirms the co-existence of zinc and cobalt species in the precursors and the atom content ratio of Zn and Co is nearly 1![[thin space (1/6-em)]](https://www.rsc.org/images/entities/char_2009.gif) :2. Moreover, the obtained bi-ZIFs precursors have rhombic dodecahedral shapes with a diameter of about 500 nm as observed in SEM and TEM images in Fig. 1c and d.
:2. Moreover, the obtained bi-ZIFs precursors have rhombic dodecahedral shapes with a diameter of about 500 nm as observed in SEM and TEM images in Fig. 1c and d.
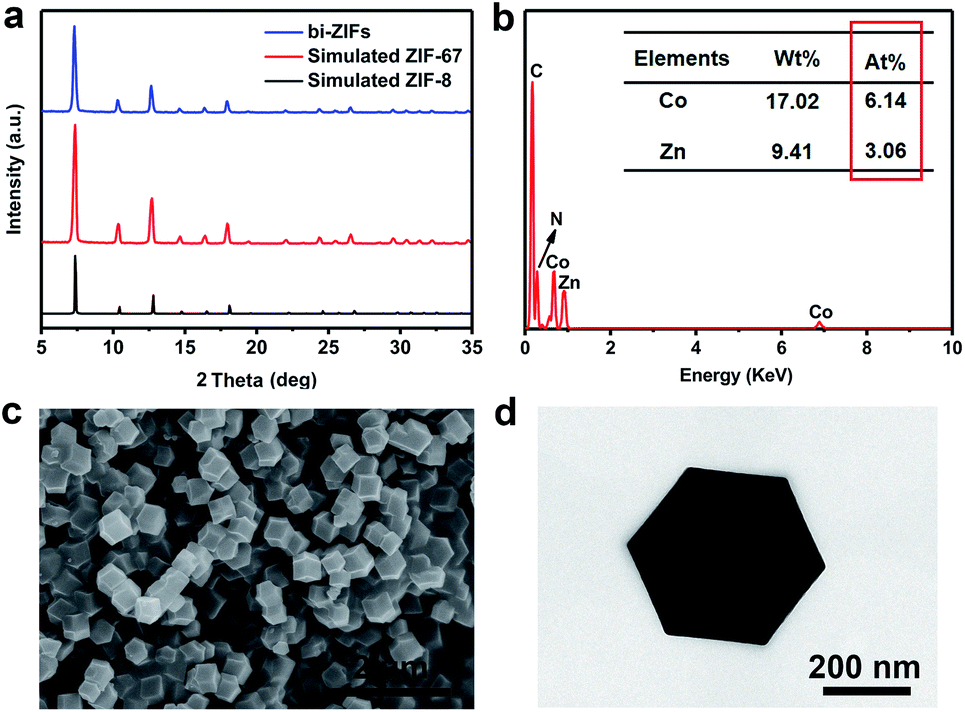 | ||
| Fig. 1 (a) XRD patterns of the simulated ZIF-8, ZIF-67, and the as-synthesized bi-ZIFs precursors, (b) EDX results, (c) SEM image of the bi-ZIFs precursors, and (d) TEM image of an individual bi-ZIFs nanocrystal. | ||
During the thermolysis process, the metal–organic skeleton can be converted into carbon; moreover, the co-existed Zn2+ and Co2+ are thermally reduced correspondingly to Zn and Co nanoparticles. A typical powder X-ray diffraction was employed to inquire the phase of the samples obtained at different calcination temperatures. The characteristic peaks at about 44.2°, 51.5° and 75.9° observed from Fig. 2a belongs to the (111), (200), and (220) planes, respectively, which can be typically assigned to the cubic phase Co (JCPDS no. 15-0806). According to the Scherrer formula,26 the average sizes of the metal Co nanoparticles are estimated to be 12, 15, and 22 nm for Co@pNGC-600, Co@pNGC-700, and Co@pNGC-800, respectively. In addition, a weak and broad peak at about 25° is observed (Fig. 2b), which could be attributed to the diffraction of amorphous carbon. In particular, this characteristic peak is increasingly protruding and shifts towards 26° with the rising of the carbonated temperatures, suggesting the formation of graphitic carbon in these composites. This phenomenon could be explained by two reasons: (1) a moderate amount of metal Co acts as a catalyst, promoting amorphous carbon to graphitized carbon21,23 and (2) elevated temperature is conducive to the graphitization formation process. It must be pointed out that it is hard to find any characteristic peak associated with Zn species in the XRD diagrams. On one hand, the content of Zn in the precursor is much lower than that of Co and C species. On the other hand, a large amount of Zn species evaporated during the thermal decomposition process. In particular, Zn species evaporate at 600 °C because the boiling point of nano-size Zn species in the carbon matrix should be much lower than that of metallic Zn (908 °C) according to the Tammann temperature rule.27,28 Complete details of these explanations will be provided in the following paragraphs.
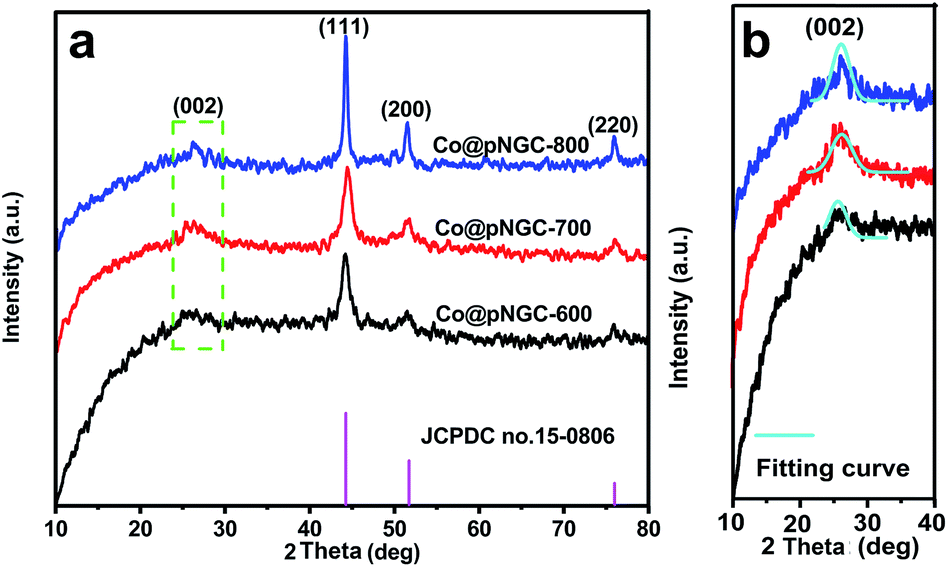 | ||
| Fig. 2 (a) XRD patterns and (b) local fitting curves of Co@pNGC-600, Co@pNGC-700, and Co@pNGC-800. | ||
The morphologies obtained from SEM and TEM of the samples after high-temperature calcination are shown in Fig. 3. The composites maintain the uniform rhombic dodecahedral shape with the diameter of about 400 nm when the calcination temperature is lower than 700 °C. However, the metal–organic skeleton structure of the composites collapse drastically when the temperature reaches 800 °C. Interestingly, we can clearly observe that numerous carbon nanotubes grow on the rough surface of the composites and even cross-link to become a network after heating treatment. From Fig. 3d, we could estimate that the diameter of the carbon nanotubes is about 14 nm. With the rise in temperature, a larger number of carbon nanotubes with a high aspect ratio are formed. The elevated temperature facilitates the generation of carbon nanotubes under the action of the moderate content of cobalt catalyst, which is also supported by the results of XRD. Moreover, many black dots with the size of ∼15 nm that are well scattered in the carbon matrices can be clearly noticed. In order to deeply investigate the elemental information, EDX elemental mappings were recorded and the results are shown in Fig. 3c. In addition to the presence of C, Co and N, the presence of Zn element is also detected in the composite due to its incomplete evaporation at 600 °C. All of three samples contain a certain amount of N and Zn elements and their contents in the carbon matrix gradually decrease with the increasing of thermal decomposition temperature (Fig. S1 in the ESI†).
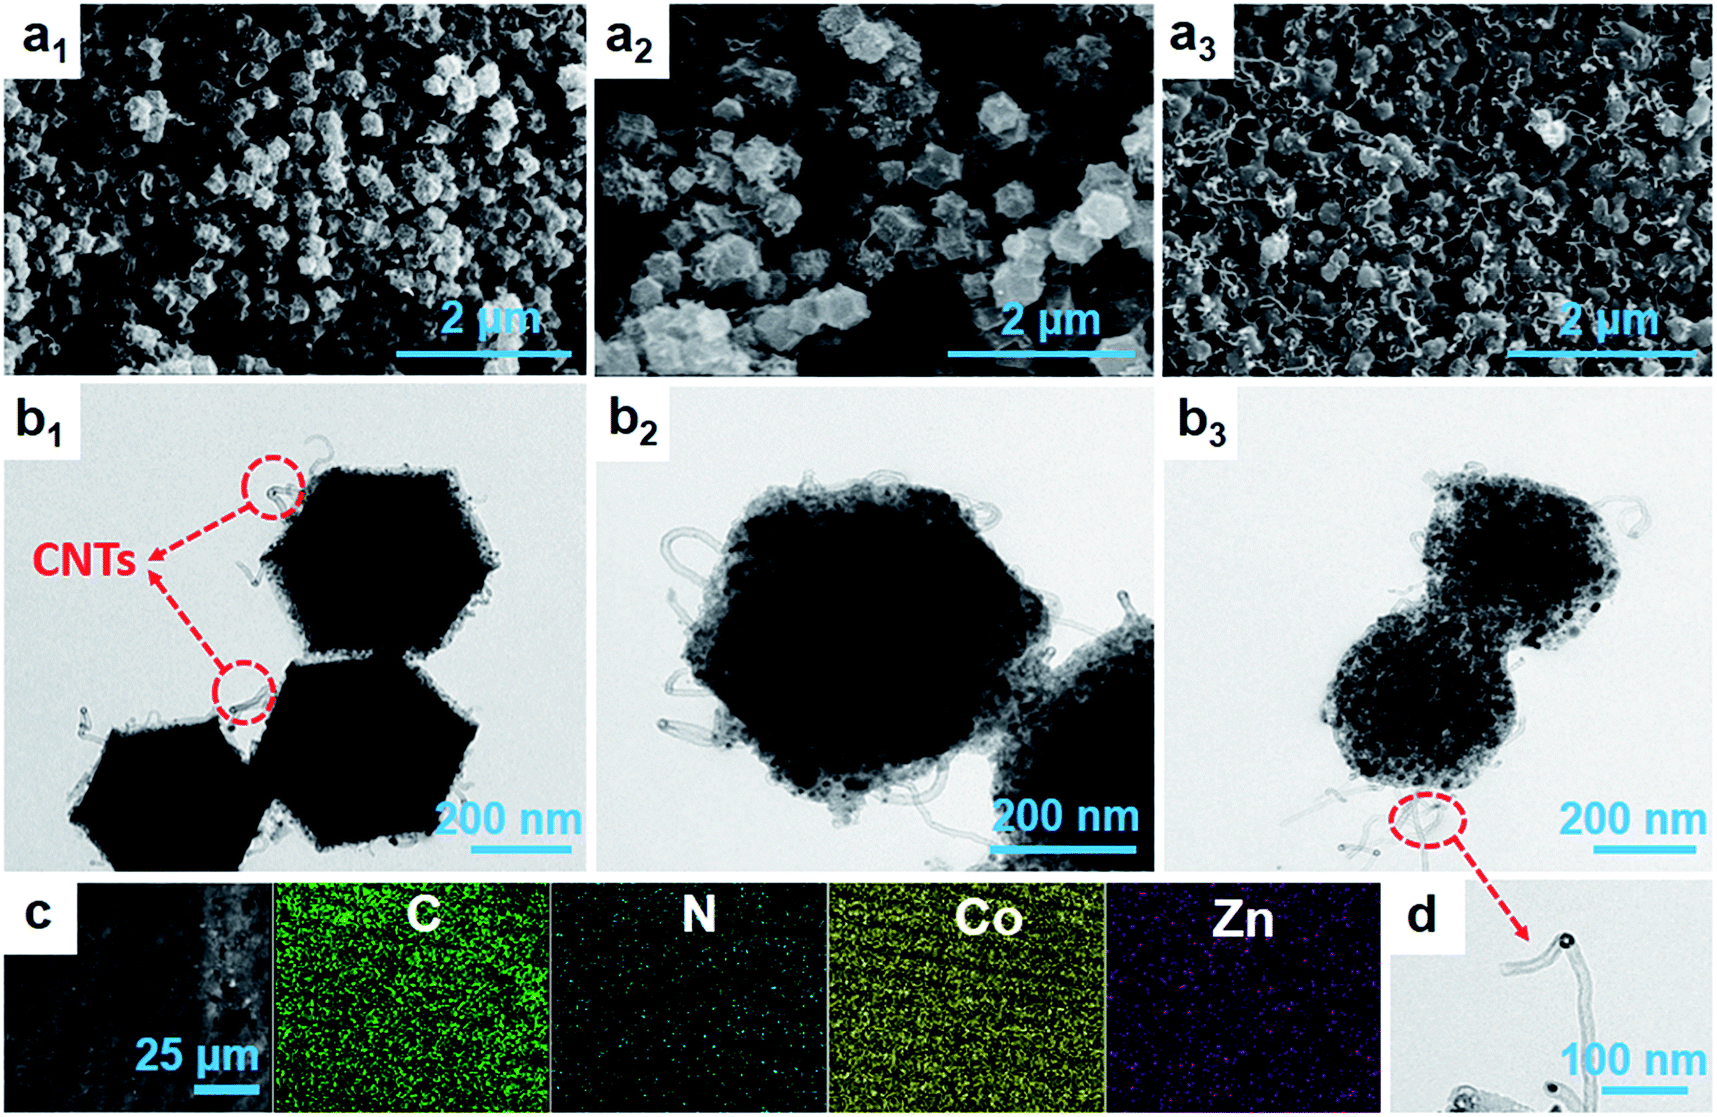 | ||
| Fig. 3 (a1–a3) SEM, (b1–b3) TEM images of Co@pNGC-600, Co@pNGC-700, Co@pNGC-800, respectively. (c) EDX elemental mappings of Co@pNGC-600 and (d) High-magnification TEM of Carbon nanotubes. | ||
To gain more insights into the effects of temperature on the specific surface area and the porous structure of the composites, Brunauer–Emmett–Teller (BET) experiment was conducted and the results are summarized in Table 1. The nitrogen adsorption and desorption isotherms could be assigned to type IV curve with a hysteresis loop at the relative pressure in the range of 0.4–0.95, implying the existence of abundant mesopores in three Co@pNGC composites (Fig. S2 in the ESI†).29 Apparently, Co@pNGC-700 has a higher BET surface area of 326.5 m2 g−1 and a larger pore volume of 0.24 cm3 g−1 than those of Co@pNGC-600 (243.8 m2 g−1, 0.18 cm3 g−1) and Co@pNGC-800 (232.0 m2 g−1, 0.07 cm3 g−1). These changes are mainly affected by two aspects. One is the increase in evaporation of Zn with the increase in temperature, generating abundant mesopores in the carbon materials.28 Another is the particle agglomeration and the collapse of the skeleton at the elevated temperatures.
| Samples | SBET (m2 g−1) | SLangmuir (m2 g−1) | Vpore (cm3 g−1) | Average pore diameter (nm) |
|---|---|---|---|---|
| Co@pNGC-600 | 243.8 | 478.9 | 0.18 | 4.1 |
| Co@pNGC-700 | 326.5 | 623.6 | 0.24 | 4.3 |
| Co@pNGC-800 | 232.0 | 447.7 | 0.07 | 7.3 |
In general, the enhanced graphitization degree of the carbon phase in the composite can improve the electronic conductivity and the corrosion resistance, which have a great significance for the EM wave absorbing materials. Raman spectroscopy was also employed to further demonstrate that the carbon matrix produced by the thermolysis of the organo-metallic skeleton partially converts to graphitized carbon. As shown in Fig. 4, all of the samples exhibit two clear broad peaks. The D band located at 1360 cm−1 (corresponding to the A1g mode) usually relates to the disorder in sp2-hybridized C atoms or amorphous C, whereas the G band at 1580 cm−1 (corresponding to the E2g mode) relates to sp2 in the same plane.30,31 Thus, the relative intensity ratio between the D and G bands (ID/IG) could be used to assess the degree of carbonization of the samples and a lower ratio represents a higher graphitic degree.32 The values of ID/IG for Co@pNGC-600, Co@pNGC-700 and Co@pNGC-800 were calculated to be 0.98, 0.88 and 0.65, respectively, indicating that the elevated calcination temperature causes the enhancement of graphitized carbon in the composites. As a result, we successfully embedded magnetic nanoparticles into the carbon matrix using sacrificing template method.
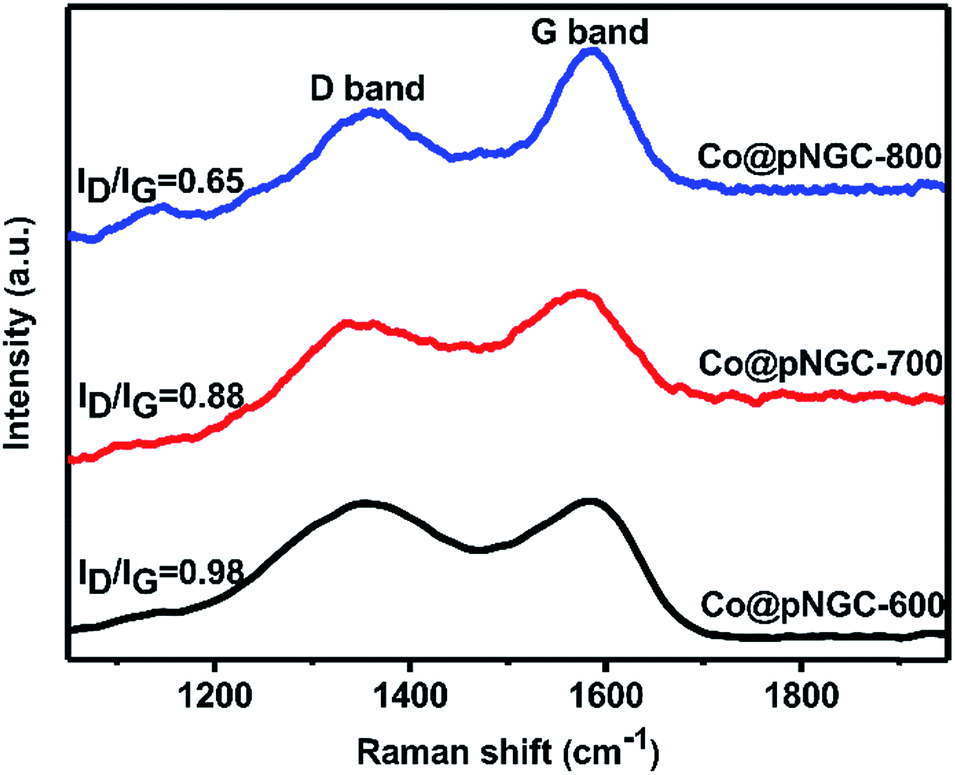 | ||
| Fig. 4 Raman spectra of Co@pNGC-600, Co@pNGC-700, and Co@pNGC-800. | ||
Fig. 5 shows magnetic hysteresis loops of Co@pNGC-600, Co@pNGC-700, and Co@pNGC-800 to evaluate the static magnetic properties. The values of saturation magnetization (Ms), coercivity (Hc) and remnant magnetization (Mr) are summarized in Table S1 (in the ESI†). The Ms values of these samples are only 20, 33.5, and 35 emu g−1, respectively. All of the samples show a ferromagnetic behavior and the Ms values are relatively low because many carbon species in the complexes and the metal Co nanoparticles are embedded in the carbon matrix with very small nanoparticles. It is apparently seen that the values of Ms, Hc, and Mr of three samples are affected by the calcination temperature. We have noticed that the saturation magnetization increases slightly with elevating calcination temperature, which is principally caused by the enhancement of the sample crystallinity and a larger size of Co nanoparticles (Fig. 2). However, the coercivity and remnant magnetization of the Co@pNGC composites first increase and then decrease with the increase in treatment temperature.33–35
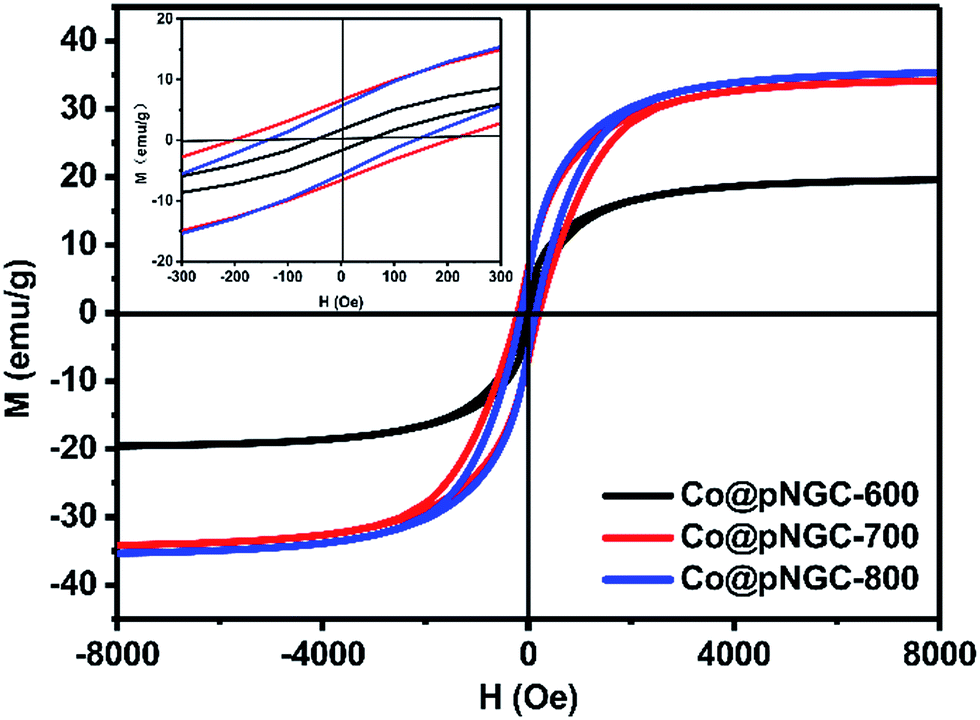 | ||
| Fig. 5 Magnetic properties of Co@pNGC-600, Co@pNGC-700, and Co@pNGC-800. The inset shows the corresponding magnified hysteresis loops at low applied magnetic. | ||
The parameters (complex permittivity εr = ε′ − jε′′ and complex permeability μr = μ′ − jμ′′) were investigated by mixing 20% of the samples with paraffin. In general, the real parts (i.e. ε′ and μ′) represent the ability of the materials to store electromagnetic wave energy, while the imaginary parts (i.e. ε′′ and μ′′) symbolize the ability to consume electromagnetic wave energy.36,37 From Fig. 6a, it could be found that the values of ε′ and ε′′ increase gradually as the calcination temperature increases from 600 to 800 °C. In particular, when the temperature reaches 800 °C, the values of ε′ and ε′′ at 2 GHz are 29.35 and 24.2, respectively, which are much higher than those of the samples prepared at 600 °C and 700 °C. According to the free electron theory, ε′′ = 1/(2πρfε0), where ρ is the electric resistivity, f is the frequency of the microwave, and ε0 is the permittivity of vacuum, it can be deduced that the high complex permittivity is closely connected to the high electrical conductivity.38 Moreover, besides the good conductive network formed by the larger number of carbon nanotubes (Fig. 3), better crystallinity of Co nanoparticles produced (Fig. 2) in the carbon matrix is also beneficial to improve the complex permittivity of the samples. From the above analysis, we can infer that Co@pNGC-800 has stronger capabilities for storing and losing the electromagnetic energy compared with those of Co@pNGC-600 and Co@pNGC-700. However, too high complex permittivity might cause the reflection of the incident electromagnetic wave on the material surface rather than the absorption.33 Therefore, an optimal permittivity is beneficial to promote the absorption of the electromagnetic wave.
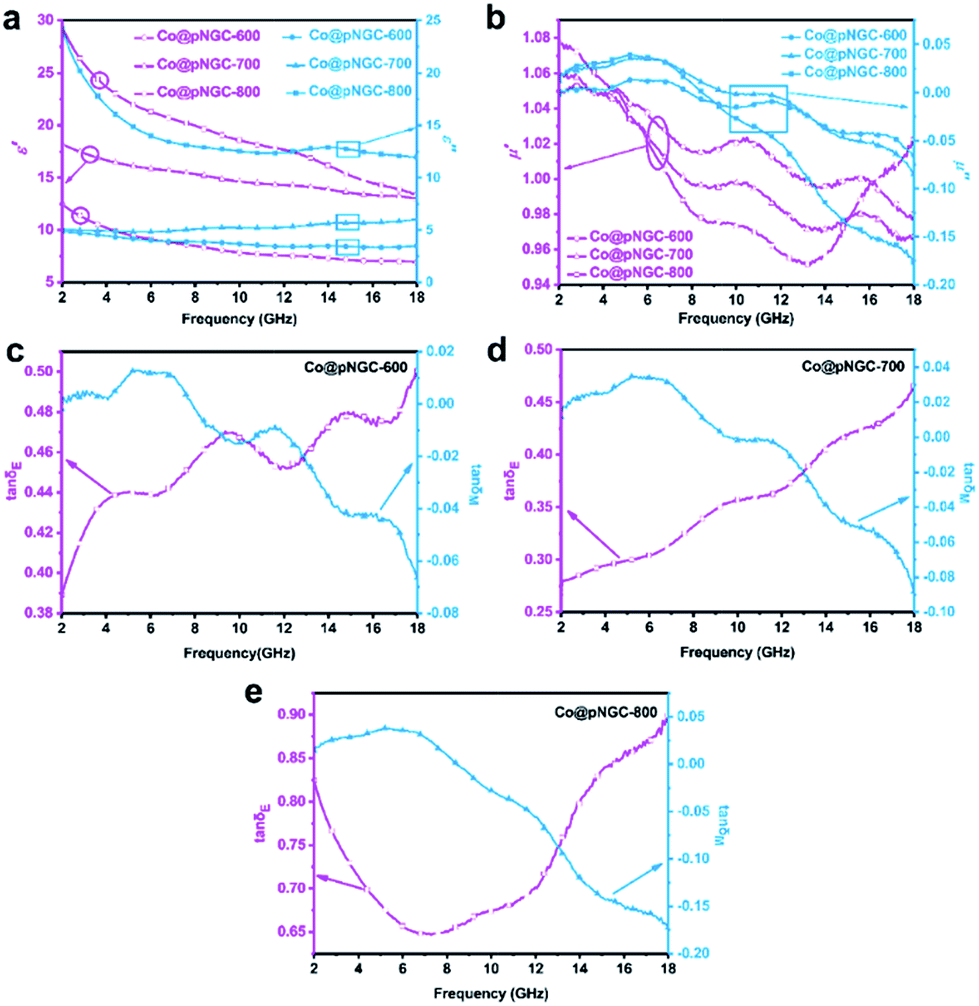 | ||
| Fig. 6 Frequency dependence of electromagnetic parameters of Co@pNGC-600, Co@pNGC-700, and Co@pNGC-800. (a) The real part (ε′) and the imaginary part (ε′′) of the complex permittivity, (b) the real part (μ′) and the imaginary part (μ′′) of the complex permeability, and (c–e) dielectric loss (tanδE) and magnetic loss (tanδM). | ||
As shown in Fig. 6b, all the three samples exhibit low μ′ and μ′′ values owing to their relatively low magnetic properties. Interestingly, the μ′ and μ′′ values of Co@pNGC-800 are slightly higher at low frequency and then sharply decrease with the increase of frequency and far below that of Co@pNGC-600 and Co@pNGC-700. As concluded in the preceding analysis of SEM, TEM, and BET, the organic skeleton drastically collapses and the porosity decreases when the calcination temperature reaches 800 °C, which could be used to explain the abovementioned phenomenon. In addition to adjusting the permittivity of the composites, the porous skeleton structure can also effectively suppress the eddy current loss of the metal Co and maintain a stable magnetic permeability at high frequency.39
The dielectric loss tangent (tanδE = ε′′/ε′) and the magnetic loss tangent (tanδM = μ′′/μ′) are usually applied to describe the dielectric and magnetic loss of the EM wave absorbing materials. A larger value indicates a better electromagnetic wave loss capability.40 As shown in Fig. 6c and d, there are multiple peaks at ∼6 GHz, 11.5 GHz and 15 GHz in three samples, suggesting the existence of multiple resonance behaviors. In general, for dielectric loss, the resonance behaviors indicate that the composites possess a high conductivity, skin effect, electron polarization and space charge polarization in the electromagnetic field radiation.41 Similarly, resonance behaviors are derived from natural resonance at low frequency and exchange resonance at high frequency for magnetic loss.42 In this study, the enhanced dielectric loss is chiefly attributed to the conductive CNTs networks that are generated in the composites as the temperature increases. Apparently, the values of dielectric loss are much higher than the magnetic loss for the three samples, so the dominant absorption mechanism of these composites is originated from dielectric loss.
It must also be mentioned that the values of μ′′ are negative at 8–18 GHz and similar phenomena were found in a few earlier studies for various composites.43–45 In general, μ′′ with a positive value represents the incident electromagnetic energy absorbed by the wave absorber, while the negative value is considered to be the magnetic energy radiating out of the composite. From Fig. 6c and d, it is clear that the maximum value of tanδE and the minimum value of tanδM appear at the same frequency range. The magnetic behavior affected by the strong dielectric behavior could be accounted for this coupling phenomenon between the dielectric loss and permeability loss. As a result, a part of the magnetic field could be converted into an electric field energy and released, leading to a large increase in ε′′ and the negative μ′′.44,46
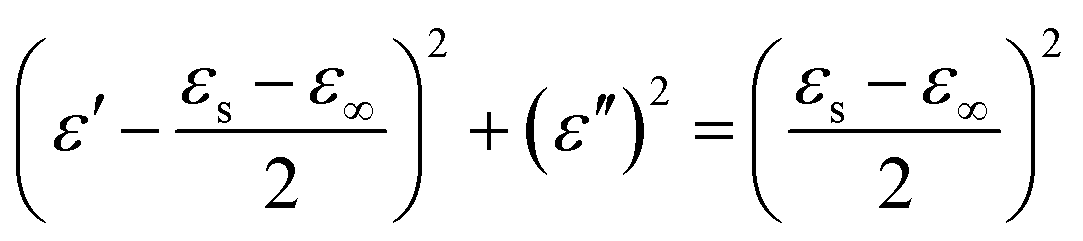
To further explore the mechanism of the electromagnetic wave attenuation in the materials, we analyzed the electromagnetic parameters systematically. In general, the dielectric phenomenon of an electromagnetic wave absorbing materials can be explained by a polarization relaxation process. According to the Debye polarization theory, ε′ and ε′′ can be expressed as follows:17
 | (1) |
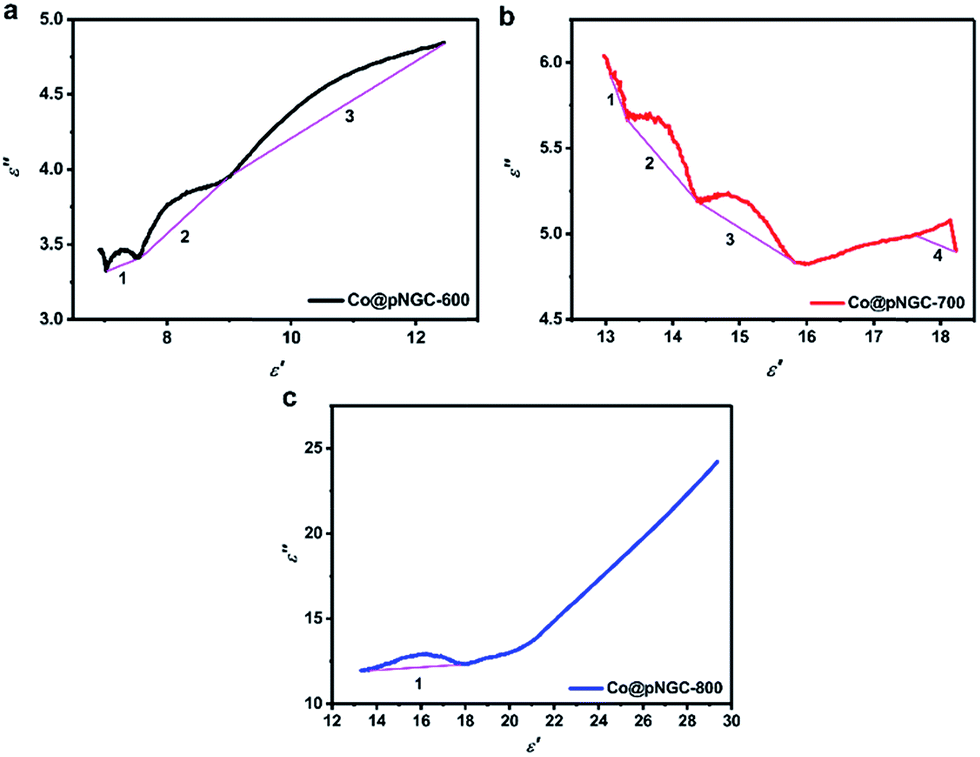 | ||
| Fig. 7 Typical Cole–Cole semicircles (a–c) for the samples of Co@pNGC-600, Co@pNGC-700, and Co@pNGC-800, respectively, in the frequency range of 2–18 GHz. | ||
On the basis of electromagnetic parameters, we simulated the reflection loss of the samples to assess the electromagnetic wave absorption performance of the composites by using the following absorption theoretical formula:49
 | (2) |
In the above equation, Zin is the normalized input impedance of the absorber and Z0 is the impedance of free space. The goal of 90% electromagnetic wave absorption can be achieved when the reflection loss RL is less than −10 dB.50 Fig. 8 displays the RL curves and the corresponding two-dimensional contours of Co@pNGC-600, Co@pNGC-700, and Co@pNGC-800 at a given frequency (f) and an absorber thickness (d). For Co@pNGC-600, the minimum reflection loss (RLmin) is −50.7 dB at 11.3 GHz with a thickness of 2.5 mm. Essentially, the widest effective absorption bandwidth (<−10 dB) (fwe) can reach 5.5 GHz (12.3–17.8 GHz), corresponding to a thickness of 2.0 mm. As shown in Fig. 8b1, the yellow area in the two-dimensional contour map is considered as the effective absorption area. The composite of Co@pNGC-600 can achieve an effective absorption at 3.0–17.8 GHz by adjusting the coating thickness in the range of 2.0–5.5 mm. In contrast to Co@pNGC-600, the stronger absorption peak of Co@pNGC-700 shifts to a lower frequency and the minimum reflection loss is −40.3 dB at 3.7 GHz. In particular, the effective absorption band is 4 GHz (12.2–16.2 GHz) for Co@pNGC-700 with a thickness of only 1.5 mm. To investigate the minimum thickness corresponding to the effective absorption, we calculated the reflection loss of Co@pNGC-600 and Co@pNGC-700 with a thickness of 1.0–1.9 mm in the frequency range of 2–18 GHz. Notably, a broadband and an efficient absorption at high frequency could be reached when the thickness is only 1.4 mm and 1.2 mm for Co@pNGC-600 and Co@pNGC-700, respectively (Fig. S3 in the ESI†). Among the three samples obtained by calcining at different temperatures, only Co@pNGC-800 shows an extremely poor absorption performance with the reflection loss higher than −10 dB in the frequency of 2–18 GHz. Another interesting finding is that the optimal performance values shift towards the lower frequency with the increase of thickness. The “geometric effect” can be used to explain this phenomenon.44
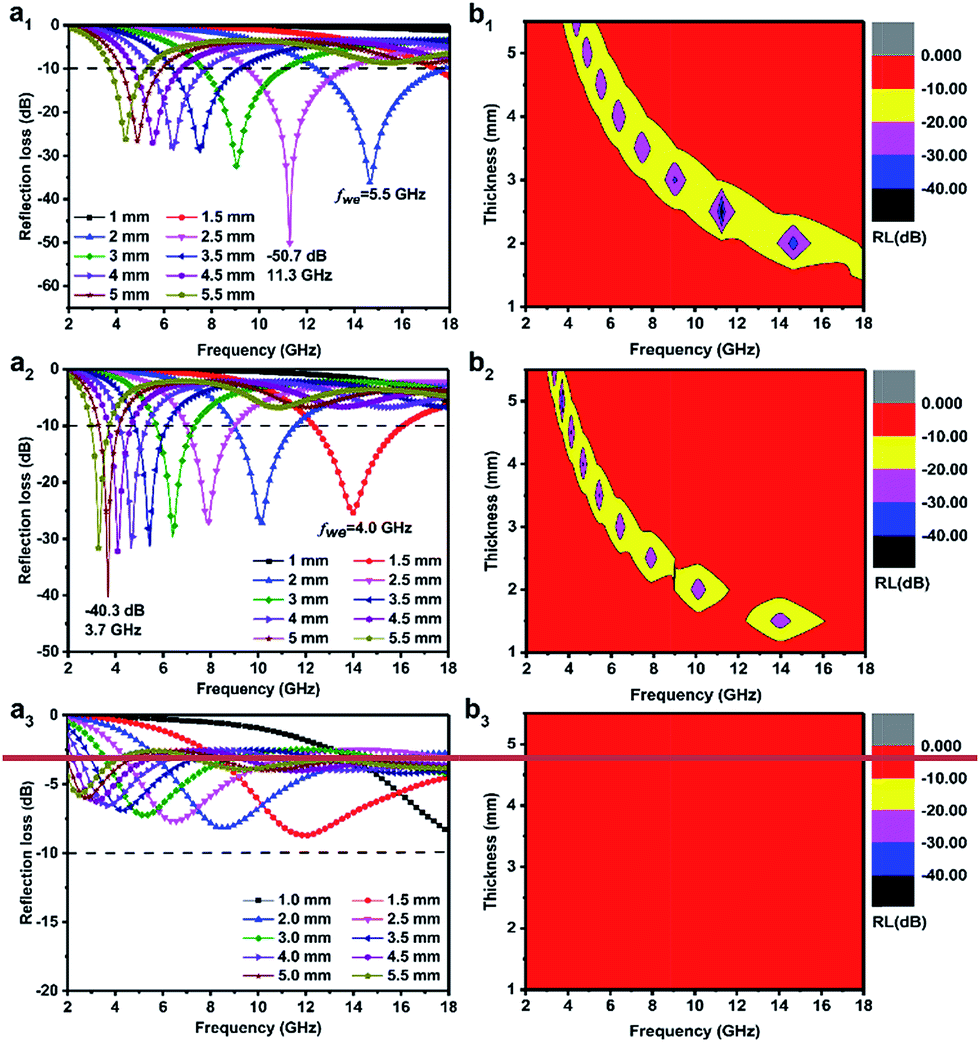 | ||
| Fig. 8 Reflection loss curves (a1–a3) and contour maps (b1–b3) of the 20% product of Co@pNGC-600, Co@pNGC-700, Co@pNGC-800 with paraffin composites at different thickness in the frequency range of 2–18 GHz, respectively. | ||
In recent years, abundant studies on the composites of carbon materials and magnetic metal or metal oxide materials have been studied in EM wave absorption field, which are summarized in Table 2.13,33,43,45 Compared with these reported materials, the composites prepared in our experiment exhibit multitudinous excellent properties of low filling capacity, thin coating thickness, strong absorption, broad effective absorption band, and low density, which have great significance for the application of EM wave absorbing materials.
| Samples | Filler loading (wt%) | RLmin (dB) | f(RLmin) (GHz) | d(RLmin) (mm) | fwe (GHz) | d(fwe) (mm) | Ref. (year) |
|---|---|---|---|---|---|---|---|
| Fe3O4@C | 50 | −40 | ∼15.7 | 1.5 | ∼4.0 | 1.5 | 13 (2014) |
| Co/C | 60 | −35 | 5.80 | 4.0 | 5.8 (8.4–14.2) | 2.5 | 33 (2015) |
| Ni/C | 60 | −44.5 | 2.6 | 9.5 | ∼3.5 (8.5–12.0) | 3 | 45 (2016) |
| SiO2/C/Co | 30 | −24 | 5.0 | 4.0 | 1.5 (4.3–5.8) | 4 | 43 (2017) |
| Co@pNGC-600 | 20 | −50.7 | 11.3 | 2.5 | 5.5 (12.3–17.8) | 1.4 | This study |
| Co@pNGC-700 | 20 | −40.3 | 3.7 | 5.0 | 4.0 (12.2–16.2) | 1.2 |
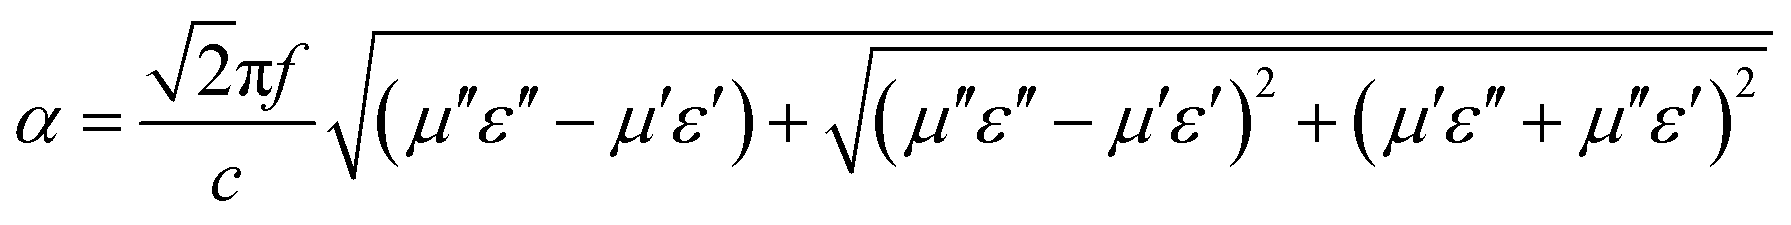
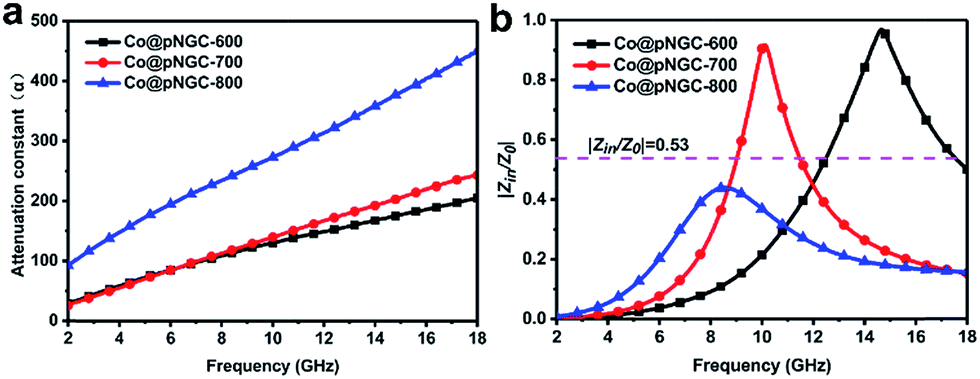
It is well established that the attenuation and impedance matching characteristics are indispensable for an excellent EM wave absorption in materials. The attenuation conditioning means that the electromagnetic wave entering the interior of the materials could be quickly and almost completely attenuated. In general, we adopt the attenuation constant (α) to evaluate the dissipation ability of the materials for electromagnetic wave and a higher value represents a stronger attenuation, as displayed in Fig. 9a. The attenuation constant (α) can be expressed by the following equation.38
 | (3) |
 | ||
| Fig. 9 The frequency dependence of the attenuation constant (α) of Co@pNGC-600, Co@pNGC-700, and Co@pNGC-800 (a) and their impedance matching at a thickness of 2.0 mm (b). | ||
Clearly, the attenuation constant (α) reveals an increasing trend with the increasing frequency. Among them, the values of Co@pNGC-800 are much higher than those of Co@pNGC-600 and Co@pNGC-700. Despite the highest attenuation obtained, the worst absorption property for Co@pNGC-800 has been displayed, which ascribes to the poor impedance matching. In order to deeply investigate the impact of the impedance matching on the EM wave absorption performance, we calculated the modulus of the normalized input impedance (|Zin/Z0|) of the three composites by using the eqn (2). The impedance matching versus frequency of three samples at a thickness of 2.0 mm is given in Fig. 9b. The values of |Zin/Z0| for Co@pNGC-800 are clearly far below the other samples (<0.45). According to the impedance matching characteristic, the incident electromagnetic wave enters into the absorbing material to the maximum extent when the values of |Zin/Z0| are close to 1.51 In fact, according to the above-mentioned analysis of the reflection loss data, when the |Zin/Z0| value is higher than 0.53, the effective electromagnetic wave absorption with the thickness of 2.0 mm could be achieved. As aforementioned, the impedance mismatch of Co@pNGC-800 is caused by the high permittivity. Similarly, the values for Co@pNGC-600 and Co@pNGC-700 are close to 1 at 10.1 GHz and 14.7 GHz, respectively, which is consistent with the frequency responding to the minimum reflection loss. Above all, good attenuation ability and impedance matching are responsible for the good EM wave absorption performance of Co@pNGC-600 and Co@pNGC-700. A schematic diagram is presented in Fig. 10 to further understand the absorbing mechanism. After entering the absorber, the EM energy is converted to heat energy by a strong dielectric loss derived from interfacial polarization, migration, hopping of electrons, and the magnetic loss from the Co nanoparticles. In addition, the multiple reflections and scattering in the porous composites provide the propagation paths to attenuate the EM wave.
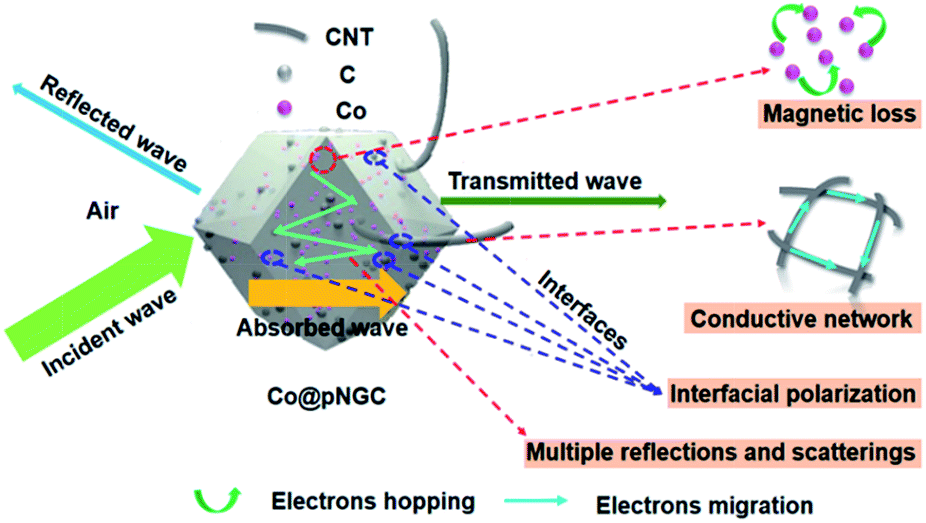 | ||
| Fig. 10 Schematic illustration of the mechanism of EM wave absorption of the Co@pNGC composites. | ||
4. Conclusions
In summary, the samples of Co@pNGC have been successfully fabricated by thermal decomposition of the bimetallic zeolitic imidazolate frameworks at different temperatures under the protection of a pure N2 atmosphere. The conversion of organic frameworks to porous carbon matrix and the in situ reduction of metal ions are fulfilled in a one-step calcining process. The results indicate that temperature plays a crucial role on the morphology, structure and performances of the porous carbon-based composites. In the Co@pNGC/paraffin composites with 20 wt% Co@pNGC-600, the minimum RL is −50.7 dB at 11.3 GHz and the widest effective absorption bandwidth (fwe, RL < −10 GHz) reaches 5.5 GHz (12.3–17.8 GHz), corresponding to a thickness of 2.0 mm. For the sample of Co@pNGC-700, the effective absorption bandwidth ranges of 2.9–18 GHz can be achieved by tuning the thickness of the absorber. In particular, the minimum thickness corresponding to the effective absorption is only 1.2 mm. The results demonstrate that these porous carbon-based composites would present a promising and attractive prospect for the application of EM wave absorbing materials.Conflicts of interest
There are no conflicts to declare.Acknowledgements
This study was financially supported by the Qing Lan Project, Environmental Protection Scientific Research Project of Jiangsu Province (2016056), the Shanghai Aerospace Science and Technology Innovation Fund (SAST2015020), the National Key R&D Program of China (2016YFB0302800) and a project funded by the Priority Academic Program Development of Jiangsu Higher Education Institutions.References
- L. K. Béland, G. D. Samolyuk and R. E. Stoller, J. Alloys Compd., 2016, 662, 415–420 CrossRef
.
- F. Shahzad, P. Kumar, Y.-H. Kim, S. M. Hong and C. M. Koo, ACS Appl. Mater. Interfaces, 2016, 8, 9361–9369 CAS
- A. Chaudhary, S. Kumari, R. Kumar, S. Teotia, B. P. Singh, A. P. Singh, S. K. Dhawan and S. R. Dhakate, ACS Appl. Mater. Interfaces, 2016, 8, 10600–10608 CAS
- B. Shen, W. Zhai, M. Tao, J. Ling and W. Zheng, ACS Appl. Mater. Interfaces, 2013, 5, 11383–11391 CAS
- Z. Chen, C. Xu, C. Ma, W. Ren and H. M. Cheng, Adv. Mater., 2013, 25, 1296–1300 CrossRef CAS PubMed
- B. Zhao, X. Guo, W. Zhao, J. Deng, G. Shao, B. Fan, Z. Bai and R. Zhang, ACS Appl. Mater. Interfaces, 2016, 7, 12951–12960 Search PubMed
- C. Méjean, L. Pometcu, R. Benzerga, A. Sharaiha, C. Le Paven-Thivet, M. Badard and P. Pouliguen, Mater. Sci. Eng., B, 2017, 220, 59–65 CrossRef
- K. Osouli-Bostanabad, H. Aghajani, E. Hosseinzade, H. Maleki-Ghaleh and M. Shakeri, Mater. Manuf. Processes, 2015, 31, 1351–1356 CrossRef
- M. S. Cao, J. Yang, W. L. Song, D. Q. Zhang, B. Wen, H. B. Jin, Z. L. Hou and J. Yuan, ACS Appl. Mater. Interfaces, 2012, 4, 6949–6956 CAS
- E. J. Jelmy, S. Ramakrishnan and N. K. Kothurkar, Polym. Adv. Technol., 2016, 27, 1246–1257 CrossRef CAS
- X. Sun, J. He, G. Li, J. Tang, T. Wang, Y. Guo and H. Xue, J. Mater. Chem. C, 2013, 1, 765–777 RSC
- B. Shen, Y. Li, D. Yi, W. Zhai, X. Wei and W. Zheng, Carbon, 2016, 102, 154–160 CrossRef CAS
- Y. Du, W. Liu, R. Qiang, Y. Wang, X. Han, J. Ma and P. Xu, ACS Appl. Mater. Interfaces, 2014, 6, 12997–13006 CAS
- A. S. Mahapatra, A. Mitra, A. Mallick and P. K. Chakrabarti, Ceram. Int., 2016, 42, 3826–3835 CrossRef CAS
- R. Hao, G. Wang, H. Tang, L. Sun, C. Xu and D. Han, Appl. Catal., B, 2016, 187, 47–58 CrossRef CAS
- Y. Chu and Q. Pan, ACS Appl. Mater. Interfaces, 2012, 4, 2420–2425 CAS
- S. Qiu, H. Lyu, J. Liu, Y. Liu, N. Wu and W. Liu, ACS Appl. Mater. Interfaces, 2016, 8, 20258–20266 CAS
- P. Liu, V. M. H. Ng, Z. Yao, J. Zhou, Y. Lei, Z. Yang, H. Lv and L. B. Kong, ACS Appl. Mater. Interfaces, 2017, 9, 16404–16416 CAS
- C. Rosler, A. Aijaz, S. Turner, M. Filippousi, A. Shahabi, W. Xia, G. Van Tendeloo, M. Muhler and R. A. Fischer, Chem.–Eur. J., 2016, 22, 3304–3311 CrossRef PubMed
- J. Yang, F. Zhang, H. Lu, X. Hong, H. Jiang, Y. Wu and Y. Li, Angew. Chem., Int. Ed. Engl., 2015, 54, 10889–10893 CrossRef CAS PubMed
- J. Tang, R. R. Salunkhe, J. Liu, N. L. Torad, M. Imura, S. Furukawa and Y. Yamauchi, J. Am. Chem. Soc., 2015, 137, 1572–1580 CrossRef CAS PubMed
- J. Tang, R. R. Salunkhe, H. Zhang, V. Malgras, T. Ahamad, S. M. Alshehri, N. Kobayashi, S. Tominaka, Y. Ide, J. H. Kim and Y. Yamauchi, Sci. Rep., 2016, 6, 30295 CrossRef CAS PubMed
- B. You, N. Jiang, M. Sheng, W. S. Drisdell, J. Yano and Y. Sun, ACS Catal., 2015, 5, 7068–7076 CrossRef CAS
- X. H. Li and M. Antonietti, Chem. Soc. Rev., 2013, 42, 6593–6604 RSC
- N. Zhang, Y. Huang, M. Zong, X. Ding, S. Li and M. Wang, Ceram. Int., 2016, 42, 18879–18886 CrossRef CAS
- H. R. Tantawy, D. E. Aston, J. R. Smith and J. L. Young, ACS Appl. Mater. Interfaces, 2013, 5, 4648–4658 CAS
- F. Zheng, Y. Yang and Q. Chen, Nat. Commun., 2014, 5, 5261 CrossRef CAS PubMed
- F. Cheng, W.-C. Li, J.-N. Zhu, W.-P. Zhang and A.-H. Lu, Nano Energy, 2016, 19, 486–494 CrossRef CAS
- A. Aijaz, N. Fujiwara and Q. Xu, J. Am. Chem. Soc., 2014, 136, 6790–6793 CrossRef CAS PubMed
- M. S. Cao, T. Wang, Z. Liu, M. Lu, B. Wen, Q. Ouyang, Y. Chen, C. Zhu, P. Gao, C. Li, M. Cao and L. Qi, J. Appl. Phys., 2013, 113, 024314 CrossRef
- B. Shen, Y. Li, W. Zhai and W. Zheng, ACS Appl. Mater. Interfaces, 2016, 8, 8050–8057 CAS
- T. S. Williams, N. D. Orloff, J. S. Baker, S. G. Miller, B. Natarajan, J. Obrzut, L. S. McCorkle, M. Lebron-Colón, J. Gaier, M. A. Meador and J. A. Liddle, ACS Appl. Mater. Interfaces, 2016, 8, 9327–9334 CAS
- Y. Lu, Y. Wang, H. Li, Y. Lin, Z. Jiang, Z. Xie, Q. Kuang and L. Zheng, ACS Appl. Mater. Interfaces, 2015, 7, 13604–13611 CAS
- S. Kumar, R. S. Meena and R. Chatterjee, J. Magn. Magn. Mater., 2016, 418, 194–199 CrossRef CAS
- A. Arora and S. B. Narang, J. Supercond. Novel Magn., 2016, 29, 2881–2886 CrossRef CAS
- H. Guo, Y. Zhan, Z. Chen, F. Meng, J. Wei and X. Liu, J. Mater. Chem. A, 2013, 1, 2286–2296 CAS
- J. Yang, J. Zhang, C. Liang, M. Wang, P. Zhao, M. Liu, J. Liu and R. Che, ACS Appl. Mater.
Interfaces, 2013, 5, 7146–7151 CAS
- M. S. S. Dorraji, M. H. Rasoulifard, M. H. Khodabandeloo, M. Rastgouy-Houjaghan and H. K. Zarajabad, Appl. Surf. Sci., 2016, 366, 210–218 CrossRef CAS
- A. Wang, W. Wang, C. Long, W. Li, J. Guan, H. Gu and G. Xu, J. Mater. Chem. C, 2014, 2, 3769–3776 RSC
- M. S. Cao, H. Yang, M. Cao, Y. Li, H. Shi, Z. Hou, X. Fang, H. Jin, W. Wang and J. Yuan, Adv. Opt. Mater., 2014, 2, 214–219 CrossRef
- F. Meng, W. Wei, X. Chen, X. Xu, M. Jiang, L. Jun, Y. Wang and Z. Zhou, Phys. Chem. Chem. Phys., 2016, 18, 2510–2516 RSC
- A. Aharoni, J. Appl. Phys., 1991, 69, 7762–7764 CrossRef
- G. Shen, X. Fang, H. Wu, H. Wei, J. Li, K. Li, B. Mei and Y. Xu, Appl. Phys. A: Mater. Sci. Process., 2017, 123, 291–300 CrossRef
- L. Deng and M. Han, Appl. Phys. Lett., 2007, 91, 023119 CrossRef
- H. B. Zhao, Z. B. Fu, H. B. Chen, M. L. Zhong and C. Y. Wang, ACS Appl. Mater. Interfaces, 2016, 8, 1468–1477 CAS
- A. N. Yusoff, M. H. Abdullah, S. H. Ahmad, S. F. Jusoh, A. A. Mansor and S. A. A. Hamid, J. Appl. Phys., 2002, 92, 876–882 CrossRef CAS
- B. Wen, M.-S. Cao, Z.-L. Hou, W.-L. Song, L. Zhang, M.-M. Lu, H.-B. Jin, X.-Y. Fang, W.-Z. Wang and J. Yuan, Carbon, 2013, 65, 124–139 CrossRef CAS
- B. Zhao, G. Shao, B. Fan, W. Zhao, Y. Xie and R. Zhang, J. Mater. Chem. A, 2015, 3, 10345–10352 CAS
- L. Kong, X. Yin, Y. Zhang, X. Yuan, Q. Li, F. Ye, L. Cheng and L. Zhang, J. Phys. Chem. C, 2013, 117, 19701–19711 CAS
- A. Baniasadi, A. Ghasemi, M. A. Ghadikolaei, A. Nemati and E. Paimozd, J. Mater. Sci.: Mater. Electron., 2015, 27, 1901–1905 CrossRef
- J. Liu, J. Cheng, R. Che, J. Xu, M. Liu and Z. Liu, ACS Appl. Mater. Interfaces, 2013, 5, 2503–2509 CAS
Footnote |
| † Electronic supplementary information (ESI) available. See DOI: 10.1039/c7ra08882e |
| This journal is © The Royal Society of Chemistry 2017 |