 Open Access Article
SiC-fixed organophilic montmorillonite hybrids for poly(phenylene sulfide) composites with enhanced oxidation resistance
Chenyang Li,
Zhenhuan Li *,
Maliang Zhang and
Bowen Cheng
 *
*
State Key Laboratory of Separation Membranes and Membrane Processes, College of Textiles, Tianjin Polytechnic University, Tianjin 300387, China. E-mail: zhenhuanli1975@aliyun.com; lizhenhuan@tjpu.edu.cn; bowen15@tjpu.edu.cn; Fax: +86 022 83955055; Tel: +86 022 83955358
First published on 3rd October 2017
Abstract
SiC-fixed organophilic montmorillonite (OMMT@SiC) hybrid particles, with various proportions of SiC, were fabricated by electrostatic self-assembly in the presence of CTAB. Then, their PPS composites were prepared by melt-compounding. The results showed that the oxidation resistance and mechanical properties of PPS/OMMT@SiC composites was enhanced. When SiC content reached 5 wt%, the oxidation induction temperature of the PPS/OMMT@SiC composite achieved its maximum 513.1 °C, which was 40.9 °C higher than that of pure PPS. Meanwhile, the oxidation induction time of the obtained composite achieved a maximum of 25.2 min. These enhancements were attributed to the existence of the SiC, which prevented the aggregation of OMMT and facilitated OMMT to be further exfoliated in the PPS matrix. The sulfur atoms of PPS formed chemical bonds with SiC, meanwhile, a part of the surface hydroxyl groups of SiC formed hydrogen bonds with PPS, thus weakening the oxidation activity. OMMT and SiC effectively postponed the thermal oxidative degradation of PPS due to synergistic effects.
Introduction
Poly(phenylene sulfide) (PPS) is an attractive engineering thermoplastic that possesses excellent thermal stability and chemical corrosion resistance,1–3 therefore, it is widely used in the field of high temperature filtration.4 However, the C–S–C bond of PPS macromolecules is particularly susceptible to being attacked by strong oxidizing gas under a high temperature environment, for example, pure PPS could be easily oxidized, macromolecular crosslinked, and even degraded, resulting in poor mechanical properties.5–7 In order to compensate for these defects, PPS is usually modified with organic antioxidants.8 Although organic antioxidants can retard PPS thermal oxidation degradation due to the low decomposition temperature, these small molecule oxidants could also be decomposed and gasified at the processing temperature of PPS (>300 °C), thereby cannot achieve the goal of antioxidant. Another efficient strategy to improve the antioxidant capacity of PPS is to introduce inorganic nanofillers into the PPS matrix, such as calcium aluminate,9 silicon dioxide10 and montmorillonite.11 Among these fillers, lamellar montmorillonite (MMT) has gained intensive interest due to its excellent oxygen barrier properties, because MMT can prevent oxygen infiltration and dramatically delay thermal oxidation degradation of polymer matrix.12–16 However, the development of high-performance polymer/MMT composites is still very difficult, since the dispersion state of MMT in polymer composites significantly influences the properties of the composites.17 The aggregation of MMT is always inevitable in polymer composites, due to strong interlayer cohesive force and weak interactions with polymer matrix.18–21 Alkyl ammonium salts are often used as intercalators to peel and modify MMT, however, those organic intercalators are easily degraded due to poor thermal stability at high processing temperature,22 which induce the decrease of interlayer distance of MMT.23 As a result, the physical properties of polymer/MMT composites are significantly compromised or even unavailable.Considering the above reasons, MMT is usually co-filled with other inorganic nanoparticles to enhance specific physical properties of polymer composites. For instance, Yang et al. fabricated MMT nanosheets and SiO2 nanoparticles co-filled with PPS composites, which show a much higher mechanical properties than pure PPS due to the synergic effect of MMT and SiO2 for their homogeneous dispersion.24 In addition, growing carbon nanomaterials on the OMMT surfaces is another type of hybrid filler structure. Zhang et al. successfully prepared carbon nanotubes-grown MMT sheet hybrids/PA6 composites which possess excellent mechanical properties.25
As a kind of the ceramic materials, SiC has aroused tremendous scientific and industrial interest owing to its thermal and mechanical properties. For instance, its high thermal conductivity and superior oxidation resistance (maximum usage temperature up to 1600 °C in air) enable it to be an excellent nanofiller for oxidation stability enhancement in polymer materials. In this work, SiC-fixed organophilic MMT (OMMT@SiC) hybrids were prepared by electrostatic self-assembly process, and their PPS composites were fabricated by melt-compounding. Compare with pure PPS, PPS/OMMT@SiC composites exhibited enhanced oxidation resistance and mechanical properties, particularly the PPS/OMMT@SiC composite with 5 wt% SiC achieved maximum oxidation induction temperature of 513.1 °C, which was 40.9 °C higher than that of pure PPS. Meanwhile, the oxidation induction time of the obtained composite achieved maximum 25.2 min. These excellent comprehensive properties are attributed to the existence of SiC, which promotes OMMT to be well exfoliated in PPS matrix and affords improved oxidation resistance.
Experimental section
Materials
PPS (density of 1.40 g cm−3) was made in a form of powder. SiC nanoparticles (40 nm) and hexadecyl trimethyl ammonium bromide (CTAB, 99%) were purchased from Aladdin Industrial Corp (Shanghai, China). Montmorillonite (Na-MMT) was obtained from Fenghong New Material Limited Corp (Zhejiang, China). HCl and NaOH were purchased from Lingfeng Chemical Company (Shanghai, China).Sample preparation
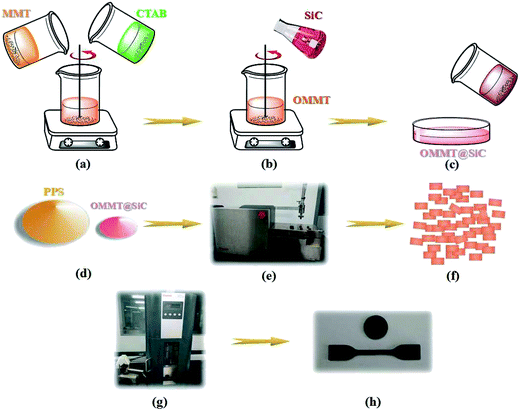
Detailed process is shown in Fig. 1. Firstly, Na-MMT and CTAB were dissolved into de-ionized water to prepare the suspension of MMT–water and CTAB–water. Subsequently, two suspensions were mixed together and heated at 60 °C under 200 W sonication and vigorous stirring for 1 h. After that dilute HCl was added to regulate the pH value of solution. Nano-SiC powder was successively washed with 5% NaOH solution and 5% dilute HCl solution under vigorous stirring and sonication at 200 W, and the treated SiC power was loaded into MMT/CTAB/water mixture at room temperature under simultaneous stirring and sonication. When the pH value of solution is greater than 4, the surfaces of SiC possess plenty of negative charges.26–28 Therefore, SiC nanoparticles are able to be absorbed on the surfaces of OMMT to form OMMT@SiC hybrid fillers in the presence of CTAB via electrostatic interaction. After that, the obtained product was washed by de-ionized water, and then filtered and dried. Subsequently, the melt-compounding of PPS with OMMT@SiC hybrid fillers were carried out using a twin-screw extruder (Haake MiniLab II Micro Compounder, Thermo Fisher Scientific, Germany) at 295 °C for 8 min. PPS was dried at 120 °C to remove water and some impurities before usage. The produced composites were injection molded through an injection-molding machine (Haake MiniJetPro, Thermo Fisher Scientific, Germany) at 315 °C, mold temperature of 120 °C and injection pressure of 800 bar for microstructure characterization and physical property measurement. For comparison, the composites filled with OMMT or SiC were also prepared using the same procedures. The sample notation and the corresponding compositions are listed in Table 1.| Samples | PPS (wt%) | SiC (wt%) | OMMT (wt%) |
|---|---|---|---|
| a x represents the relative weight fraction of SiC in the composites. | |||
| PPS | 100 | 0 | 0 |
| PPS/SiC-x | 95–99.5 | 0.5–5 | 0 |
| PPS/OMMT | 99 | 0 | 1 |
| PPS/OMMT@SiC-x | 94–98.5 | 0.5–5 | 1 |
Characterization
 | (1) |
The morphology of composites was carried out using a FEI Tecnai G2 F30 S-TWIN at an acceleration voltage of 300 kV. Sample films were prepared with a thickness of 60 nm using a Leica EMUC6/FC6 microtome.
Results and discussion
Characterization of OMMT@SiC hybrids
The surface chemical compositions of representative samples were characterized by FT-IR. As shown in Fig. 2, in the spectrum of CTAB, the peaks at 2918 cm−1 and 2850 cm−1 correspond to the –CH3 and –CH2– groups, respectively. For Na-MMT, the strong absorption at 3625 cm−1 is attributed to –OH stretching vibrations, and the peaks at 3440 cm−1 and 1640 cm−1 are characteristics of the stretching and bending vibrations of interlayer water, and the peak at 1039 cm−1 corresponds to Si–O–Si stretching vibrations. Organophilic MMT (OMMT) was prepared via cationic exchange procedure using the CTAB surfactant.30 Because the negative charge originates in the Na-MMT layer, the cationic head group of the CTAB will preferentially dwell at the layer surface and the aliphatic tail will diffuse away from the surface.31 Although the spectra of OMMT is similar to that of Na-MMT, some differences can be detected. In OMMT two distinct bands at 2918 cm−1 and 2850 cm−1 corresponding to the C–H stretching vibrations of CTAB are observed, however, the absorption peaks at 3625 cm−1, 3440 cm−1 and 1640 cm−1 become weaker. Those results suggest that CTAB has been successfully intercalated into Na-MMT. For SiC nanoparticles, the strong absorption at 3140 cm−1 is attributed to –OH stretching vibrations of adsorbed water, the peaks at 1640 cm−1 and 1398 cm−1 are attributed to the bending vibrations of –OH. The peaks at 1105 cm−1 and 920 cm−1 are attributed to Si–O stretching and Si–C stretching, respectively. For OMMT@SiC, the two major peaks around 2900 cm−1, corresponding to the C–H stretching vibration of the hydrocarbon chains of CTAB, are weakened. This evidence indicates that the surfactants were partly washed off during sample preparation. The spectra of OMMT@SiC possesses the characteristic peaks at 1030 cm−1 and 900 cm−1 of SiC nanoparticles indicating that SiC nanoparticles are coated on the surface of OMMT.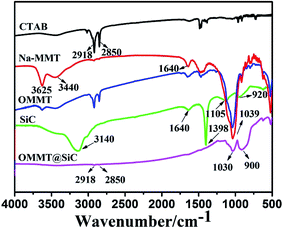 | ||
Fig. 2 FT-IR spectra of CTAB, Na-MMT, organophilic MMT (OMMT), SiC and OMMT@SiC hybrids (OMMT![[thin space (1/6-em)]](https://www.rsc.org/images/entities/char_2009.gif) : :![[thin space (1/6-em)]](https://www.rsc.org/images/entities/char_2009.gif) SiC = 1 SiC = 1![[thin space (1/6-em)]](https://www.rsc.org/images/entities/char_2009.gif) : :![[thin space (1/6-em)]](https://www.rsc.org/images/entities/char_2009.gif) 5). 5). | ||
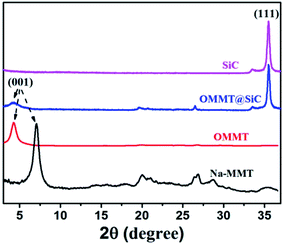
Fig. 3 shows the XRD patterns of Na-MMT, OMMT, SiC and OMMT@SiC hybrids. Pristine Na-MMT sample exhibits a distinct characteristic diffraction peak at 2θ = 7.05°, which is attributed to the diffractions of (001) crystal plane. According to the Bragg equation: 2d![[thin space (1/6-em)]](https://www.rsc.org/images/entities/char_2009.gif) sin
sin![[thin space (1/6-em)]](https://www.rsc.org/images/entities/char_2009.gif) θ = nλ, its basal spacing d = 1.25 nm is calculated. The diffraction peak of OMMT significantly shifts to small angle and diffraction angle reduces to 4.25° after organic modification, corresponding to an increase in the d-spacing to 2.07 nm. These phenomenons indicate that CTAB surfactant has intercalated into Na-MMT by cationic exchange. For SiC, the intensive peak at 2θ value of 35.6° is the diffraction peak of (111) plane. For OMMT@SiC hybrids, the characteristic diffraction peaks of SiC and OMMT exist, demonstrating that the SiC nanoparticles are absorbed on the OMMT surfaces.
θ = nλ, its basal spacing d = 1.25 nm is calculated. The diffraction peak of OMMT significantly shifts to small angle and diffraction angle reduces to 4.25° after organic modification, corresponding to an increase in the d-spacing to 2.07 nm. These phenomenons indicate that CTAB surfactant has intercalated into Na-MMT by cationic exchange. For SiC, the intensive peak at 2θ value of 35.6° is the diffraction peak of (111) plane. For OMMT@SiC hybrids, the characteristic diffraction peaks of SiC and OMMT exist, demonstrating that the SiC nanoparticles are absorbed on the OMMT surfaces.
Fig. 4 shows the TEM images of as-prepared OMMT@SiC with different mass ratios of OMMT to SiC. As shown in Fig. 4a and b, at the low loading of SiC nanoparticles, one can see that OMMT exhibits a large, smooth and lamellar stacking structure. Although OMMT sheets are absorbed by some dispersed SiC nanoparticles, OMMT@SiC maintain their two dimensional sheet structure after electrostatic self-assembly, and this is consistent with the XRD results as described above. Remarkably, almost no free SiC nanoparticles appear in the TEM visualization, indicating that there exists an electrostatic interaction between OMMT sheets and SiC nanoparticles. Namely, OMMT sheets are decorated with a small number of SiC nanoparticles. When the mass ratio is less than 1![[thin space (1/6-em)]](https://www.rsc.org/images/entities/char_2009.gif) :
:![[thin space (1/6-em)]](https://www.rsc.org/images/entities/char_2009.gif) 1, SiC nanoparticles are uniformly distributed on the OMMT surfaces. As the mass ratio increased, more SiC nanoparticles are closely absorbed and randomly distributed on the OMMT surfaces. As the ratio increased to 1
1, SiC nanoparticles are uniformly distributed on the OMMT surfaces. As the mass ratio increased, more SiC nanoparticles are closely absorbed and randomly distributed on the OMMT surfaces. As the ratio increased to 1![[thin space (1/6-em)]](https://www.rsc.org/images/entities/char_2009.gif) :
:![[thin space (1/6-em)]](https://www.rsc.org/images/entities/char_2009.gif) 5, SiC nanoparticles aggregate on the OMMT surfaces, and OMMT sheets are almost fully covered by SiC nanoparticles, as shown in Fig. 4d.
5, SiC nanoparticles aggregate on the OMMT surfaces, and OMMT sheets are almost fully covered by SiC nanoparticles, as shown in Fig. 4d.
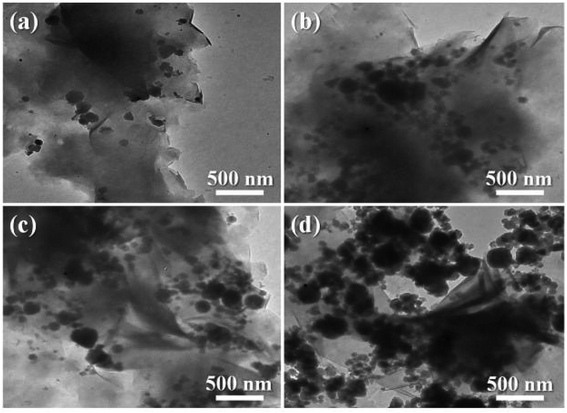 | ||
Fig. 4 TEM images of OMMT@SiC hybrids with different mass ratios of OMMT to SiC. (a) 1![[thin space (1/6-em)]](https://www.rsc.org/images/entities/char_2009.gif) : :![[thin space (1/6-em)]](https://www.rsc.org/images/entities/char_2009.gif) 0.5, (b) 1 0.5, (b) 1![[thin space (1/6-em)]](https://www.rsc.org/images/entities/char_2009.gif) : :![[thin space (1/6-em)]](https://www.rsc.org/images/entities/char_2009.gif) 1, (c) 1 1, (c) 1![[thin space (1/6-em)]](https://www.rsc.org/images/entities/char_2009.gif) : :![[thin space (1/6-em)]](https://www.rsc.org/images/entities/char_2009.gif) 2, and (d) 1 2, and (d) 1![[thin space (1/6-em)]](https://www.rsc.org/images/entities/char_2009.gif) : :![[thin space (1/6-em)]](https://www.rsc.org/images/entities/char_2009.gif) 5. 5. | ||
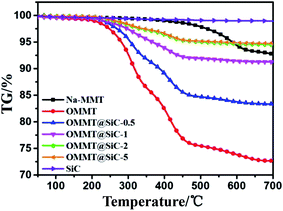
The thermal stability of Na-MMT, OMMT, SiC and OMMT@SiC hybrids is evaluated by thermogravimetric (TG) analysis under N2 atmosphere (Fig. 5). For an accurate comparison, the temperature corresponding to the initial decomposition temperature (Tonset) and the max decomposition temperature (Tmax) has been considered as presented in Table 2. It is obviously evident that almost no significant weight loss is observed for SiC nanoparticles. Pristine Na-MMT has little mass loss before 500 °C, only one main mass loss step at 562 °C with a mass loss of 3.8% is ascribed to the removal of –OH groups of the montmorillonite. It can be concluded that the structure of Na-MMT is relatively stable. In the TG curve of the OMMT, one main mass loss stage between 230 °C and 450 °C is observed, which is attributed to the decomposition of the external surface absorbed surfactants, interlayer-absorbed surfactants and intercalated surfactant cations, respectively.32–34 For OMMT@SiC hybrids, Tonset and Tmax of OMMT@SiC-5 are 263.3 °C and 417.9 °C, respectively. Tonset and Tmax of OMMT@SiC-5 are 12 °C and 107 °C higher than those of OMMT@SiC-0.5. What is important is that the weight loss of the OMMT@SiC-5 is only 1.7% at 300 °C, and the weight loss of the OMMT@SiC-0.5, OMMT@SiC-1, OMMT@SiC-2 is 4%, 2.4%, 2%, respectively. Therefore, there is no obstacle to prepare the PPS/OMMT@SiC composites at 295 °C.
| Samples | Tonset | Tmax |
|---|---|---|
| Na-MMT | 506.1 | 562.3 |
| OMMT | 250.2 | 310.3 |
| OMMT@SiC-0.5 | 251.3 | 310.6 |
| OMMT@SiC-1 | 253.7 | 410.1 |
| OMMT@SiC-2 | 261.4 | 416.3 |
| OMMT@SiC-5 | 263.3 | 417.9 |
Crystallization behavior of PPS composites
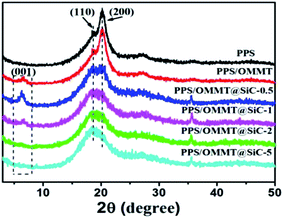
The crystalline structures of representative samples were characterized by using XRD patterns. As shown in Fig. 6, pure PPS sample exhibits two prominent diffraction peaks at 2θ value of 18.8° and 20.3°, which can be attributed to the characteristic peaks of (110) and (200) crystal planes of PPS.35 The existence of a weak (001) diffraction peak in PPS/OMMT sample indicates that nanosheets are badly dispersed in PPS matrix. In the comparison with the characterized results of Fig. 3, the (001) peak of OMMT shifts from 4.25° of 2θ to 6.7° instead of shifting to a lower angle, suggesting the decline of d-spacing of OMMT from 2.07 nm to 1.28 nm. OMMT nanosheets could agglomerate because of the partial degradation of CTAB intercalator in composite preparation at high temperature.23,36 As for the composite containing 0.5 wt% SiC, the (001) peak of OMMT located at 6.2° of 2θ value, indicating the interlayer spacing of d = 1.36 nm which is bigger than that of OMMT in PPS/OMMT composite.The partial CTAB intercalator decomposition in the process of composite preparation could resulted in OMMT interlayer spacing decline and nanosheets agglomeration, however, the presence of SiC prevent the decline of interlayer spacing of OMMT and facilitate the formation of well exfoliated OMMT in composites due to the mutual synergistic effects of OMMT and SiC in melt shear processing. As the percentage of SiC in composites increase, the weak (001) diffraction peak gradually disappears, indicating that OMMT is well exfoliated by SiC nanoparticles and a strong interaction between OMMT and SiC is established.25 As for the pure PPS sample, the (200) crystal plane exhibits the more intensive peak at 20°, while the peak of (110) plane is much weaker, indicating that the preferential crystal growth direction of PPS is along the direction of the (200) crystal plane. However, as SiC content increase in PPS/OMMT@SiC composites, the peak of (110) crystal plane gradually becomes more intensive, while the intensity of (200) crystal plane declined. Those results suggest that the crystal growth direction of PPS changed from (200) to (110) crystal plane.37
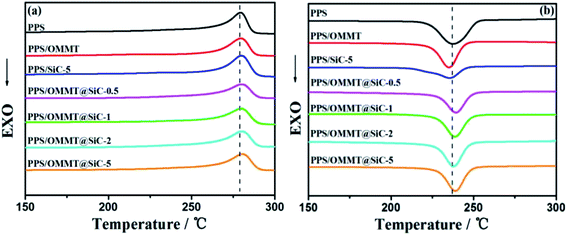
Fig. 7 exhibits the melting and crystallization behaviors of representative samples. The corresponding parameters are listed in Table 3. As seen from Fig. 7b, the presence of OMMT or SiC can induce the change of Xc. For example, pure PPS sample exhibits Xc of 45.4%, while PPS/OMMT and PPS/SiC-5 samples exhibit the Xc of 45.2% and 49.0%. It can be seen that the nonisothermal crystallization of PPS is influenced by OMMT or SiC, and the crystallization temperature (Tc) decreases with OMMT or SiC content increase. When the content of OMMT and SiC is 1 wt% and 5 wt%, Tc of PPS/OMMT and PPS/SiC samples decreases to 235.1 °C and 235.5 °C, which is lower than that of pure PPS sample (238.8 °C). Those results indicate that composites crystallization become difficult, which is attributed to the bad dispersion of nanofillers. PPS molecular chains are confined by agglomerated nanofillers, which reduce the molecular mobility and result in the slow crystallization rate. However, OMMT@SiC nanoparticles have strong ability to induce PPS composites crystallization. Both Tc and Xc of PPS/OMMT@SiC composites gradually increase with the increase of SiC content, and the presence of SiC particles induce the changes of PPS composites crystallization behavior. In other words, there is the synergistic effect between OMMT and SiC on influencing PPS composites crystallization.
| Samples | ΔHm (J g−1) | Xc (%) | Tm (°C) | Tc (°C) | ΔHc (J g−1) |
|---|---|---|---|---|---|
| PPS | 48.8 | 45.4 | 279.4 | 238.8 | −47.7 |
| PPS/OMMT | 47.3 | 45.2 | 280.2 | 235.1 | −47.0 |
| PPS/SiC-5 | 48.6 | 49.0 | 280.9 | 235.5 | −48.9 |
| PPS/OMMT@SiC-0.5 | 50.3 | 50.3 | 281.7 | 237.9 | −52.0 |
| PPS/OMMT@SiC-1 | 51.2 | 51.8 | 282.2 | 238.7 | −53.3 |
| PPS/OMMT@SiC-2 | 53.3 | 54.9 | 283.2 | 239.0 | −55.9 |
| PPS/OMMT@SiC-5 | 53.8 | 56.9 | 283.5 | 239.3 | −56.2 |
Dispersion and microstructure of fillers in PPS composites
The dispersion states of fillers in PPS were evaluated in SEM and TEM observations. Fig. 8a and b shows SEM morphologies of the fractured cross-section of PPS/OMMT composite. OMMT exhibits a large agglomerated structure, due to the degradation of intercalator and subsequently the decline of interlayer spacing of OMMT,23 which indicate that the stacked layers of OMMT can not dissociated by melt blending. In contrast, as shown in Fig. 8d and e, the arrow indicates the OMMT@SiC hybrid filler, almost no OMMT agglomerates appear in PPS/OMMT@SiC-5 composite, meanwhile, it also can be seen that the big particles of initial addition OMMT become small particles. This phenomenon is explicable by the presence of SiC nanoparticles which promote a better dispersion and exfoliation of OMMT during the fabrication process.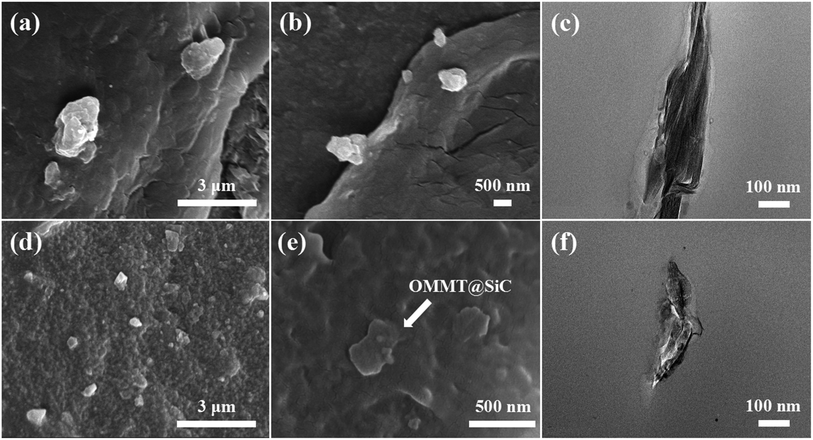 | ||
| Fig. 8 SEM (a, b, d, e) and TEM (c, f) images of PPS composites: (a–c) PPS/OMMT. (d–f) PPS/OMMT@SiC-5. | ||
In order to further prove the dispersion states of fillers in PPS, TEM observation is carried out to obtain the intuitionistic macroscopic view. As shown in Fig. 8c, the stacked layers of OMMT are evident in PPS/OMMT sample, which reveals the poor dispersion of agglomerated OMMT particles in the PPS matrix. In Fig. 8f, it can be seen that the OMMT has no obvious aggregation, some SiC nanoparticles are observed on OMMT interlayer, meanwhile, the size of hybrid OMMT sheet become smaller and the number of stacked OMMT layers is markedly reduced, which confirm with the SEM observations. In combined with the above-mentioned results, it can be concluded that the dispersion state of OMMT in PPS can be greatly improved with the help of SiC nanoparticles.
It is well known that the microstructure–performance relationship of materials is widely investigated by rheological measurement, which provides not only the information about processing flow ability but also the microstructure information on fillers in composite melt state.38 Because the melt state exhibits more apparent elastic characteristic, the formation of network structure of fillers in polymer matrix can be well demonstrated through an apparent plateau in the storage modulus curve at low frequencies.39 Fig. 9 exhibits the storage modulus (G′), loss modulus (G′′), Han plot of G′ versus G′′, and the complex viscosity (η*) of all samples. According to the variations of G′, G′′, and η*, the similar rheological results of PPS/SiC composites with that of the pure PPS can be observed when SiC particles content is less than 2 wt%, which indicates that few SiC particles do not influence the processing flow ability of composites. As for PPS/SiC composites, a feature of Newtonian fluid with nearly invariant η* is exhibited at relatively lower frequency ranges (Fig. 9d). As the content of SiC increases up to 5 wt%, PPS/SiC-5 exhibits the higher G′, G′′ and η* compared with pure PPS, and there exists an apparent plateau of the flow regime at low frequency ranges where G′ almost unchanged with frequency increase. Previous reports ascribed the plateau to the transition from liquid-like to solid-like viscoelastic behavior relevant to the significantly restrained long-range molecular chain motion, which further demonstrates the presence of particles network structure.38,40 However, G′ of PPS/OMMT sample is similar with that of PPS/SiC-5 sample, which implies that 1 wt% OMMT exhibits the similar performance with 5 wt% SiC particles in restricting PPS molecular chains motion. The more apparent plateau in G′ and G′′ curves at low frequency is, the more intensive network structure of filler is.40 It is interesting to observe that PPS/OMMT@SiC composites exhibit the higher G′, G′′ and more apparent plateau at low frequencies compared with PPS/SiC or PPS/OMMT composites, which implies that the more intensive network structures of fillers are formed in these samples. This result can be further demonstrated from the changes in the slope of Han plot of G′ versus G′′ (Fig. 9c). Generally speaking, the slope variations of Han plot represent the apparent microstructure changes of composites.41 As for the PPS/OMMT@SiC composites, the increase of G′ is higher than that of G′′ with fillers content increase, while a deviation from a linear relationship between G′ and G′′ is also observed, which represents the formation of the network structures of fillers in the melts.42 From Fig. 9d it can be seen that PPS/OMMT@SiC composites exhibit the higher η* in comparison with PPS/SiC or PPS/OMMT composites, indicating that the formation of exfoliated OMMT and rigid SiC particles network structures in PPS/OMMT@SiC composites result in the greater restriction for the mobility of PPS molecular chains.
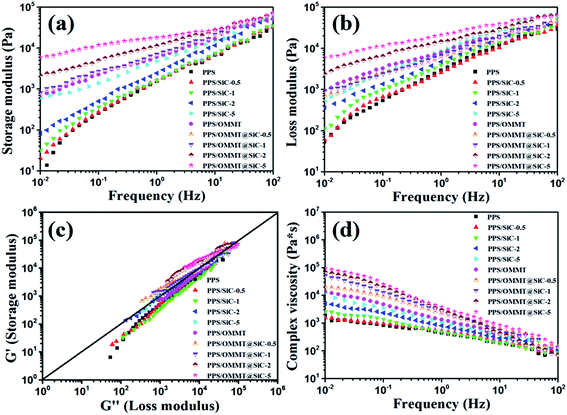 | ||
| Fig. 9 Rheological properties of all the samples. (a) Storage modulus, (b) loss modulus, (c) Han plot of storage modulus versus loss modulus, and (d) complex viscosity. | ||
Mechanical properties
It is well known that if fillers well dispersed in polymer matrix, its physical mechanical properties of material will be significantly changed.43,44 The tensile properties of samples are shown in Fig. 10. As the mass ratios of OMMT to SiC increased, the tensile strength and Young's modulus of PPS/OMMT@SiC composites increase while the elongation at break dramatically decrease. The increased tensile strength is closely related to the better exfoliation of OMMT and the existence of rigid SiC. PPS/OMMT@SiC-5 sample exhibits the maximum tensile strength. In the presence of 0.5 wt% and 1 wt% SiC, the elongation at break of PPS/OMMT@SiC composites is higher than that of pure PPS because of the promotion of crystal nucleation and synergistic strengthening/toughening enhancement from OMMT/SiC. However, the elongation at break of PPS/OMMT@SiC samples decrease with further increasing SiC content. Those results indicate that SiC particles with higher content induce the more obvious enhancement in composites stiffness.45 The Young's modulus of PPS/OMMT@SiC-5 remarkably increases from 641.7 MPa to 819.3 MPa in comparison with pure PPS. In summary, the increase of Young's modulus can be explained in terms of the mobility of PPS molecular chains which is restricted by OMMT@SiC fillers.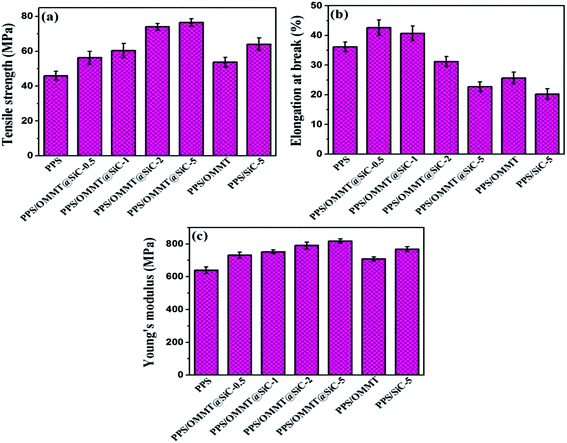 | ||
| Fig. 10 Variations of tensile properties of samples. (a) Tensile strength, (b) elongation at break, and (c) Young's modulus. | ||
Oxidation resistance properties
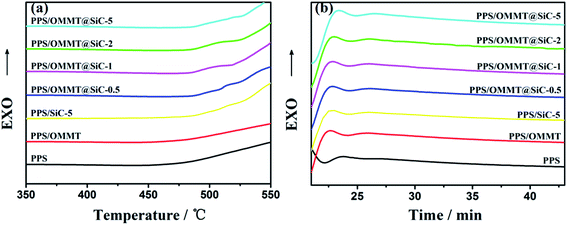
The oxidation induction temperature (dynamic OIT) and oxidation induction time (isothermal OIt) measurements conducted by DSC were used to study the antioxidant behavior of the samples. Higher OIT or longer OIt indicates the better thermal oxidative stability of materials.46–48 The OITs and OIts are determined by the onset of exothermic oxidation reaction of the PPS composites shown in the calorimetric curves (Fig. 11a and b). The values of OIT and OIt for different PPS composites are listed in Table 4. It can be seen that pure PPS sample exhibits a relatively low OIT, i.e. 472.2 °C. After addition by 1 wt% of OMMT and 5 wt% of SiC, the OIT of PPS increased by 3.7 °C and 35 °C, respectively. What is important is that the introduced SiC nanoparticles raise the OITs of PPS/OMMT@SiC composites, and the enhancement is dependent upon the content of SiC nanoparticles. In particular, the OIT of PPS/OMMT@SiC-5 composite is higher than those observed for pure PPS, PPS/OMMT and PPS/SiC-5 by 40.9 °C, 37.2 °C and 5.9 °C, respectively. For the isothermal measurements (Fig. 11b), the OIt of pure PPS at 230 °C is only 21.9 min under oxygen atmosphere. In contrast, the thermal oxidative stability of PPS is improved after incorporation of OMMT or SiC. The lengthened OIts as well as the elevated OITs of PPS/OMMT and PPS/SiC-5 composites revealed that the OMMT and SiC both have an antioxidant ability to protect PPS from thermal oxidation. It is also worth noting that the OIts of PPS composites is obviously improved after incorporation of OMMT@SiC hybrids. The OIt of PPS/SiC-5 composite (24.6 min) at 230 °C is slightly longer than that of PPS/OMMT@SiC-0.5 composite (24.3 min). However, as the mass ratio of OMMT to SiC increase, the OIt of PPS/OMMT@SiC-5 composite at 230 °C is 25.2 min, which is 3.3 min longer than that of pure PPS. The above results reveal that OMMT@SiC hybrids are much more efficient than OMMT or SiC in preventing PPS from thermal oxidative degradation. Therefore, the synergistic effects between OMMT and SiC play a key role on improving the oxidation resistance of PPS.| Samples | OIT (°C) | OIt (min) |
|---|---|---|
| PPS | 472.2 | 21.9 |
| PPS/OMMT | 475.9 | 23.8 |
| PPS/SiC-5 | 507.2 | 24.6 |
| PPS/OMMT@SiC-0.5 | 503.5 | 24.3 |
| PPS/OMMT@SiC-1 | 506.5 | 24.5 |
| PPS/OMMT@SiC-2 | 509.3 | 24.7 |
| PPS/OMMT@SiC-5 | 513.1 | 25.2 |
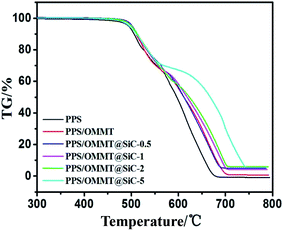
TG curves of samples under air atmosphere are shown in Fig. 12. At high temperature and oxygen environment, pure PPS could be easily oxidized and macromolecular crosslinked. The TG curve shows that the process of thermal oxidative decomposition of PPS is divided into two stages. Tonset of pure PPS is 485 °C. PPS has nearly decomposed completely at 674 °C, and the residual amount at 800 °C is only about 0.2%, which is consistent with previous report.49,50 Tonset for each of the PPS composites is enhanced in comparison with pure PPS. It is also noticeable that the higher thermal stability of PPS/OMMT@SiC composites is observed as the mass ratios of OMMT to SiC increase. In particular, Tonset of PPS/OMMT@SiC-5 composite is 495 °C, PPS/OMMT@SiC-5 composite decomposes completely at 743 °C and still contains about 5% residual amount at 800 °C. It seems that PPS/OMMT@SiC-5 composite is the most stable among all the samples.
TG-FTIR spectrum provided the credible evidence for the evolution of products in thermal decomposition of samples. The process of thermal decomposition weightlessness of PPS is accompanied by volatile gas escape. As shown in Fig. 13a, very intense peaks are detected at 3738 cm−1, 2356 cm−1, 2076 cm−1, 1376 cm−1, which show that H2O, CO2, CO and SO2 are released during thermal decomposition of PPS.51 By comparing the peaks in the location and shape of decomposition products, it can be seen that OMMT@SiC hybrids play a key role on postponing the thermal oxidative decomposition of PPS, the oxidation resistance of PPS is obviously improved after incorporation OMMT@SiC hybrids.
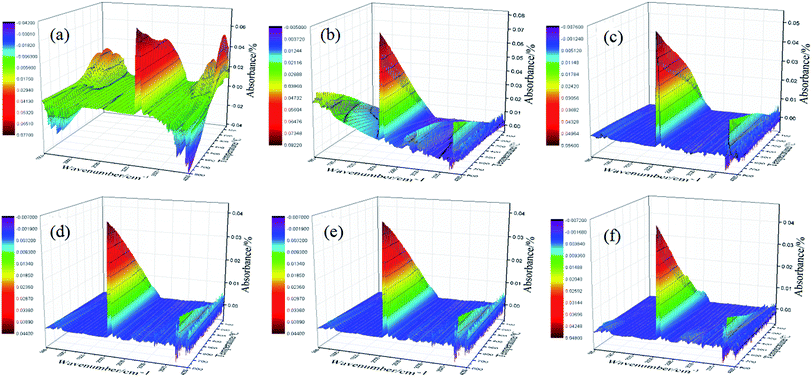 | ||
| Fig. 13 Three-dimensional spectra of TG-FTIR of samples. (a) PPS, (b) PPS/OMMT, (c) PPS/OMMT@SiC-0.5, (d) PPS/OMMT@SiC-1, (e) PPS/OMMT@SiC-2, (f) PPS/OMMT@SiC-5. | ||
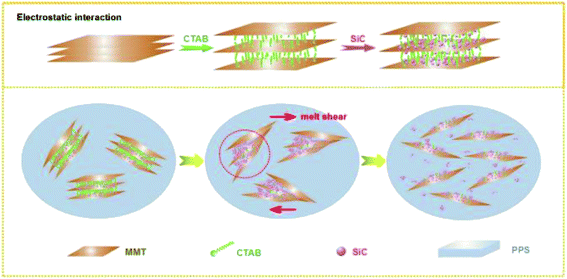
The structural transition process of PPS/OMMT@SiC was provided in Fig. 14. The positively charged CTA+-modified MMT allows the negatively charged SiC to adsorb on MMT surfaces to form a MMT–CTA+–SiC complex because of the strong electrostatic interaction, which provides OMMT an opportunity to contact with SiC particles directly. Although a part of intercalator migrated from composites during the washing process or degraded at high temperature, the presence of SiC can effectively prevents OMMT nanosheets from stacking, thus PPS molecular chains can be easily inserted into the OMMT interlayer. For PPS/OMMT composites, it is difficult for OMMT particles to well disperse in PPS matrix, and OMMT can aggregates easily. As for PPS/OMMT@SiC composites, there exists the direct interaction between OMMT and SiC, which well prevents OMMT from aggregation. At the same time, a higher viscosity of PPS/OMMT@SiC leads to the efficient stress propagation among nanofillers, and SiC continuously collide with the OMMT under the action of shear stress, which facilitates OMMT exfoliation to improve filler dispersion. Well exfoliated OMMT could be more effective barrier heat transfer. In addition, under high temperature and melt shear force, there is strong interaction between active hydroxyl groups on the surfaces of SiC and PPS, and the main dominant sort of binding force is hydrogen bond, which could shield oxygen intrusion. Meanwhile, the sulfur atoms of PPS form chemical bond with SiC, thus weakening the oxidation activity. Therefore, OMMT and SiC effectively postpone the thermal oxidative degradation of PPS due to the synergistic effects, which induce the great enhancement of oxidation resistance of the composites.
Conclusions
SiC-fixed organophilic montmorillonite (OMMT@SiC) hybrid particles, with various proportions of SiC, were fabricated by electrostatic self-assembly in the presence of CTAB. Then, PPS composites, filled with SiC, OMMT and OMMT@SiC hybrids, were prepared by melt-compounding. Owing to the unique structure, OMMT@SiC hybrids performed as a more effective filler to enhance the oxidation resistance and mechanical properties of PPS composites. When 5 wt% of SiC was used, the dynamic OIT of PPS/OMMT@SiC composite showed maximum 513.1 °C, which was 40.9 °C higher than that of pure PPS, and the isothermal OIt of the obtained composite achieved maximum 25.2 min. These excellent comprehensive properties were attributed to the existence of the SiC. During PPS/OMMT@SiC composites preparation, some inserted CTAB could be decomposed, which resulted in OMMT interlayer spacing decline or nanosheets agglomeration, however, the introduced SiC could prevented the aggregation of OMMT and facilitated OMMT to be further exfoliated in PPS matrix. Also, the sulfur atoms of PPS formed chemical bond with SiC, meanwhile, a part of the surface hydroxyl groups of SiC formed hydrogen bond with PPS, thus weakening the oxidation activity. OMMT and SiC effectively postponed the thermal oxidative degradation of PPS due to the synergistic effects. The enhanced oxidation resistance and mechanical properties make the PPS/OMMT@SiC composites more suitable for high temperature applications.Conflicts of interest
The authors declare no competing financial interest.Acknowledgements
The authors are grateful for the financial support of Tianjin Natural Science Foundation of China (15JCZDJC7000), China National Textile and Apparel Council (J201406) and Science and Technology Plans of Tianjin (15PTSYJC00240).References
- M. L. Zhang, X. T. Wang, C. Y. Li, Y. L. Bai, B. W. Cheng and Z. H. Li, RSC Adv., 2016, 6, 92378–92386 RSC.
- M. L. Zhang, H. X. Wang, Z. H. Li and B. W. Cheng, RSC Adv., 2015, 5, 13840–13849 RSC.
- K. Stoeffler, S. Andjelic, N. Legros, J. Roberge and S. B. Schougaard, Compos. Sci. Technol., 2013, 84, 65–71 CrossRef CAS.
- C. J. Wolf, J. Appl. Polym. Sci., 2003, 90, 615–625 CrossRef CAS.
- D. D. Lian, J. M. Dai, R. P. Zhang, M. Niu and Y. L. Huang, Polym. Degrad. Stab., 2016, 129, 77–86 CrossRef CAS.
- W. Tanthapanichakoon, M. Furuuchi, K. H. Nitta, M. Hata, S. Endoh and Y. Otani, Polym. Degrad. Stab., 2006, 91, 1637–1644 CrossRef CAS.
- W. Tanthapanichakoon, M. Hata, K. H. Nitta, M. Furuuchi and Y. Otani, Polym. Degrad. Stab., 2006, 91, 2614–2621 CrossRef CAS.
- T. Sugama, Mater. Lett., 2000, 43, 185–191 CrossRef CAS.
- T. Sugama and K. Gawlik, Mater. Lett., 2003, 57, 4282–4290 CrossRef CAS.
- X. Q. Sheng, R. P. Zhang, M. Niu, H. Yang, J. M. Dai and L. B. Gao, Adv. Mater. Res., 2011, 287–290, 2590–2597 CrossRef CAS.
- J. X. Wan, Y. F. Qin, S. B. Li and X. H. Wang, Adv. Mater. Res., 2011, 332–334, 1045–1048 CrossRef CAS.
- D. Yi, R. Yang and C. A. Wilkie, Polym. Adv. Technol., 2013, 24, 204–209 CrossRef CAS.
- M. C. Costache, M. J. Heidecker, E. Manias, G. Camino, A. Frache, G. Beyer, R. K. Gupta and C. A. Wilkie, Polymer, 2007, 48, 6532–6545 CrossRef CAS.
- A. Dasari, Z. Z. Yu, Y. W. Mai and J. K. Kim, Nanotechnology, 2008, 19, 1721–1728 CrossRef PubMed.
- A. Somwangthanaroj, W. Ubankhlong and W. Tanthapanichakoon, J. Appl. Polym. Sci., 2010, 118, 538–546 CrossRef CAS.
- P. Peng, Z. Yang, M. Wu, Q. Zhang and G. Chen, J. Appl. Polym. Sci., 2013, 130, 3952–3960 CAS.
- K. Hedicke, H. Wittich, C. Mehler, F. Gruber and V. Altstädt, Compos. Sci. Technol., 2006, 66, 571–575 CrossRef CAS.
- N. Sheng, M. C. Boyce, D. M. Parks, G. C. Rutledge, J. I. Abes and R. E. Cohen, Polymer, 2004, 45, 487–506 CrossRef CAS.
- S. Zhu, J. Chen, H. Li and Y. Cao, J. Appl. Polym. Sci., 2013, 128, 3876–3884 CrossRef CAS.
- H. J. Sue, K. T. Gam, N. Bestaoui, N. Spurr and A. Clearfield, Chem. Mater., 2004, 16, 242–249 CrossRef CAS.
- Y. Fukushima and S. Inagaki, J. Inclusion Phenom., 1987, 5, 473–482 CrossRef CAS.
- H. Zou, N. Ning, R. Su, Q. Zhang and Q. Fu, J. Appl. Polym. Sci., 2007, 106, 2238–2250 CrossRef CAS.
- Z. Hao, X. Wei, Q. Zhang and F. Qiang, J. Appl. Polym. Sci., 2006, 99, 1724–1731 CrossRef.
- Y. Q. Yang, H. J. Duan, S. Y. Zhang, P. F. Niu, G. Zhang, S. R. Long, X. J. Wang and J. Yang, Compos. Sci. Technol., 2013, 75, 28–34 CrossRef CAS.
- W. D. Zhang, I. Y. Phang and T. X. Liu, Adv. Mater., 2006, 18, 73–77 CrossRef CAS.
- L. S. Čerović, S. K. Milonjić and M. B. Todorović, Colloids Surf., A, 2007, 297, 1–6 CrossRef.
- B. P. Singh, J. Jena, L. Besra and S. Bhattacharjee, J. Nanopart. Res., 2007, 9, 797–806 CrossRef CAS.
- Q. Huang, M. Gu, K. Sun and Y. Jin, Ceram. Int., 2002, 28, 747–754 CrossRef CAS.
- Y. F. Zhao, M. Xiao, S. J. Wang, X. C. Ge and Y. Z. Meng, Compos. Sci. Technol., 2007, 67, 2528–2534 CrossRef CAS.
- R. A. Vaia, R. K. Teukolsky and E. P. Giannelis, Chem. Mater., 1994, 6, 1017–1022 CrossRef CAS.
- R. A. Vaia and E. P. Giannelis, Macromolecules, 1997, 30, 7990–7999 CrossRef CAS.
- J. Xing, B. Y. Deng and Q. S. Liu, Fibers Polym., 2015, 16, 1220–1229 CrossRef CAS.
- J. W. Gilman, W. H. Awad, R. D. Davis, J. Shields Jr, R. H. Hrris, C. Davis, A. B. Morgan, T. E. Sutto, J. Callahan, P. C. Trulove and H. C. Delong, Chem. Mater., 2002, 14, 3776–3785 CrossRef CAS.
- M. EI Achaby, H. Ennajih, F. Z. Arrakhiz, A. EI Kadib, R. Bouhfid, E. Essassi and A. Qaiss, Compos. B. Eng., 2013, 51, 310–317 CrossRef.
- R. Napolitano, A. Beniamino Pirozzi and A. Salvione, Macromolecules, 1999, 32, 7682–7687 CrossRef CAS.
- Y. Yang, H. Duan, X. Wang, Y. Liu and J. Yang, High Perform. Polym., 2015, 2, 375–380 Search PubMed.
- Y. J. Xiao, W. Y. Wang, T. Lin, X. J. Chen, Y. T. Zhang, J. H. Yang, Y. Wang and Z. W. Zhou, J. Phys. Chem. C, 2016, 120, 6344–6355 CAS.
- M. Sumita, K. Sakata, S. Asai, K. Miyasaka and H. Nakagawa, Polym. Bull., 1991, 25, 265–271 CrossRef CAS.
- D. Xu and Z. Wang, Polymer, 2008, 49, 330–338 CrossRef CAS.
- W. B. Zhang, Z. X. Zhang, J. H. Yang, T. Huang, N. Zhang, X. T. Zheng, Y. Wang and Z. W. Zhou, Compos. Sci. Technol., 2015, 90, 242–254 CAS.
- H. K. F. Cheng, N. G. Sahoo, Y. Pan, L. Li, S. H. Chan, J. Zhao and G. Chen, J. Polym. Sci., Part B: Polym. Phys., 2010, 48, 1203–1212 CrossRef CAS.
- R. A. Khare, A. R. Bhattacharyya, A. R. Kulkarni, M. Saroop and A. Biswas, J. Polym. Sci., Part B: Polym. Phys., 2008, 46, 2286–2295 CrossRef CAS.
- S. Pack, T. Kashiwagi, C. Cao, C. S. Korach, M. Lewin and M. H. Rafailovich, Macromolecules, 2010, 43, 5338–5351 CrossRef CAS.
- M. W. Möller, U. A. Handge, D. A. Kunz, T. Lunkenbein, V. Altstädt and J. Breu, ACS Nano, 2010, 4, 717–724 CrossRef PubMed.
- C. Y. Li, Z. H. Li, L. Cao and B. W. Cheng, Ind. Eng. Chem. Res., 2016, 55, 10860–10867 CrossRef CAS.
- J. Q. Hu, X. L. Wang, G. L. Dai, Y. W. Fei, X. Y. Wei and Z. M. Zong, Ind. Lubr. Tribol., 2011, 63, 78–83 CrossRef.
- X. M. Shi, B. B. Jiang, J. D. Wang and Y. R. Yang, Carbon, 2012, 50, 1005–1013 CrossRef CAS.
- W. W. Focke and I. V. D. Westhuizen, J. Therm. Anal. Calorim., 2010, 99, 285–293 CrossRef CAS.
- M. Naffakh, C. Marco, M. A. Gomez, J. Gomez-Herrero and I. Jimenez, J. Phys. Chem. B, 2009, 113, 10104–10111 CrossRef CAS PubMed.
- X. J. Di, F. Li, Q. F. Lin and X. D. Zhou, High Perform. Polym., 2014, 26, 97–105 CrossRef.
- W. W. Simons, Sadtler handbook of infrared spectra, Sadtler Research Laboratories, 1978, vol. 11, p. 21A Search PubMed.
| This journal is © The Royal Society of Chemistry 2017 |

