
 Open Access Article
 This Open Access Article is licensed under a
 Creative Commons Attribution 3.0 Unported Licence
Negligible cation effect on the vibrational relaxation dynamics of water molecules in NaClO4 and LiClO4 aqueous electrolyte solutions
Qianshun Wei,
Dexia Zhou and
Hongtao Bian *
*
Key Laboratory of Applied Surface and Colloid Chemistry of Ministry of Education, School of Chemistry and Chemical Engineering, Shaanxi Normal University, Xi'an, 710119, China. E-mail: htbian@snnu.edu.cn
First published on 9th November 2017
Abstract
In this study, the cation effects on the vibrational relaxation dynamics of water molecules in NaClO4 and LiClO4 aqueous solutions are investigated via polarization selective IR pump probe experiments. The distinct peak splitting of the OD stretch of HOD molecules in concentrated NaClO4 and LiClO4 aqueous solutions enables us to investigate the specific cation effects on the dynamics of water molecules that are hydrogen bonded to ClO4−. The reorientation of ClO4−-bound water molecules shows a bi-exponential decay and the slow component of the reorientation time constant is sensitive to the function used to describe the rotational anisotropy decay. We also show that the rotational dynamics of water molecules that are hydrogen bonded to anions is restricted and cannot decay to zero in the concentrated NaClO4 and LiClO4 aqueous solutions. Furthermore, the cation effects (Li+, Na+) on the vibrational relaxation dynamics of water molecules hydrogen bonded to ClO4− are observed to be relatively negligible.
1. Introduction
Aqueous electrolyte solutions have been of interest in chemistry, biology, and atmospheric environment sciences and have been investigated for many years. Valuable information has been gained regarding the structure and dynamics of water molecules in aqueous electrolyte solutions.1–7 It is generally accepted that anions have more pronounced effects than cations on the water structure and dynamics in aqueous solutions.8,9 The effects of ions on the water structure usually follow the order of the Hofmeister series and are originally arranged according to their ability to salt out or salt in proteins.10 The Hofmeister series has been utilized for more than 100 years, where ions are classified as “structure making” or “structure breaking” resulting from the effect on the structure of water molecules.10–16 The concept of the Hofmeister series is mainly based on the macroscopic properties of aqueous solutions, such as viscosity, surface tension and entropy of solvation measurements. However, the terms “structure making” and “structure breaking” have been disputed for many years.17 Also, the mechanism of specific ion effects on protein denaturation is still not well addressed at the molecular level and is lacking microscopic explanations. One of the central topics in the field of aqueous electrolyte solutions is to obtain the correlations between the ion hydration and the resulting molecular dynamics and structures which inevitably relies on the development of new spectroscopic techniques.Ultrafast IR spectroscopy has been demonstrated as a useful method to unravel the ion hydrations in aqueous electrolyte solutions at the molecular level.18–22 Bakker and co-workers firstly investigated the aqueous electrolyte solutions containing ClO4− using ultrafast IR pump probe spectroscopy, and found that the presence of ions does not lead to an enhancement or breakdown of the hydrogen-bond network in bulk liquid water.17,23 While the rotational dynamics of anion-bonded water molecules slowed down significantly. Fayer and co-workers also showed that water molecules interacting with ions can have much slower fluctuation dynamics.24–27 More recently, the exchange dynamics between anion and water in the NaClO4 and NaBF4 aqueous solutions have been well studied using two dimensional infrared (2DIR) spectroscopy.25,28,29 The exchange dynamics between water–water and water–anion hydrogen bonds occurs several times slower than the rate of hydrogen bond rearrangement dynamics in pure water. It also showed that water molecule shifts its donated hydrogen bonds between water and ClO4− anions by a large and prompt angular rotation.25,28,30–32
However, in most of electrolyte aqueous solution studies probed with ultrafast IR spectroscopy, the pronounced anion and water interaction is extensively investigated. The cation effect on the hydrogen bond network and dynamics of water is usually less studied and there is still no consensus regarding the specific cation effect on the rotational dynamics of water. Bakker and co-worker originally reported that cations were not able to affect the rotational dynamics of water in the NaClO4 aqueous solution.17,23 While in a subsequent report, they showed there is small but significant cation effect on the vibrational lifetime of water molecules in aqueous salt solutions.33 Recent studies further showed that cations and anions affect each other's hydration shell dynamics in a subtle way34–36 and the effect of ions and counterions on water can be strongly interdependent and nonadditive.5
In the concentrated electrolyte aqueous solutions (>3 mol kg−1), the effects of ion and ion interactions, including cation/anion and anion/anion interactions, need to be considered to analyze the ion effects on the water dynamics. Previous MD simulations showed that certain amounts of ion pairing and clustering can be expected in the concentrated strong electrolyte aqueous solutions.37,38 Recently, we developed the intermolecular mode specific vibrational energy transfer method and successfully applied this method to the electrolyte aqueous solution systems.39,40 We found that ions form significant amount of clusters in KSCN aqueous solutions.41–44 We further investigated the different behavior of rotational dynamics of water molecules and anions due to the structural inhomogeneity and discussed the anion and cation effects.43,44
To investigate the specific cation effect on the water dynamics in electrolyte aqueous solution, it is necessary to separate the contribution from dynamics of water in anionic hydration shell and water dynamics in the bulk liquid. The electrolyte aqueous solution containing ClO4− provides a unique system because of the large frequency shift (∼130 cm−1) of anion bonded hydroxyl stretch. In this work, we investigated the specific cation effects on the vibrational relaxation dynamics of water molecules in NaClO4 and LiClO4 aqueous solutions using ultrafast IR pump probe spectroscopy. The cation effects are investigated in terms of the vibrational lifetime and reorientation of the OD-stretch in NaClO4 and LiClO4 aqueous solutions. We found there are slightly small cation effects on the vibrational relaxation dynamics of anion bonded water molecules in the systems studied even at concentration up to 5.5 mol kg−1. We further showed that rotational dynamics of water molecules that hydrogen bonded to anions is restricted and cannot decay to zero in the concentrated aqueous solutions.
2. Experimental details
The experimental setup for the ultrafast IR spectroscopy has been described elsewhere.39,41,44,45 Briefly, a ps amplifier and a fs amplifier are independently operated and synchronized with the same seed pulse from a Ti-sapphire oscillator. The ps amplifier pumps an OPA to produce ∼1 ps Mid-IR pulses with a bandwidth ∼18 cm−1 at 1 kHz repetition rate. The fs amplifier pumps another OPA to produce ∼140 fs Mid-IR pulses with a bandwidth ∼200 cm−1 at 1 kHz repetition rate. In the polarization selective IR pump probe experiments, the ps IR pulse is the pump beam. The fs IR pulse is the probe beam which is frequency resolved by a spectrograph. Two polarizers are added into the probe beam path to selectively measure the parallel or perpendicular polarized signal relative to the pump beam. Vibrational lifetimes are obtained from the rotation free signal Plife = P∥ + 2 × P⊥, where P∥ and P⊥ are parallel and perpendicular signal respectively. Rotational relaxation times are obtained from the waiting time dependent anisotropy R = (P∥ − P⊥)/(P∥ + 2 × P⊥).All chemicals were purchased from Sigma-Aldrich Company. The isotopically mixed water solution of HOD in H2O was prepared by mixing 2 wt% D2O with H2O. All concentrations are reported in moles of solute per kilogram of solvent. All the FTIR spectra were obtained with Nicolet IS10 spectrometer (Thermo Scientific) with 1 cm−1 resolution. The samples were sandwiched in a home-made cell composed of two CaF2 windows separated by a Teflon spacer. The thickness of the spacer was controlled at 50 μm and can be adjusted depending upon the optical densities. The experimental optical path and apparatus after the generation of mid-IR pulses was purged with CO2 and H2O free clean air. All the measurements were carried out at room temperature (22 ± 1 °C), and the humidity in the room is controlled around 40%.
3. Results and discussion
3.1. Concentration-dependent FTIR spectra of the stretch of OD groups in NaClO4 and LiClO4 aqueous solutions
Fig. 1 A and B shows the FTIR spectra of NaClO4 and LiClO4 in the OD stretching region in HOD (2 wt% D2O in H2O) solutions with different concentrations. Two distinct peaks can be clearly observed, especially at higher salt concentrations (>3 mol kg−1). It is generally accepted that the two distinct peaks correspond to two types of hydrogen bond configurations in the aqueous ionic solutions containing the ClO4− anions.29 The OD stretch frequency positioned at around 2509 cm−1 is assigned to the ODw groups hydrogen bonded to other water molecules in the solution. While the OD stretch in the higher frequency (∼2630 cm−1) is assigned to the ODa groups hydrogen bonded to the anions in the solution. The central frequencies of ODw stretch blue shift at higher ion concentration in both NaClO4 and LiClO4 solutions and the results are plotted in Fig. 2A. It is known that the blue shifts of ODw frequency at higher ion concentrations is an indication of disruption of hydrogen bond networks in the MClO4 (M = Li, Na) solutions. Also the amplitudes of ODw frequency shifts are only dependent on the ion concentration, regardless of the nature of cations (Li, Na). The observed results here are consistent with our general understanding that the anions have more significant effects on the vibrational spectra of water molecules because of its direct binding to positively charged hydrogen atoms of water molecules and weaken the force constant of the OD stretch.44,46,47 On the other hand, the interactions between cation and water do not directly interfere with the OD bonds due to its binding to the negatively charged electron pairs on the oxygen atoms of the water molecules.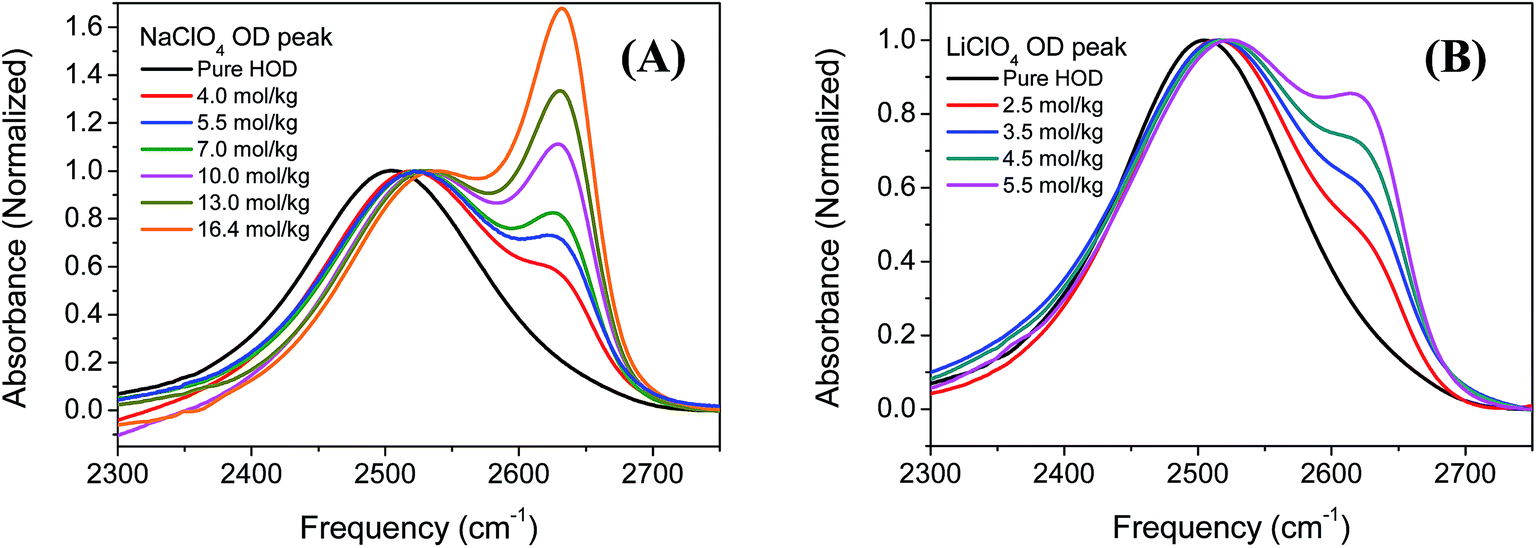 | ||
| Fig. 1 FTIR spectra of (A) NaClO4 and (B) LiClO4 aqueous solutions (HOD, 2 wt% D2O in H2O) in the OD stretch frequency region at different salt concentrations. FTIR spectrum of the OD stretch of HOD water is shown for comparison. All the spectra are normalized at the OD stretch frequency positioned at around 2509 cm−1 which is assigned to OD groups hydrogen bonded to other water molecules. The H2O background has been subtracted in the spectra. The unit of concentration is molality mol kg−1. | ||
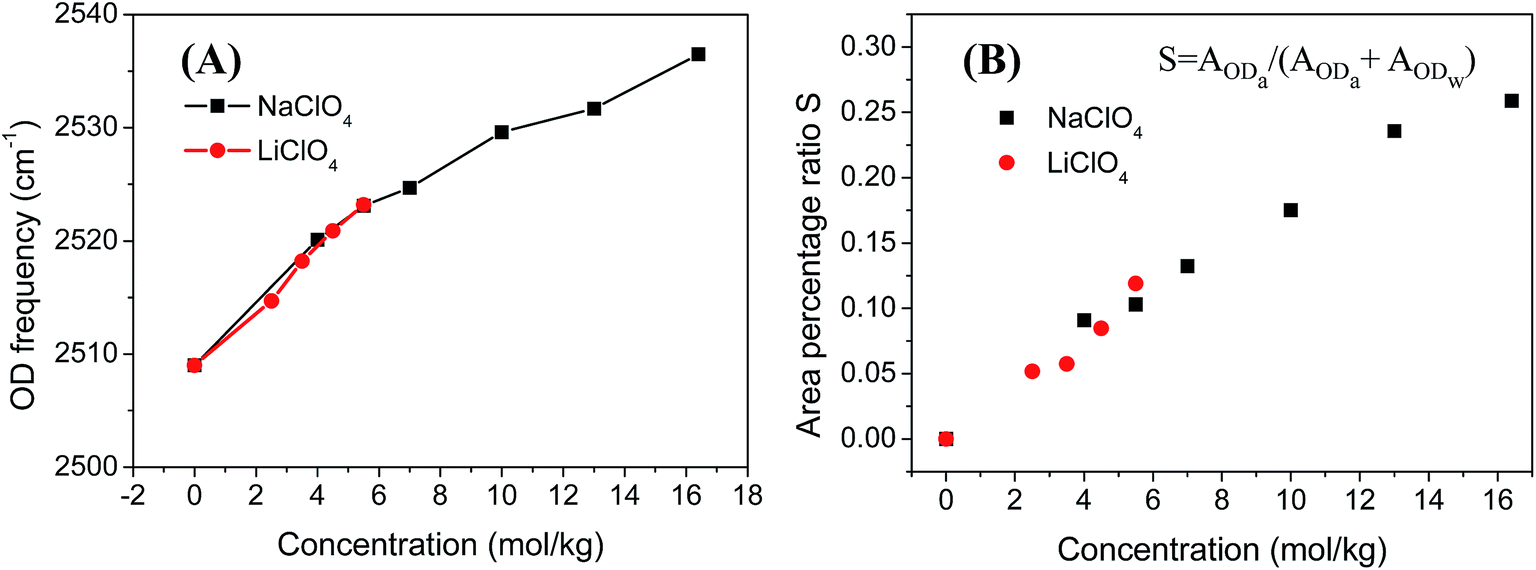 | ||
| Fig. 2 (A) Central frequencies of ODw stretch in NaClO4 and LiClO4 aqueous solutions. (B) The percentage of ODa species (S) in the NaClO4 and LiClO4 aqueous (2 wt% D2O in H2O) solutions of different concentrations. S is defined as S = AODa/(AODa + AODw) where AODa is the peak area of ODa stretch in NaClO4 and LiClO4 aqueous solutions and is obtained through the decomposition of FTIR spectra in Fig. 1 into two contributions fitted using two Gaussian peak functions. | ||
As we mentioned earlier, the new peak in the higher frequency positioned at around 2630 cm−1 is assigned to the ODa groups hydrogen bonded to the ClO4− anions. The central frequencies of ODa stretch remain unchanged with the increase of salt concentration in both NaClO4 and LiClO4 aqueous solutions, shown in Fig. 1. However, the peak amplitude of ODa stretch increase significantly as the salt concentrations increase. Here we define S = AODa/(AODa + AODw) where AODa is the peak area of ODa stretch in NaClO4 and LiClO4 aqueous solutions and is obtained through the curve fitting using two Gaussian functions. The results were shown in Fig. 2B. We can clearly see that the ratio S increases almost linearly as the salt concentrations increase and is independent on the nature of cations.
Similar phenomenon of peak splitting of OD stretch was also observed in the aqueous ionic solutions containing BF4− and PF6− and reported in previous literatures.25,48,49 The distinct peak splitting of OD stretch shown in Fig. 1 enables us to investigate the specific ion effects on the structure and dynamics of water molecules in electrolyte aqueous solutions which will be presented in following sections. Bakker et al. investigated the ion effect on the orientational dynamics of the bulk water molecules (ODw stretch) in NaClO4 aqueous solutions.50 Here, we will mainly focus on the study of ion effects on the orientational dynamics of water molecules (ODa stretch) hydrogen boned to ClO4− anion.
3.2. Cation (Li+, Na+) effects on the vibrational relaxation dynamics of water molecules
In the IR pump probe experiment, a narrow band (∼15 cm−1) IR pulse with high pump energy is used to excite the water molecules from the ground state (υ = 0) to the first excited states (υ = 1). Then the relaxation of the excited molecules is monitored by an independent and broadband probe pulse at different delay times. The two beams are generated from two independent OPAs and its frequency can be tuned independently which make it suitable for quantitative analysis of the vibrational relaxation dynamics data with weak signal.39 Fig. 3 shows a typical pump probe measurement of ODa stretch (υ = 0–1 transition) in 5.5 mol kg−1 (4.3mol L−1) LiClO4 aqueous solution. The decay of the pump probe signal is because of the vibrational population relaxation and orientational relaxation. These two contributions can be separated through the polarization dependent measurement which is extensively adopted in the IR pump probe measurement. Here the heat effect from the vibrational relaxation is very small and further heat removal procedure is not needed for the vibrational population decay analysis.40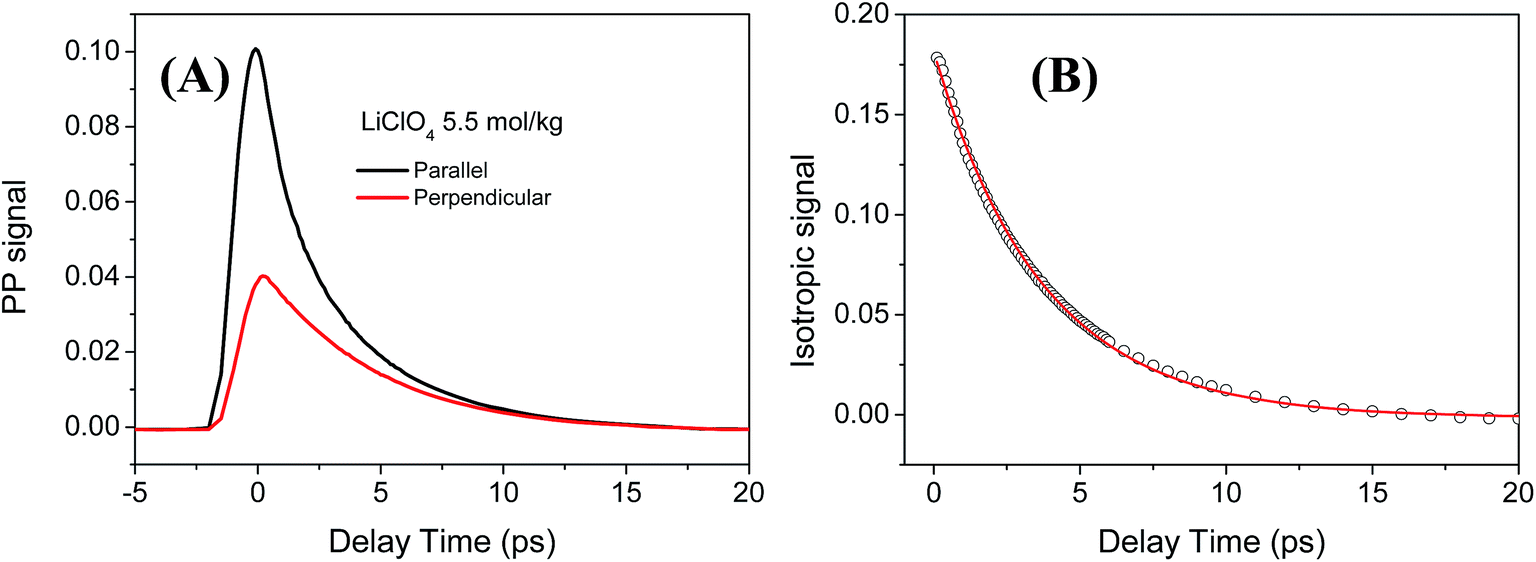 | ||
| Fig. 3 (A) The raw pump probe data of ODa stretch (υ = 0–1 transition) for 5.5 mol kg−1 LiClO4 aqueous solution under two different polarizations of polarized signal relative to the pump beam. The pump frequency and probe frequency were fixed at 2630 cm−1. (B) The isotropic (rotation free) signal Plife obtained from P∥ + 2 × P⊥ where the vibrational lifetime of OD stretch can be determined. The solid line is the fitting curve using a single exponential decay function. | ||
For the 5.5 mol kg−1 LiClO4 aqueous solution, the isotropic signal was fitted using a single exponential decay function: Plife(t) = A![[thin space (1/6-em)]](https://www.rsc.org/images/entities/char_2009.gif) exp(−t/T). The vibrational lifetime of ODa stretch from the υ = 0–1 transition (2630 cm−1) was determined to be T = 3.7 ± 0.1 ps, shown in Fig. 3B. For comparison, we also performed the polarization selective IR pump probe measurement for the OD stretch of HOD in the neat water solution. The vibrational lifetime of OD stretch in neat water solution was determined to be T = 1.7 ± 0.1 ps which agrees well with previous reports.51,52 Previous studies showed that OD stretch interacting with anions usually have a longer lifetime than OD in pure water.26,27,53–55 The slowing down of the vibrational relaxation of ODa stretch is explained by the weaker hydrogen bond interaction between water and anions which leads to a decrease of the anharmonic interaction between the OD stretch vibration and the hydrogen bond mode.33
exp(−t/T). The vibrational lifetime of ODa stretch from the υ = 0–1 transition (2630 cm−1) was determined to be T = 3.7 ± 0.1 ps, shown in Fig. 3B. For comparison, we also performed the polarization selective IR pump probe measurement for the OD stretch of HOD in the neat water solution. The vibrational lifetime of OD stretch in neat water solution was determined to be T = 1.7 ± 0.1 ps which agrees well with previous reports.51,52 Previous studies showed that OD stretch interacting with anions usually have a longer lifetime than OD in pure water.26,27,53–55 The slowing down of the vibrational relaxation of ODa stretch is explained by the weaker hydrogen bond interaction between water and anions which leads to a decrease of the anharmonic interaction between the OD stretch vibration and the hydrogen bond mode.33
The vibrational lifetime of ODa stretch in NaClO4 aqueous solutions with concentration at 5.5 mol kg−1 (4.3 mol L−1) and 16.4 mol kg−1 (8.6 mol L−1) were also studied in order to observe the specific cation (Li+ and Na+) effects on the vibrational population dynamics of water molecules. The results were shown in Fig. 4. The vibrational lifetime of the ODa stretch in 5.5 mol kg−1 NaClO4 was determined to be T = 3.8 ± 0.1 ps which is almost the same compared with the results obtained from 5.5 mol kg−1 LiClO4 solution considering the experimental uncertainty. In 16.4 mol kg−1 NaClO4 solution, the vibrational lifetime of ODa stretch was determined to be T = 6.3 ± 0.1 ps. The results here indicated that the vibrational lifetime of ODa is mainly affected by the anions in the aqueous solution, while the cation effects (Li+ and Na+) are negligible on the vibrational population decay of water molecules for the system studied here. Previous literature showed that the vibrational lifetimes of water molecules in a series of alkali halides solutions were observed having a small but significant dependence on the nature of the cation.33 However, due to the solubility of KClO4 and CsClO4 in water is less than 0.1 mol kg−1, we cannot perform more systematic measurement of the cation effect on the vibrational population decay of water molecule in ClO4− containing aqueous solutions.
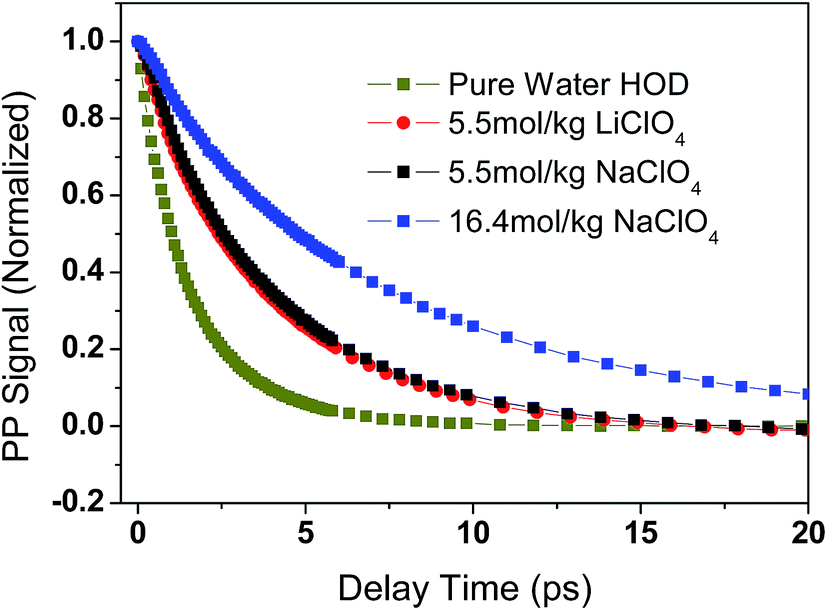 | ||
| Fig. 4 The vibrational population decay of OD groups that hydrogen-bonded to ClO4− ions in 5.5mol kg−1 LiClO4, 5.5 mol kg−1 NaClO4 and 16.4 mol kg−1 NaClO4 aqueous solutions with pump frequency at 2630 cm−1. All curves can be fitted using a single exponential decay function. The vibrational population decay of the OD of HOD in isotopically mixed water measured at 2509 cm−1 is also shown for comparison. | ||
3.3. Cation (Li+, Na+) effects on the rotational dynamics of water molecules
The orientational anisotropy of ODa in both LiClO4 and NaClO4 aqueous solutions were obtained and shown in Fig. 5. It is clear that the anisotropy curve does not decay all the way to zero. One of possible reason is that the vibrational lifetime of ODa stretch is too short to observe the anisotropy decay in a wider time delay window. We also measured the OD stretch rotational dynamics in isotopically mixed water which can be described by a single exponential decay with a time constant of 2.6 ± 0.2 ps. The result is consistent with previous reports,44,52,56 and is also plotted in Fig. 5. Interestingly, the anisotropy decay of OD stretch in neat isotopically mixed water can decay to zero even the data quality is not good compared with that in LiClO4 and NaClO4 solutions. The main reason is that OD stretch has a relatively short vibrational lifetime of 1.7 ± 0.1 ps in neat isotopically mixed water.52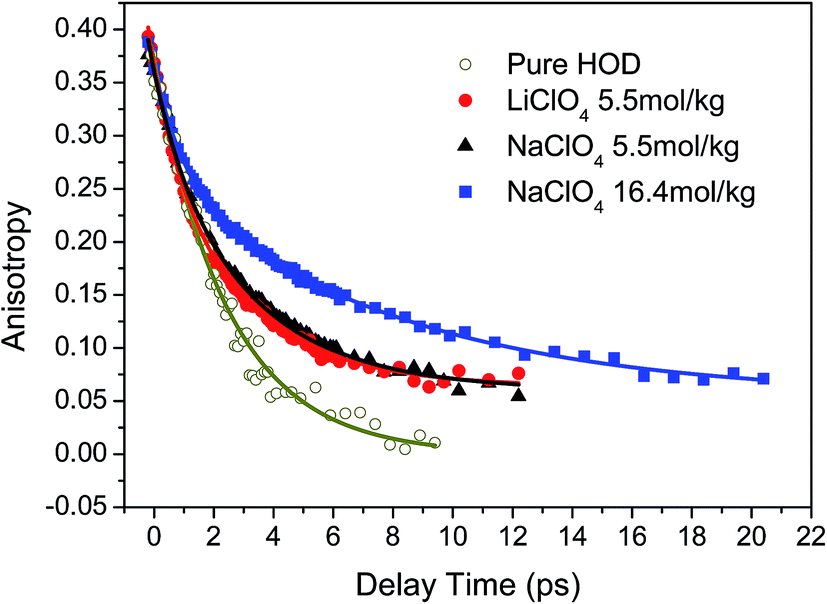 | ||
| Fig. 5 The anisotropy decay data of OD stretch in pure water (2 wt% D2O in H2O), 5.5 mol kg−1 LiClO4, 5.5 mol kg−1 and 16.4 mol kg−1 NaClO4. The solid lines are the fitting results. | ||
In 5.5 mol kg−1 LiClO4 and NaClO4 aqueous solutions, it is clear that the orientational anisotropy of ODa decays slowly than that of water molecules in isotopically mixed water. However, the anisotropy decay can not be described by a single exponential decay. As we discussed in Section 3.1, the water molecules that interacting with anions or other water molecules should have different rotation times. A bi-exponential decay with general function expressed as R(t) = b0 + b1exp(−t/τ1) + b2exp(−t/τ2) can fit the data very well. Here, the anisotropy decay is described by a fast (τ1) and slow (τ2) components. The fast component (τ1) is believed to correlate with the wiggling motion of the OD while keeping its hydrogen bond to the anion intact.34 The slow component is associated with the rotational diffusion of hydration shell water molecules on the anion surface. The constant term b0 is also given in the expression. In previous reports, the constant term b0 is fixed as zero or sometimes not mentioned in the data analysis, here we will discuss the constant term b0 which can greatly affect the rotational time constants.
Firstly, if we do not fix the constant term b0 to zero during the anisotropy decay fitting, the rotational time constant results are listed in Table 1. For 5.5 mol kg−1 LiClO4 solution, a bi-exponential decay give time constants of 0.9 ps (33%) and 3.2 ps (67%). At the same concentration of 5.5 mol kg−1, a bi-exponential decay give time constants of 1.0 ps (28%) and 3.3 ps (72%) in the NaClO4 solution. At higher ion concentration of 16.4 mol kg−1, the rotational time constants are 1.0 ps (32%) and 7.9 ps (68%) in the NaClO4 solution. The constant term b0 is determined to be 0.06 ± 0.01 for these three studied solutions. The physical origin of nonzero b0 is tentatively discussed and presented in the following section.
exp(−t/τ1) + b2exp(−t/τ2) under two different conditions with b0 = 0 and b0 ≠ 0. For pure water, the anisotropy decay of OD stretch was fit using a single exponential function: R(t) = b1exp(−t/τ1)
| Solution | b0 | b1 | τ1 (ps) | b2 | τ2 (ps) | |
|---|---|---|---|---|---|---|
| Pure water | 0 | 0.37 ± 0.02 | 2.6 ± 0.2 | |||
| Fitting case 1 | LiClO4 (5.5 mol kg−1) | 0.06 ± 0.01 | 0.11 ± 0.02 | 0.9 ± 0.1 | 0.22 ± 0.02 | 3.2 ± 0.3 |
| NaClO4 (5.5 mol kg−1) | 0.06 ± 0.01 | 0.09 ± 0.01 | 1.0 ± 0.1 | 0.23 ± 0.01 | 3.3 ± 0.3 | |
| NaClO4 (16.4 mol kg−1) | 0.05 ± 0.01 | 0.10 ± 0.01 | 1.0 ± 0.1 | 0.21 ± 0.01 | 8.2 ± 0.4 | |
| Fitting case 2 | LiClO4 (5.5 mol kg−1) | 0 | 0.18 ± 0.01 | 1.0 ± 0.1 | 0.21 ± 0.01 | 7.3 ± 0.3 |
| NaClO4 (5.5 mol kg−1) | 0 | 0.15 ± 0.01 | 1.0 ± 0.1 | 0.24 ± 0.01 | 7.0 ± 0.3 | |
| NaClO4 (16.4 mol kg−1) | 0 | 0.13 ± 0.01 | 1.0 ± 0.1 | 0.24 ± 0.01 | 13.8 ± 0.4 |
Secondly, if we set the constant term b0 to zero during the curve fitting, the anisotropy decay curve in Fig. 5 can still be fit very well and the rotational time constants are listed in Table 1. For 5.5 mol kg−1 LiClO4 solution, a bi-exponential decay give time constants of 1.0 ps (46%) and 7.3 ps (54%). The fast component remains the same, while the slow component is determined to be 7.3 ± 0.3 ps which is two times slower than the value of 3.2 ± 0.3 ps assuming the constant term b0 is not zero. For 5.5 mol kg−1 NaClO4 solution, a bi-exponential decay give time constants of 1.0 ps (38%) and 7.0 ps (62%). At the concentration of 16.4 mol kg−1, a bi-exponential decay give time constants of 1.0 ps (35%) and 13.8 ps (65%).
3.4. Correlations between rotational dynamics and viscosity in electrolyte aqueous solution
In the concentrated solutions, e.g., 5.5 mol kg−1 of NaClO4, where on average there is one cation or anion for every ten water molecules, there is certain amount of water molecules stay close to cation or anions in the confined environment. The anisotropy decay of water molecules in the confined environment should behave very different from the water molecules in bulk-like system and is not necessarily a single exponential. In our previous work, we showed that the rotational dynamics of the anions and water molecules behave in very different ways in concentrated MSCN (M = Li, Na, K, Cs) electrolyte aqueous solutions.44 The rotational dynamic segregation between SCN− and water molecules is because of structural inhomogeneity in the solutions. Furthermore, the rotational time constants of anions scaled linearly with the change of solution viscosity. However, the water dynamics were only slightly affected by the solution viscosity and depend on nature of the cation. At 5 mol kg−1, the OD rotational time constant (4.8 ps for a single exponential) in LiSCN solution is about 1.3 times that (3.7 ps) of the NaSCN solution. However, we showed there is relatively small cation effect on the rotational water dynamics in the LiClO4 and NaClO4 solutions.Fig. 6 displays the concentration-dependent viscosity of LiClO4 and NaClO4 aqueous solutions. It is clear that with the concentration lower than 5.5 mol kg−1, the viscosity is slightly changed with the increase of salt concentrations. At concentration of 5.5 mol kg−1, the viscosity increases about 24% for LiClO4 (nr = 1.24) and 21% for NaClO4 (nr = 1.21) aqueous solutions. Based on our discussion in previous section, if we do not fix the constant term b0 to zero during the anisotropy fitting, the rotational dynamics of water (τ2 = 3.2 ps) in 5.5 mol kg−1 LiClO4 slows about 23% which scales very well with the change of solution viscosity. For NaClO4 at the concentration of 5.5 mol kg−1, the rotational dynamics of water (τ2 = 3.3 ps) slows about 27% which also scales linearly with the change of solution viscosity within the experimental uncertainty. However, on the other hand, if we fix the constant term b0 to zero for the rotational anisotropy fitting of 5.5 mol kg−1 LiClO4, the rotational dynamics of water (τ2 = 7.3 ps) slows almost 3-fold which is obviously not supported by the viscosity measurement.
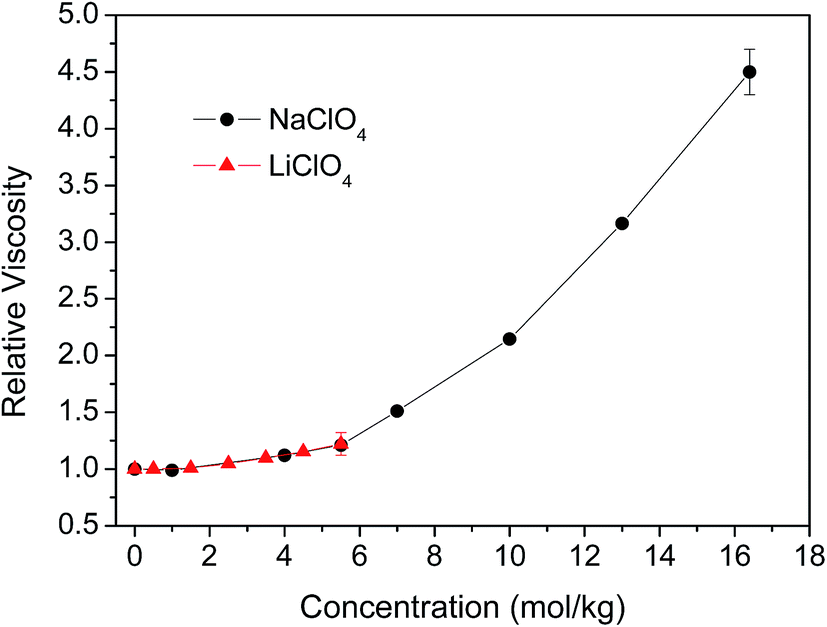 | ||
| Fig. 6 The concentration dependent relative viscosity in LiClO4 and NaClO4 aqueous solutions. | ||
The solubility of LiClO4 in water can only go up to 5.6 mol kg−1 (59.8 g per 100 g water at 25 °C), we cannot observe the water rotational dynamics at higher concentration in LiClO4 solution. For NaClO4, the saturated concentration is 17.1 mol kg−1 (209.6 g per 100 g water at 25 °C). The viscosity of a 16.4 mol kg−1 NaClO4 solution is 4.5 times that of pure water, shown in Fig. 6. However, the ODa rotational time constant (τ2 = 8.2 ps) is only about 3.2 times that of the pure water. The reason that water rotational dynamics does not follow the viscosity change at higher concentration is mainly because of the dynamic segregation of anions and water molecules from our previous studies.43,44 We surmise the ion clustering may also be formed in the LiClO4 and NaClO4 solutions. The nature of the dynamic segregation and the possible ion clustering in the LiClO4 and NaClO4 solutions warrants further investigation.
Our previous studies showed that cation can significantly affect the reorientational motions of water molecules in alkali thiocyanate aqueous solutions.44 The water dynamics are slower in a solution with a smaller cation due to the larger charge density (Li+ > Na+). However, we observed there is negligible cation effect on the water dynamics in the LiClO4 and NaClO4 aqueous solutions. Since the ODa groups that hydrogen bonded to ClO4− anions and ODw groups that hydrogen bonded to other water molecules have large frequency shift, which is different from the case in alkali thiocyanate solution system where the OD groups hydrogen bonded to SCN− and other water molecules are overlapped. Both Bakker and Gaffney investigated the rotational dynamics of water molecules hydrogen boned to ClO4− anions at the concentration of 6 M (about 9 mol kg−1 in molality) NaClO4 solution.29,34,50 They observed the slow rotational anisotropy of ODa decay with a time constant of 7.3 ± 0.6 ps. In their experiments, they used a broad band excitation pulse (FWHM ∼120 cm−1) in the IR pump probe setup.34 Both the water molecules hydrogen bonded to anions and to other water molecules can be excited at the same time which make the rotational water dynamics complicated. Here we use a narrowband IR pulse (FWHM ∼18 cm−1) which can selectively excite the ODa stretch and observe its rotational dynamics. Thus the cation effects (Li+, Na+) on the vibrational relaxation dynamics of water molecules in the hydration shell of ClO4− in NaClO4 and LiClO4 aqueous solutions can be clearly observed.
From the viscosity measurement, we think it is more appropriate to use the general expression R(t) = b0 + b1exp(−t/τ1) + b2exp(−t/τ2) to describe the rotational dynamics of water molecules in the NaClO4 and LiClO4 aqueous solutions. The physical meaning of nonzero b0 may indicate that rotational dynamics of water molecules that hydrogen bonded to anions is restricted and cannot decay to zero in the concentrated electrolyte aqueous solution. This phenomenon is similar to interfacial water dynamics measured in the confined water pool inside reverse micelle systems which were reported by Fayer and co-worker.21,53,54,56–59 However, the exact reason for the restricted rotational dynamics of water molecules hydrogen bonded to anions observed here is not clear yet and is subject to future experimental and theoretical studies.
4. Conclusion
In this report, we investigated the specific cation effects on the vibrational relaxation dynamics of water molecules in the hydration shell of ClO4− in NaClO4 and LiClO4 aqueous solutions using polarization selective IR pump probe experiment. The distinct peak splitting of OD stretch of HOD molecules in concentrated NaClO4 and LiClO4 in isotopically diluted water (2% D2O in H2O) enables us to investigate the specific cation effects on the dynamics of water molecules that hydrogen bonded to ClO4− in aqueous electrolyte solutions. The reorientation of the perchlorate-bound water molecules show a bi-exponential decay and the slow component reorientation time constant is sensitive to function used to fit the rotational anisotropy decay. We showed that rotational dynamics of water molecules that hydrogen bonded to anions is restricted and cannot decay to zero in the concentrated solution. The cation effects (Li+, Na+) on the vibrational relaxation dynamics of water molecules hydrogen bonded to ClO4− are relatively negligible even at concentration where the molar ratio between cation and water is 1:10. Due to the solubility of LiClO4 can only go up to 5.6 mol kg−1 in water solution, other ionic aqueous solution systems containing BF4− and PF6− will be investigated in the future.
Conflicts of interest
There are no conflicts to declare.Acknowledgements
HTB thanks fund support from the Shaanxi Normal University (No. 1110010767), Natural Science Foundation of China (NSFC, No. 21603137), and Fundamental Research Funds for the Central Universities (GK201701004).References
- R. Leberman and A. K. Soper, Nature, 1995, 378, 364 CrossRef CAS PubMed.
- B. Winter and M. Faubel, Chem. Rev., 2006, 106, 1176 CrossRef CAS PubMed.
- P. E. Mason, G. W. Neilson, C. E. Dempsey, A. C. Barnes and J. M. Cruickshank, Proc. Natl. Acad. Sci. U. S. A., 2003, 100, 4557 CrossRef CAS PubMed.
- J. D. Smith, R. J. Saykally and P. L. Geissler, J. Am. Chem. Soc., 2007, 129, 13847 CrossRef CAS PubMed.
- K. J. Tielrooij, N. Garcia-Araez, M. Bonn and H. J. Bakker, Science, 2010, 328, 1006 CrossRef CAS PubMed.
- D. A. Doyle, J. Morais Cabral, R. A. Pfuetzner, A. Kuo, J. M. Gulbis, S. L. Cohen, B. T. Chait and R. MacKinnon, Science, 1998, 280, 69 CrossRef CAS PubMed.
- H. J. Bakker and J. L. Skinner, Chem. Rev., 2010, 110, 1498 CrossRef CAS PubMed.
- C. D. Cappa, J. D. Smith, K. R. Wilson, B. M. Messer, M. K. Gilles, R. C. Cohen and R. J. Saykally, J. Phys. Chem. B, 2005, 109, 7046 CrossRef CAS PubMed.
- W. Kunz, Curr. Opin. Colloid Interface Sci., 2010, 15, 34 CrossRef CAS.
- F. Hofmeister, Arch. Exp. Pathol. Pharmakol., 1888, 24, 247 Search PubMed.
- Y. Marcus, Chem. Rev., 2009, 109, 1346 CrossRef CAS PubMed.
- K. D. Collins and M. W. Washabaugh, Q. Rev. Biophys., 1985, 18, 323 CrossRef CAS PubMed.
- M. G. Cacace, E. M. Landau and J. J. Ramsden, Q. Rev. Biophys., 1997, 30, 241 CrossRef CAS PubMed.
- Y. J. Zhang and P. S. Cremer, Curr. Opin. Chem. Biol., 2006, 10, 658 CrossRef CAS PubMed.
- Y. Zhang and P. S. Cremer, Annu. Rev. Phys. Chem., 2010, 61, 63 CrossRef CAS PubMed.
- R. W. Gurney, Ionic Processes in Solution, McGraw-Hill, New York, 1953 Search PubMed.
- A. W. Omta, M. F. Kropman, S. Woutersen and H. J. Bakker, Science, 2003, 301, 347 CrossRef CAS PubMed.
- F. Perakis, L. De Marco, A. Shalit, F. Tang, Z. R. Kann, T. D. Kuehne, R. Torre, M. Bonn and Y. Nagata, Chem. Rev., 2016, 116, 7590 CrossRef CAS PubMed.
- N. F. A. van der Vegt, K. Haldrup, S. Roke, J. Zheng, M. Lund and H. J. Bakker, Chem. Rev., 2016, 116, 7626 CrossRef CAS PubMed.
- M. D. Fayer, Annu. Rev. Phys. Chem., 2009, 60, 21 CrossRef CAS PubMed.
- M. D. Fayer, Acc. Chem. Res., 2012, 45, 3 CrossRef CAS PubMed.
- S. T. Roberts, K. Ramasesha and A. Tokmakoff, Acc. Chem. Res., 2009, 42, 1239 CrossRef CAS PubMed.
- A. W. Omta, M. F. Kropman, S. Woutersen and H. J. Bakker, J. Chem. Phys., 2003, 119, 12457 CrossRef CAS.
- M. D. Fayer, D. E. Moilanen, D. Wong, D. E. Rosenfeld, E. E. Fenn and S. Park, Acc. Chem. Res., 2009, 42, 1210 CrossRef CAS PubMed.
- D. E. Moilanen, D. Wong, D. E. Rosenfeld, E. E. Fenn and M. D. Fayer, Proc. Natl. Acad. Sci. U. S. A., 2009, 106, 375 CrossRef CAS PubMed.
- S. Park and M. D. Fayer, Proc. Natl. Acad. Sci. U. S. A., 2007, 104, 16731 CrossRef CAS PubMed.
- S. Park, D. E. Moilanen and M. D. Fayer, J. Phys. Chem. B, 2008, 112, 5279 CrossRef CAS PubMed.
- M. Ji, M. Odelius and K. J. Gaffney, Science, 2010, 328, 1003 CrossRef CAS PubMed.
- S. Park, M. Odelius and K. J. Gaffney, J. Phys. Chem. B, 2009, 113, 7825 CrossRef CAS PubMed.
- D. Laage and J. T. Hynes, Proc. Natl. Acad. Sci. U. S. A., 2007, 104, 11167 CrossRef CAS PubMed.
- D. Laage, G. Stirnemann, F. Sterpone and J. T. Hynes, Acc. Chem. Res., 2012, 45, 53 CrossRef CAS PubMed.
- D. Laage and J. T. Hynes, Science, 2006, 311, 832 CrossRef CAS PubMed.
- M. F. Kropman and H. J. Bakker, J. Am. Chem. Soc., 2004, 126, 9135 CrossRef CAS PubMed.
- S. T. van der Post and H. J. Bakker, Phys. Chem. Chem. Phys., 2012, 14, 6280 RSC.
- Z. R. Kann and J. L. Skinner, J. Chem. Phys., 2016, 144, 234501 CrossRef CAS PubMed.
- K. J. Tielrooij, S. T. van der Post, J. Hunger, M. Bonn and H. J. Bakker, J. Phys. Chem. B, 2011, 115, 12638 CrossRef CAS PubMed.
- A. A. Chen and R. V. Pappu, J. Phys. Chem. B, 2007, 111, 6469 CrossRef CAS PubMed.
- S. A. Hassan, J. Phys. Chem. B, 2008, 112, 10573 CrossRef CAS PubMed.
- H. Bian, J. Li, X. Wen and J. Zheng, J. Chem. Phys., 2010, 132, 184505 CrossRef.
- H. Bian, X. Wen, J. Li and J. Zheng, J. Chem. Phys., 2010, 133, 034505 CrossRef PubMed.
- H. Bian, H. Chen, J. Li, X. Wen and J. Zheng, J. Phys. Chem. A, 2011, 115, 11657 CrossRef CAS PubMed.
- H. Bian, X. Wen, J. Li, H. Chen, S. Han, X. Sun, J. Song, W. Zhuang and J. Zheng, Proc. Natl. Acad. Sci. U. S. A., 2011, 108, 4737 CrossRef CAS.
- H. Bian, J. Li, Q. Zhang, H. Chen, W. Zhuang, Y. Q. Gao and J. Zheng, J. Phys. Chem. B, 2012, 116, 14426 CrossRef CAS PubMed.
- H. Bian, H. Chen, Q. Zhang, J. Li, X. Wen, W. Zhuang and J. Zheng, J. Phys. Chem. B, 2013, 117, 7972 CrossRef CAS PubMed.
- H. Chen, H. Bian, J. Li, X. Wen and J. Zheng, Int. Rev. Phys. Chem., 2012, 31, 469 CrossRef CAS.
- J. Stangret and T. Gampe, J. Phys. Chem. A, 2002, 106, 5393 CrossRef CAS.
- P. A. Bergstrom, J. Lindgren and O. Kristiansson, J. Phys. Chem., 1991, 95, 8575 CrossRef.
- D. Nam, C. Lee and S. Park, Phys. Chem. Chem. Phys., 2014, 16, 21747 RSC.
- C. Lee, D. Nam and S. Park, New J. Chem., 2015, 39, 3520 RSC.
- H. J. Bakker, M. F. Kropman, A. W. Omta and S. Woutersen, Phys. Scr., 2004, 69, C14 CrossRef CAS.
- M. Ji and K. J. Gaffney, J. Chem. Phys., 2011, 134, 044516 CrossRef PubMed.
- Y. L. A. Rezus and H. J. Bakker, J. Chem. Phys., 2005, 123, 114502 CrossRef CAS PubMed.
- D. E. Moilanen, E. E. Fenn, D. Wong and M. D. Fayer, J. Chem. Phys., 2009, 131, 014704 CrossRef PubMed.
- D. E. Moilanen, E. E. Fenn, D. Wong and M. D. Fayer, J. Phys. Chem. B, 2009, 113, 8560 CrossRef CAS PubMed.
- C. H. Giammanco, D. B. Wong and M. D. Fayer, J. Phys. Chem. B, 2012, 116, 13781 CrossRef CAS PubMed.
- I. R. Piletic, D. E. Moilanen, D. B. Spry, N. E. Levinger and M. D. Fayer, J. Phys. Chem. A, 2006, 110, 4985 CrossRef CAS PubMed.
- E. E. Fenn, D. B. Wong and M. D. Fayer, Proc. Natl. Acad. Sci. U. S. A., 2009, 106, 15243 CrossRef CAS PubMed.
- M. D. Fayer and N. E. Levinger, Annu. Rev. Phys. Chem., 2010, 3, 89 CrossRef CAS PubMed.
- R. Yuan, C. Yan, J. Nishida and M. D. Fayer, J. Phys. Chem. B, 2017, 121, 4530 CrossRef CAS PubMed.
| This journal is © The Royal Society of Chemistry 2017 |