 Open Access Article
Theoretical calculation and experiment study on the electronic structure, microstructures and photocatalytic activity of N–Al codoped TiO2†
Dandan Wang,
Yongjie Zheng *,
Jingzhi Tian,
Tao Jing*,
Wei Kan and
Yi Hu
College of Chemistry and Chemical Engineering, Qiqihar University, Qiqihar, Heilongjiang 161006, China. E-mail: zyj1964@163.com; jtkr@163.com
First published on 9th November 2017
Abstract
To more accurately demonstrate how the electronic structure was changed by codoping TiO2 with N–Al and to explain the origin of the enhanced photocatalytic activity by N–Al-codoped TiO2, we investigated the electronic structures and microstructures of N monodoped, Al monodoped, and N–Al codoped anatase TiO2 by theoretical calculation and experiments. It was found that N monodoping and Al monodoping could effectively narrow the band gap. The effect was doubled when TiO2 was codoped with N and Al because the emergence of the N 2p state made the VBM move to a higher energy level and the emergence of the Al 3p state made the CBM move to a lower energy level in the system. Moreover, codoping of N and Al into TiO2 did not change the microstructures of TiO2 catalysts although it was proven that both N and Al atoms were codoped into TiO2. N and Al-codoped TiO2 displayed a higher crystallinity and a higher specific surface area than others. According to the results about the degradation rate and the dynamics of the catalysts, N–Al–TiO2 exhibited the best photocatalytic activity; this suggested that N and Al were combined to enhance the photocatalytic activity of TiO2.
1. Introduction
TiO2 is a photocatalyst that can be used for decomposing pollutants with benefits of low-cost, non-toxic, high chemical stability, and high oxidative power.1,2 However, TiO2 can only show high photocatalytic activity under ultraviolet light;3 this leads to a poor utilization of solar energy. Therefore, the commercialization of TiO2 is limited greatly.4 Several methods, including substitutions with transition, precious, and rare earth metals, have been used to overcome the drawbacks.5,6 However, these methods are still not as good as expected because either the costs of the metals are high or their resources are scarce. Thus, it is necessary to seek some cheaper and accessible metal elements to be doped into TiO2 to improve the photocatalytic activity under visible light.7,8In recent years, it has been proven that the optical absorption of TiO2 can be increased using a dopant, including a nonmetal and metal. Meng et al.9 pointed out that TiO2 codoped with N and a transition metal could display photocatalytic activity under visible light. Additionally, they explored the correlation between the electronic structure and the optical properties using the density functional theory (DFT).
Several studies indicated that the photocatalytic activity was increased under visible light by doping TiO2 with some metal atoms such as Fe, Er, and Al. Especially, Al atom can substitute Ti atom because their ionic radii are similar. Additionally, many studies have shown that the spectra of TiO2 doped with an appropriate amount of Al could exhibit a red-shift in the UV-visible absorption bands,10,11 and Al–TiO2 displayed a good UV absorption capability. Moreover, the photocatalytic activity of Al–TiO2 was higher than that of pure TiO2.10 Liu et al.12 prepared an Al-doped TiO2 thin film by a hydrothermal method; after doping, the photovoltaic efficiency of TiO2 increased up to 6.48%, which was 1.1% higher as compared to that of the pure TiO2 thin film.
Besides metal doping, the nonmetal and metal codoping have also been investigated extensively. Some studies indicate that N codoping with some metals can considerately change the band gap of TiO2;13–15 thus, its photocatalytic activity is improved significantly under visible light. In particular, the codoped anatase TiO2 plays a pivotal role in the light absorption process. Therefore, it is important to investigate how N–Al codoping TiO2 affects the photocatalytic activity.
Generalized gradient approximation (GGA) or local density approximation (LDA) is the routine method used for studying the electronic properties of the doped anatase titania based on the DFT and have achieved great success in many compounds. However, they failed while dealing with some systems associated with a strong cross-linking relationship between inner molecules (such as transition metal oxides). Moreover, the value of the band gap obtained by the theoretical calculations is much lower than the experimental value.16 The reason is that the system should be insulated, but actually, it is not.17,18 Therefore, it is necessary to figure out how to reduce the difference and make the study of the electronic structures of the doped TiO2 more accurate. The Hubbard model is an effective correction method for GGA19 and has been applied successfully in the strongly correlated systems. However, the model is still not accurate enough to predict the band gap of transition metal oxides, such as TiO2, because of the natural errors generated from the self-interaction. Liu et al.20 calculated the band gap of anatase TiO2 using this method, and the value they obtained was about 2.12 eV. However, the experimental value was 3.22 eV. It is clear that the value calculated based on GGA is much smaller than that obtained from experiments.
To improve the photocatalytic activity of TiO2 under visible light, in this study, electronic structures were calculated systematically by the GGA + U method for N–Al codoped TiO2, and then, several computational models were constructed to explain the changes in the electronic structures by comparing pure TiO2 with the doped TiO2. We also synthesized anatase TiO2, N–TiO2, Al–TiO2, and N–Al–TiO2 by a sol–gel method and further explored the root causes for the enhancement of the photocatalytic activity under visible light.
2. Computational details and method
2.1 Materials
Tetrabutyl titanate, aluminum sulfate, ethyl alcohol, glacial acetic acid, dilute nitric acid, urea, and methyl orange (MO) were obtained from Tianjin Commie Chemical Reagent Co. Ltd. Water used herein was secondary deionized water.2.2 Establishment of the doping system model
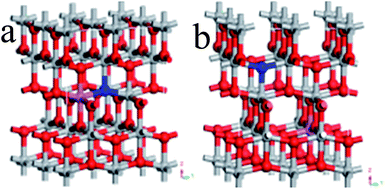
Ultrasoft pseudopotentials of the first-principle calculation were applied in this research. On the basis of the GGA, PBE parameterization was used to show the interdependency potentials and the exchange. A relaxed 2 × 2 × 1 anatase supercell was constructed from the doped systems, which contained 16 titanium and 32 oxygen atoms. The supercell was very successful in the investigation of TiO2 doped with various elements.21,22In the N–Al codoped TiO2 model, we compared two configurations (see Fig. 1): (1) a N replaced O at the O site and an Al substituted the neighbor Ti at the Ti site (see Fig. 1(a)) and (2) similarly, a N replaced O at the O site and an Al substituted Ti at the Ti site; however, N and Al were far away from each other (see Fig. 1(b)). According to the total energy obtained from the geometry optimization, it was concluded that the first configuration was more stable than the second configuration. Therefore, we chose the former as the model. In this study, the configurations of the valence electron of various atoms were involved, which were O (2s22p4), Ti (3d24s2), N (2s22p3), and Al (3s23p1). By setting the cut-off energy at 380 eV, the wave functions of the valence electron were expanded by a series of plane wave pseudopotentials. The geometry optimization and the calculation of the electronic structures were achieved via the Monkhorst–Pack scheme with a 3 × 3 × 3 K-point grid sampling. When the residual force of the whole atoms was lower than 0.01 eV Å−1, all the atoms were absolutely loosed.
2.3 Synthesis of N–Al codoped TiO2
The N–Al codoped TiO2 was prepared using the sol–gel method.23–25 The solution A was prepared by adding tetrabutyl titanate (10.0 mL) to absolute ethanol (40.0 mL) dropwise under stirring. The solution B was prepared by dissolving various amounts of urea and aluminum sulfate octadecahydrate in a solution of water (10.0 mL), absolute ethanol (30.0 mL), and glacial acetic acid (4.0 mL) at pH 3.0. The solution B was added drop by drop to the solution A under stirring until the mixed solution formed the sol, and then, it was moved to the reaction kettle to form the gel for 48 h. The N–Al codoped TiO2 catalyst was fabricated by filteration, drying, and calcination.2.4 Photocatalytic activity evaluation
The photocatalytic experiments were carried out using a photocatalytic reaction apparatus with a xenon lamp as a simulated daylight source. The photocatalytic activity of the catalyst was evaluated by the degradation rate of the photocatalytic degradation of methyl orange. Briefly, the catalyst (0.1 g) and 50 mL of the methyl orange (MO) solution were mixed, sonicated for 10 min, placed in the photocatalytic reaction instrument, and stirred for 30 min to reach the adsorption equilibrium (avoiding light). Then, the samples were obtained every 30 min and centrifuged, and the absorbance was measured. According to the Lambert–Beer law, the degradation rate of MO was calculated as follows:| η = (A0 − At)/A0 × 100% |
2.5 Characterizations
The morphology of the catalysts was observed by scanning electron microscopy (SEM) and transmission electron microscopy (TEM). The crystals of the catalysts were determined by X-ray diffraction (XRD). The elementary compositions were analyzed by X-ray photoelectron spectroscopy (XPS). The band gaps of the catalysts were calculated based on the UV-vis diffuse reflectance spectra (UV-vis DRS). The specific surface areas were measured by N2 adsorption–desorption isotherms.3. Results and discussion
3.1 Determination of Hubbard parameter (Ueff)
The GGA + U method was applied to depict the optimal band gap produced by the d and f electron systems and the interaction between the intra-atomic electrons. Moreover, the Hubbard parameter (Ueff) was appropriately determined by the GGA + U calculations.26As shown in Table 1, the band gap was narrowed along with a decrease of Hubbard (Ueff) for pure TiO2. By this approach, the optimum Ueff of Ti 3d was calculated for pure TiO2, and it was 8.30 eV. Based on Ueff, the band gap of 3.204 eV was obtained, which was consistent with the experimental value (3.2 eV).27
| Ueff/eV | 8.50 | 8.47 (ref. 28) | 8.40 | 8.35 | 8.30 | 8.25 | 0 |
| Eg eV | 3.256 | 3.249 | 3.230 | 3.217 | 3.204 | 3.190 | 2.1 |
3.2 Electronic structures
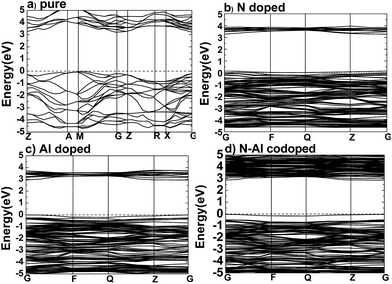
After the optimum Ueff was determined, the band structures were calculated for pure anatase TiO2, TiO2 doped with N, TiO2 doped with Al, and anatase TiO2 codoped with N–Al, and the results are shown in Fig. 2.According to the previous study, the lattice parameters obtained by the experiments were a = b = 3.782 Å, and c = 9.502 Å for anatase TiO2.29–32 Based on the method used herein, the values calculated by the supercell (2 × 2 × 1) were a = b = 3.791, and c = 9.750 Å. As expected, the theoretical values are very close to the practical values; this proved that the supercell we designed was successful for experiments. As shown in Fig. 2(a), the band structures were calculated for pure anatase TiO2, where the minimum value of the conduction band (CBM) and the maximum value of the valence band (VBM) were the gamma (G) point and M → G region, respectively. These results imply that pure anatase TiO2 is an indirect band gap semiconductor. It also means that as compared to the standard GGA or LDA methods, the GGA + U method can provide a more accurate prediction on the band gap.
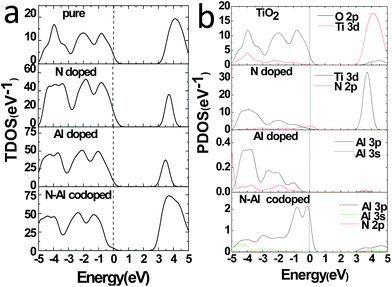
Moreover, to obtain the origins of the electronic structures of TiO2 doped with different elements, we calculated the partial density of the states (PDOS) and the total density of the states (TDOS) for anatase TiO2, and the results are shown in Fig. 3(a) and (b). Moreover, we analyzed their electronic characteristics through the calculations with anatase TiO2. As shown in Fig. 3, based on the valence band (VB), the state of O 2p of pure TiO2 would be dominant, and it was hybridized with the orbit of Ti 3d. On the other hand, according to the conduction band (CB), the state of Ti 3d would be dominant. These results are consistent with the previous studies.33–35 The electronic structure of TiO2 doped with N is shown in Fig. 2(b), where the O atom is replaced by a N atom. The VBM increased to 0.0679 eV, and the CBM remained almost unchanged. The band gap was narrowed to 3.1361 eV for the N monodoped TiO2. The doping led to the formation of impurity bands in the forbidden gap nearby the Fermi level. As shown in Fig. 3, the upward shift of the VBM was caused by the emergence of the N 2p state as compared to that of the pure TiO2; this explained how the band gap could become narrower. Combining all results together (Fig. 3 and 2), we proposed that the VBM and the CBM were dominant due to the Ti 3d state in N doped TiO2.36 As shown in Fig. 2(c), the VBM in Al-doped TiO2 remained unchanged, but the CBM had a decrease of 0.2589 eV as compared to that of pure TiO2. Thus, the calculated band gap was 2.945 eV. After the substitution of Ti with Al atom (Fig. 3), a part of the Al 3s and Al 3p states appeared above the Fermi level, which constructed as the CBM of the system. The downward shift of the bottom conduction band was caused by the emergence of the Al 3s and Al 3p states, which led to the band gap narrowing.37 For N–Al codoped anatase TiO2, the result of the calculation for the electronic structure is displayed in Fig. 2(d). It was found that the CBM of the codoped system decreased by 0.3277 eV as compared to that of pure TiO2. In contrast, the VBM was only decreased by 0.03171 eV. Noticeably, the band gap of N–Al codoped TiO2 was determined by both the VBM and the CBM, and the final value for the band gap was 2.908 eV, which was 0.296 eV lower than that obtained in pure anatase TiO2. This indicates that the band gap was much narrower than that induced by Al monodoping or N monodoping, or the pure TiO2.
Additionally, it was found that some of the N 2p states appeared above the Fermi level and became a component of the CBM, as shown in Fig. 3. Because of the combined effects of the N 2p, Al 3s, and Al 3p states, a more obvious downward shift of the bottom conduction band was observed and resulted in the narrower band gap.
3.3 The microstructure and composition of the catalysts
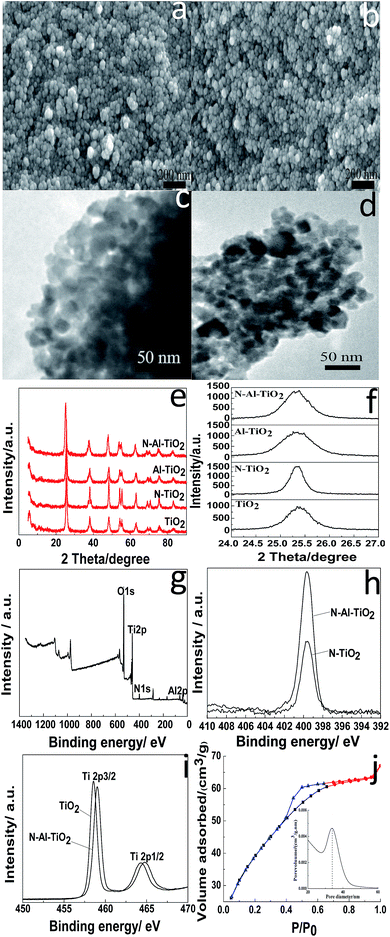
SEM, TEM, and XRD were used to determine the microstructures of the catalysts. The morphologies of pure TiO2 and N–Al–TiO2 are shown in Fig. 4(a) and (b), respectively. It was clear that the particles were uniform and well-dispersed. Upon comparing Fig. 4(a) with Fig. 4(b), it can be seen that the morphology of the catalyst codoped with N and Al elements is not changed significantly. The TEM images of pure TiO2 and N–Al–TiO2 (Fig. 4(c) and (d)) further confirmed the morphologies, which were consistent with those revealed by SEM. The phase structures of pure TiO2, N–TiO2, Al–TiO2, and N–Al–TiO2 were studied by XRD, and the results are shown in Fig. 4(e) and (f). The 2θ peaks of pure TiO2 were at 25.3°, 38.1°, 48.42°, 54.22°, and 63.08°. Thus, according to the JCPDS card, no. 73-1764, the crystal form of TiO2 was mainly the anatase type. Similarly, after pure TiO2 was doped, the crystal forms did not show any significant changes. This was consistent with the crystal form of the catalysts achieved from the theoretical calculation. The (101) diffraction peak was used as a reference, and the crystallinities and crystal plane distance of (101)38,39 were calculated, as shown in Table 2. Compared to pure TiO2, N–Al–TiO2 displayed a higher crystallinity, which could be a beneficial to improve the photocatalytic activity of the catalyst. According to the Fig. 4(e) and Table 2, the crystal plane distances of (101) for pure TiO2, N–TiO2, Al–TiO2, and N–Al–TiO2 were different; this indicated that N and Al atoms were doped into the pure TiO2 lattice.| a The crystallinity of anatase TiO2 was calculated using the (101) peak of anatase TiO2 as a reference. | |||
|---|---|---|---|
| Samples | TiO2 | Al–TiO2 | N–Al–TiO2 |
| Peaks of (101) (degree) | 25.34 | 25.30 | 25.31 |
| Crystal plane distance of (101) (nm) | 0.35122 | 0.35174 | 0.35161 |
| Crystallinitya | 1.00 | 1.57 | 1.68 |
| Theoretical band gap (eV) | 3.204 | 2.945 | 2.908 |
| Experimental band gap (eV) | 3.105 | 2.786 | 2.713 |
| Specific surface area (m2 g−1) | 59.22 | 95.76 | 127.5 |
| Pore volume (cm3 g−1) | 0.0893 | 0.1259 | 0.1603 |
| Average pore diameter (nm) | 60.30 | 52.61 | 50.26 |
| The first-order rate (min−1) | 0.00061 | 0.00132 | 0.00447 |
The chemical composition of the N–Al–TiO2 catalyst was investigated by XPS. Fig. 4(g) shows the XPS survey spectrum of N–Al–TiO2, in which the binding energy peaks of O 1s, Ti 2p, N 1s, and Al 2p are located at 530.08 eV, 458.31 eV, 399.73 eV, and 73.9 eV, respectively. According to Fig. 4(h), the peak at 399.33 eV could be ascribed to the binding energy of N 1s in N–TiO2. The peak position of N 1s in N–TiO2 was the same as the position of N 1s in N–Al–TiO2, but with largely different intensities. The intensity of the peak of the N–Al–TiO2 catalyst nearly doubled that of the peak of N–TiO2; this might be attributed to Al doped in TiO2. In Fig. 4(i), the binding energies of Ti 2p3/2 and Ti 2p1/2 of pure TiO2 were observed at 458.1 eV and 463.7 eV, respectively, which indicated that the Ti4+ species existed in the form of TiO2. In addition, compared to that of pure TiO2, the binding energy of Ti 2p in N–Al–TiO2 shifted to the right because N and Al were codoped to form the impurity energy levels; this facilitated the transition of electrons and resulted in a lower density of the Ti electron cloud and increase of binding energy. These results are consistent with the theoretical calculations (Fig. 2 and 3).
3.4 N2 adsorption–desorption and UV-vis diffuse reflectance spectra
The surface physicochemical property of the N–Al–TiO2 catalyst was characterized by N2 adsorption–desorption isotherms, as shown in Fig. 4(j). Based on the IUPAC rules, the N–Al–TiO2 catalyst displayed type IV pattern curve, which implied the existence of the mesoporous structure. The results from BET analysis are shown in Table 2. It was obvious that the specific surface area of N–Al–TiO2 was higher than that of the others, which increased the contact area with the reactants. Thus, it is beneficial for the improvement of the photocatalytic activity of the composite material.To study the changes in the band gap caused by the doping elements, the analysis with a UV-vis diffuse reflectance spectra was carried out, and the results are shown in Fig. 5(a) and (b). Compared to pure TiO2, N monodoped and Al monodoped TiO2 showed a blue-shift; however, the N–Al codoped TiO2 showed a slight red-shift. To further study the nature of the transition and the band gap of the composite materials, the following equation40 was used: (ahv)n = K(hv − Eg), where a is the absorption coefficient, hv is the absorption energy, n is 1/2 for a direct transition, K is the parameter that is related to the effective masses associated with the valence and conduction bands, and Eg is the band gap energy (see Table 2). The band gaps obtained were 3.105, 2.849, 2.786, and 2.713 eV for pure TiO2, N–TiO2, Al–TiO2, and N–Al–TiO2, respectively. The band gaps obtained by the theoretical calculation and those obtained by the experiments exhibited some differences; however, the difference was small, and the reduction tendency was the same. Thus, the N–Al–TiO2 catalyst can absorb the lower energy photons and generate more photogenerated electron–hole pairs, which can involve in the photocatalytic reaction and can improve the photocatalytic activities of the catalyst.
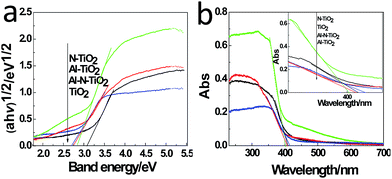 | ||
| Fig. 5 (a) UV-vis diffuse reflectance spectra and (b) plots of (ahv)1/2 versus energy (hv) of the samples. | ||
3.5 Photocatalytic activities of the catalysts
The photocatalytic activities of pure TiO2, N–TiO2, Al–TiO2, and N–Al–TiO2 were studied by degrading the methyl orange (MO) solution under a simulated visible light irradiation. The results are shown in Fig. 6(a) and (b). According to the results shown in Fig. 6(a), it was obvious that the N–Al codoped TiO2 catalyst exhibited the best effect on the degradation of the methyl orange solution, and the degradation rate was 5 times higher than that of pure TiO2. Fig. 6(b) shows the kinetics of the photocatalytic degradation of MO for pure TiO2, N–TiO2, Al–TiO2, and N–Al–TiO2. The first-order rate (constant k) for N–Al–TiO2 was significantly higher than that for the other catalysts. It is clearly observed that N–Al–TiO2 exhibits the best photocatalytic performance. The photocatalytic results indicate that codoping of N and Al into TiO2 can effectively enhance the photocatalytic activities of TiO2.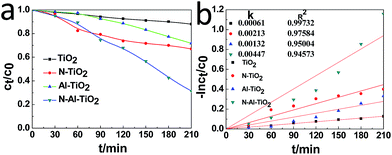 | ||
| Fig. 6 (a) Photocatalytic degradation of MO by different catalysts and (b) the kinetics of the photocatalytic degradation of MO by them under the simulated visible light irradiation. | ||
4. Conclusions
In this study, the GGA + U method was used to calculate the electronic structures of pure TiO2, N monodoped, Al monodoped, and N–Al codoped TiO2. An appropriate Hubbard parameter (Ueff) of 8.30 eV was obtained and used to determine the band gap. Compared to N monodoped and Al monodoped, N–Al codoped TiO2 could make the band gap narrower due to the emergence of the state of N 2p that led to an upward shift of the VBM and the emergence of the Al 3p state that gave rise to a downward shift of the CBM. Additionally, the electronic transition occurs from the valence band to the impurity level in N–Al codoped TiO2, which is more beneficial to the absorption of visible light. Moreover, the experimental studies were performed to characterize the microstructures, elemental composition, and photocatalytic activities of the catalysts prepared by the sol–gel method. It is found that although N and Al atoms are successfully codoped into TiO2, the morphologies and the crystal forms of the catalysts remain unchanged. Importantly, N–Al codoped TiO2 has a higher crystallinity and a higher specific surface area, which are beneficial to improve the photocatalytic activity of the sample. Among all the prepared catalysts, N–Al codoped TiO2 shows the best photocatalytic activity. We propose that the band gap narrowing can be the root cause for the enhancement of the photocatalytic activity due to the introduction of the of N 2p and Al 3p states into N–Al codoped TiO2 under visible light.Conflicts of interest
There are no conflicts to declare.Acknowledgements
We would like to express our gratitude to all those who helped us during the writing of this paper. Special thanks to our friends who have put considerable time and effort into the comments on the draft. This work was supported by the Natural Science Foundation of Heilongjiang Province, China (No. B201422).Notes and references
- A. Mills and S. Le Hunte, J. Photochem. Photobiol., A, 1997, 108, 1–35 CrossRef CAS.
- X. An, Y. Wen, A. Almujil, D. Cheng, J. Li, X. Jia, J. Zou and Y. Ni, RSC Adv., 2016, 6, 89457–89466 RSC.
- M. R. Hoffmann, S. T. Martin, W. Choi and D. W. Bahnemann, Chem. Rev., 1995, 95, 69–96 CrossRef CAS.
- L. Jing, Y. Cao, H. Cui, J. R. Durrant, J. Tang, D. Liu and H. Fu, Chem. Commun., 2012, 48, 10775–10777 RSC.
- S. Y. Liu and Q. G. Feng, Adv. Mater. Res., 2011, 148, 1208–1211 Search PubMed.
- S. Steinberg, M. Valldor and G. Meyer, J. Solid State Chem., 2013, 206, 176–181 CrossRef CAS.
- W. Chen, T. Ye, H. Xu, T. Chen, N. Geng and X. Gao, RSC Adv., 2017, 7, 9880–9887 RSC.
- J. Hu, Y. Cao, K. Wang and D. Jia, RSC Adv., 2017, 7, 11827–11833 RSC.
- Q. Meng, T. Wang, E. Liu, X. Ma, Q. Ge and J. Gong, Phys. Chem. Chem. Phys., 2013, 15, 9549–9561 RSC.
- S. Liu, G. Liu and Q. Feng, J. Porous Mater., 2010, 17, 197–206 CrossRef CAS.
- L. Schlur, S. Begin-Colin, P. Gilliot, M. Gallart, G. Carré, S. Zafeiratos, N. Keller, V. Keller, P. André and J. M. Greneche, Mater. Sci. Eng., C, 2014, 38, 11–19 CrossRef CAS PubMed.
- Q. P. Liu, H. J. Huang, Y. Zhou, Y. D. Duan, Q. W. Sun and Y. Lin, Acta Phys.-Chim. Sin., 2012, 28, 591–595 CAS.
- Y. Fang, D. Cheng and W. Wu, Comput. Mater. Sci., 2014, 85, 264–268 CrossRef CAS.
- S. Y. Yang, L. F. Yao and H. Chen, Adv. Mater. Res., 2014, 963, 529–533 CrossRef.
- G. Wu, S. Zheng, P. Wu, J. Su and L. Liu, Solid State Commun., 2013, 163, 7–10 CrossRef CAS.
- C. Stampfl and C. Van de Walle, Phys. Rev. B: Condens. Matter Mater. Phys., 1999, 59, 5521 CrossRef CAS.
- S. Biermann, F. Aryasetiawan and A. Georges, Phys. Rev. Lett., 2003, 90, 086402 CrossRef CAS PubMed.
- K. Terakura, T. Oguchi, A. Williams and J. Kübler, Phys. Rev. B: Condens. Matter Mater. Phys., 1984, 30, 4734 CrossRef CAS.
- S. Dudarev, G. Botton, S. Savrasov, C. Humphreys and A. Sutton, Phys. Rev. B: Condens. Matter Mater. Phys., 1998, 57, 1505 CrossRef CAS.
- G. Liu, L. C. Yin, J. Wang, P. Niu, C. Zhen, Y. Xie and H. M. Cheng, Energy Environ. Sci., 2012, 5, 9603–9610 CAS.
- W. J. Yin, H. Tang, S. H. Wei, M. M. Al-Jassim, J. Turner and Y. Yan, Phys. Rev. B: Condens. Matter Mater. Phys., 2010, 82, 045106 CrossRef.
- W. J. Yin, S. H. Wei, M. M. Al-Jassim and Y. Yan, Phys. Rev. Lett., 2011, 106, 066801 CrossRef PubMed.
- B. Yuzer, M. Guida, F. Ciner, B. Aktan, M. I. Aydin, S. Meric and H. Selcuk, Desalin. Water Treat., 2016, 57, 4966–4973 CrossRef CAS.
- V. Caratto, F. Locardi, S. Alberti, S. Villa, E. Sanguineti, A. Martinelli, T. Balbi, L. Canesi and M. Ferretti, J. Sol-Gel Sci. Technol., 2016, 80, 152–159 CrossRef CAS.
- C. B. Marien, C. Marchal, A. Koch, D. Robert and P. Drogui, Environ. Sci. Pollut. Res., 2017, 24, 12582–12588 CrossRef CAS PubMed.
- X. Li, H. Gao and G. Liu, Comput. Theor. Chem., 2013, 1025, 30–34 CrossRef CAS.
- J. K. Burdett, T. Hughbanks, G. J. Miller, J. W. Richardson Jr and J. V. Smith, J. Am. Chem. Soc., 1987, 109, 3639–3646 CrossRef CAS.
- H. C. Wu, Y. S. Lin and S. W. Lin, Int. J. Photoenergy, 2013, 2013, 1–7 Search PubMed.
- A. A. Murashkina, P. D. Murzin, A. V. Rudakova, V. K. Ryabchuk, A. V. Emeline and D. W. Bahnemann, J. Phys. Chem. C, 2015, 119, 24695–24703 CAS.
- X. J. Zhang, G. F. Zhang, H. X. Jin, L. D. Zhu and Q. J. Liu, Acta Phys. Sin., 2013, 62, 017102 Search PubMed.
- Z. Y. Zhang, P. D. Han, C. L. Zhang, X. Zhang, X. L. Sun and Y. P. Li, Acta Phys.-Chim. Sin., 2012, 28, 324–330 CAS.
- T. J. Giese and D. M. York, J. Chem. Phys., 2010, 133, 244107 CrossRef PubMed.
- Y. Gai, J. Li, S. S. Li, J. B. Xia and S. H. Wei, Phys. Rev. Lett., 2009, 102, 036402 CrossRef PubMed.
- R. Long and N. J. English, Chem. Mater., 2010, 22, 1616–1623 CrossRef CAS.
- H. Pan, Y. W. Zhang, V. B. Shenoy and H. Gao, J. Phys. Chem. C, 2011, 115, 12224–12231 CAS.
- E. Escamilla-Roa, V. Timon and A. Hernandez-Laguna, Comput. Theor. Chem., 2012, 981, 59–67 CrossRef CAS.
- C. Lee and C. M. Aikens, Comput. Theor. Chem., 2013, 1013, 32–45 CrossRef CAS.
- J. Zhang, L. Qian, W. Fu, J. H. Xi and Z. G. Ji, J. Am. Ceram. Soc., 2014, 97, 2615–2622 CrossRef CAS.
- J. Zhang, J. Xi and Z. Ji, J. Mater. Chem., 2012, 22, 17700–17708 RSC.
- B. Jiang, X. L. Yang, X. Li, D. Q. Zhang, Z. Jian and G. S. Li, J. Sol-Gel Sci. Technol., 2013, 66, 504–511 CrossRef CAS.
Footnote |
| † Electronic supplementary information (ESI) available: Addition SEM of N–TiO2 and Al–TiO2, and XPS survey spectrum of catalytics. See DOI: 10.1039/c7ra07815c |
| This journal is © The Royal Society of Chemistry 2017 |

