 Open Access Article
Creative Commons Attribution 3.0 Unported Licence
Layer-by-layer assembled membranes with immobilized porins†
Sebastián Hernández a,
Cassandra Portera,
Xinyi Zhangb,
Yinan Weib and
Dibakar Bhattacharyya
 *a
*a
aDepartment of Chemical and Materials Engineering, University of Kentucky, 177 F. Paul Anderson Tower, Lexington, KY 40506-0046, USA. E-mail: db@uky.edu
bDepartment of Chemistry, University of Kentucky, Lexington, KY, USA
First published on 13th December 2017
Abstract
New and advanced opportunities are arising for the synthesis and functionalization of membranes with selective separation, reactivity, and stimuli-responsive behavior. One such advancement is the integration of bio-based channels in membrane technologies. By a layer-by-layer (LbL) assembly of polyelectrolytes, outer membrane protein F trimers (OmpF) or “porins” from Escherichia coli with central pores ∼2 nm in diameter at their opening and ∼0.7 × 1.1 nm at their constricted region are immobilized within the pores of poly(vinylidene fluoride) microfiltration membranes, in contrast to traditional ruptured lipid bilayer or vesicle processes. These OmpF-membranes demonstrate selective rejection of non-charged organics over ionic solutes, allowing the passage of up to 2 times more salts than traditional nanofiltration membranes starting with rejections of 84% for 0.4 to 1.0 kDa organics. The presence of charged groups in OmpF-membranes also leads to pH-dependent salt rejection through Donnan exclusion. These OmpF-membranes also show exceptional durability and stability, delivering consistent and constant permeability and recovery for over 160 h of operation. Characterization of the solutions containing OmpF and the membranes was conducted during each stage of the process, including detection by fluorescence labelling (FITC), zeta potential, pH responsiveness, flux changes, and rejection of organic–inorganic solutions.
1. Introduction
Nature offers elegant separation processes with high selectivity, resistance to fouling, and regenerative capabilities. Research progress inspired by these separation processes has been extensive in recent years, largely involving the development of new isolation processes of biomolecules that render unique functionalities and their incorporation in engineered materials.1–3 Furthermore, recent approaches in the synthesis of bioinspired structures, such as amphiphilic block copolymers, imidazole-quartet channels, triarylamines, carbon nanotubes and graphene oxide, have improved separation performance and versatility.4–8 Processes involving polymers and bioinspired membranes have been developed for applications such as water purification and ion transport, recovery of valuable products, sensors and drug delivery.9–13 Membranes provide selective barriers that allow certain molecules to pass through them based on charge and/or size restrictions; they also provide an opportunity for chemical separation that requires less energy than more common thermal separation processes.9,14Membranes may also act as a platform to immobilize other useful materials in pores. Functionalized membranes that are responsive to various stimuli, such as temperature, pH, and electric fields, are promising for even more unique applications.15,16 For porous membranes, typical functionalization methods involve grafting or cross-linking of stimuli-responsive functional polymers inside the membrane pores. This responsiveness enables reversible changes in selectivity and permeation across the membrane in response to environmental factors, such as pH, which can deprotonate functional polymers and enable them to absorb water while decreasing the pore diameter and permeability of the membrane.17–20 The functional groups in the polymer enable the assembly of other layers with alternating charge polyelectrolyte groups via layer-by-layer (LbL) assembly.16,21–24 Additionally, the responsive functionality of LbL can be exploited by tethering diverse biofunctional groups, such as enzymes, peptides and, in our case, porins.2,22,23
Porins are passive transmembrane pores consisting of cylindrical β-barrel proteins with pores passing through the middle of their structures.4 Some porins are monomers, while others, including outer membrane protein F (OmpF) from Gram-negative Escherichia coli, form trimers. Therefore, incorporating porins into these synthetic LbL-assembled membranes can potentially increase rejection and selectivity due to a combination of electrostatic responsiveness and steric effects while attaining greater water permeability compared to conventional and charged ultrafiltration (UF) membranes.25,26
The incorporation of OmpF porins into membranes poses additional advantages for several reasons. OmpF has been shown to have slight selectivity for cations over anions, although it functions principally as a non-specific port; also, studies of cations and anions flowing through OmpF showed that these ions follow different pathways through the pore without interference.27–33 However, OmpF has shown enhanced transport of organic molecules when the molecules are charged.33–35 This characteristic has mostly been used to increase drug permeability through the cell membrane; however, it can be applied to highly specific purification of valuable molecules by adding a charge to them and selectively separating them using porins. Gross physiochemical properties such as size and charge of the solute rather than specific molecular shape and atomic composition dictate the species that OmpF rejects.32 With an hourglass shape ∼2 nm in diameter at its opening and ∼0.7 × 1.1 nm at its most constricted region (eyelet), the monomeric pores of OmpF should readily reject charge-neutral molecules around this size (around 650 Da); this includes sucrose, which has a hydrated diameter of approximately 1.0 nm.33,36,37 Furthermore, both in vivo and in vitro studies have revealed the pH responsive behavior of OmpF, suggesting changes in pore size at a pKa of 7.2.38–42 The inherent stimuli-responsiveness of OmpF, including sensitivity to magnetic fields, may be useful for channel alignment and can be applied in simultaneous biofilm cleaning and separation of molecules with various sizes.43 Permeability through the central channel in a porin depends on the size and charge of the molecule. For example, small metabolites can be transported through porins, but large polysaccharides cannot. To use porins in the construction of artificial membranes, the incorporated proteins must be protected from denaturation. LbL-assembly may be a good method for the incorporation of proteins without covalent attachment. This technique has shown a 25-fold increase of immobilized biomolecules with insignificant distortion of the biomolecules.22
To date, studies on OmpF porins have been conducted with either the entire E. coli cell in vivo, with OmpF isolated and immobilized within a block-copolymer, or with OmpF self-assembled into lipid vesicles deposited on porous supports or ruptured into planar layers.11,24,44,45 Vesicles and ruptured vesicle planes have proven to be defective and unstable under high pressure. Membranes with vesicles containing aquaporins have shown poor rejection of inorganic salts; only one research group has achieved 98% rejection.45 This poor rejection can be attributed to defects in the bilayers because the vesicles are not cross-linked together and the aquaporins may not be aligned. Even with perfect block-copolymers or lipid bilayers, protein stability is still a major concern.9 Immobilizing biomolecules within previously existing membrane pores and then crosslinking the charged residues of these molecules may increase their mechanical stability and longevity.
The present study quantifies the immobilization of OmpF porins using LbL assembly functionalization within the pores of poly(vinylidene fluoride) (PVDF) membranes. Specific objectives include: (1) to determine whether LbL immobilization of OmpF enhances salt passage while rejecting solutes such as sucrose (1 nm size), and (2) to evaluate the stability of the OmpF-functionalized membranes through the rejection of various solutions containing different organic solutes and salts. The membranes were analyzed during each stage of the process, including comparisons between LbL membranes with and without OmpF. The characterization methods include Zeta (ζ) potential, pH responsiveness, fluorescence and changes in permeability. The characterization of the purified OmpF solutions for immobilization includes their feed and permeate concentrations and their ζ potentials. The effects of pH on permeability and salt rejection were also studied. This new approach involving the incorporation of a native protein into an artificial polymer membrane may lead to more active and functional separation methods.
2. Experimental
2.1. Materials for OmpF extraction and characterization
E. coli BL21 (DE3) (NEB, USA); valeric acid (99%); Coomassie blue R-250, ammonium persulfate (APS) (Sigma-Aldrich, USA); sodium dodecyl sulfate (SDS), polyacrylamide, Tris–HCl, N,N,N′,N'-tetramethylethylenediamine (TEMED), HEPES, dimethylformamide (DMF), (Bioworld, USA); ethanol (95%), acetic acid (glacial) (VWR, USA); protein marker, bicinchoninic acid (BCA) assay Pierce™ BCA Protein Assay Kit (Thermofisher Scientific, USA); and fluorescein isothiocyanate (FITC) (Thermofisher Scientific, USA) were used.2.2. Materials for synthesis of LbL membrane with OmpF
Acrylic acid (AA), 98% extra pure and stabilized, N,N′-methylenebisacrylamide (MBA), for electrophoresis, 99+% (ACROS ORGANICS, France and Belgium, respectively); potassium persulfate (KPS) (EM SCIENCE, Germany); poly(allylamine hydrochloride) (PAH) (ALDRICH, Japan); poly(styrene sulfonic acid) (PSS), MW 75![[thin space (1/6-em)]](https://www.rsc.org/images/entities/char_2009.gif) 000, 30% w/v aq. sol. (Alfa Aesar, USA); purified OmpF from E. coli; commercial scale membranes of poly(vinylidene fluoride) (PVDF) (PV200, PV700 and XPVDF, produced in collaboration with Nanostone Water, Inc., USA); and track-etched 50 nm polycarbonate membranes (PC50) (Whatman-Tisch Scientific, USA) were used.
000, 30% w/v aq. sol. (Alfa Aesar, USA); purified OmpF from E. coli; commercial scale membranes of poly(vinylidene fluoride) (PVDF) (PV200, PV700 and XPVDF, produced in collaboration with Nanostone Water, Inc., USA); and track-etched 50 nm polycarbonate membranes (PC50) (Whatman-Tisch Scientific, USA) were used.
2.3. OmpF solution purification and characterization
Normally, membrane protein purification consists of several steps: cell culture, cell lysis, membrane protein extraction, and purification through chromatography.46–48 Studies have shown that porin trimers are stable in detergents and organic solvents due to hydrogen bonding and electrostatic and hydrophobic interactions between the subunits.49 Thus, a method to rapidly extract membrane proteins was developed to largely improve the efficiency of the purification process for OmpF. Other methods of OmpF solution characterization are depicted in the ESI, Section 1.† The procedure used was a modified version of that reported by Arcidiacono et al.50 This method uses a single-step extraction, which not only saves time and effort but also provides active protein, as depicted in Fig. 1. E. coli BL21 (DE3) were cultured in LB medium overnight. Harvested cells were centrifuged at 8000 rpm for 10 min, then frozen at −80 °C and lyophilized (Labconco Freezone 12). The lyophilized cells were ground to powder; then, 2 mL of valeric acid were added per gram of powder, followed by 3-fold addition of deionized water to obtain a concentration of 2.3 M valeric acid. The mixture was stirred at room temperature for 1 hour. Finally, the mixture was clarified by centrifugation at 20![[thin space (1/6-em)]](https://www.rsc.org/images/entities/char_2009.gif) 000 g for 30 min. This valeric acid solution acts as a dispersant detergent containing an alkyl group to protect the protein from denaturation and aggregation. The product obtained through this method contains highly pure OmpF.50 Previous studies used this method to purify OmpF and OmpC to obtain functional proteins for use in a lipid bilayer membrane and as an immune system antigen, respectively.51,52
000 g for 30 min. This valeric acid solution acts as a dispersant detergent containing an alkyl group to protect the protein from denaturation and aggregation. The product obtained through this method contains highly pure OmpF.50 Previous studies used this method to purify OmpF and OmpC to obtain functional proteins for use in a lipid bilayer membrane and as an immune system antigen, respectively.51,52
The purity of the OmpF isolated by valeric acid was examined through sodium dodecyl sulfate polyacrylamide gel electrophoresis (SDS-PAGE). The sample was diluted with 2% SDS five times and then boiled in a water bath for 5 min before loading into a 20% polyacrylamide gel (20% polyacrylamide, 0.4 M Tris–HCl pH 8.8, 0.1% SDS, 0.1% ammonium persulfate, and 0.1% TEMED). The sample was run in SDS buffer (0.3% w/v Tris base, 1.44% w/v glycine, and 0.1% w/v SDS) at 200 V for one hour. The protein was stained with 0.1% Coomassie blue R-250 in 50% ethanol and 10% acetic acid for 15 min and destained with 10% acetic acid and 20% ethanol for one hour. An enhanced BCA assay was chosen to quantify the OmpF concentration for each of the samples due to its non-destructive approach. This enhanced protocol has a working range between 5 and 250 μg mL−1. The feed, permeate, and retentate were quantified by the material balance in each of the membranes with the enhanced BCA method.
For fluorescence labeling, valeric acid containing purified OmpF was diluted twofold with HEPES buffer (50 mM HEPES, 0.2 M NaCl, pH 7.5); then, the pH of the solution was adjusted to ∼8.0. FITC was dissolved in DMF and then added to the mixture to a final concentration of 0.1 mg mL−1. The mixture was incubated in the dark at room temperature for 2 hours. After the labeling reaction, 100 mM Tris (pH 8.0) was added to the mixture and incubated for 20 min to quench the free FITC. OmpF was labeled with an additional amount of FITC. Free FITC was removed by centrifugation, retaining the labeled protein and allowing small molecules to pass through. To determine the labeling efficiency, which has a molecular weight cut-off of 10 kDa, the difference between the FITC concentration before and after filtration and the concentration of OmpF were calculated. The ratio of OmpF![[thin space (1/6-em)]](https://www.rsc.org/images/entities/char_2009.gif) :
:![[thin space (1/6-em)]](https://www.rsc.org/images/entities/char_2009.gif) FITC was 1
FITC was 1![[thin space (1/6-em)]](https://www.rsc.org/images/entities/char_2009.gif) :
:![[thin space (1/6-em)]](https://www.rsc.org/images/entities/char_2009.gif) 3, which represents a labeling efficiency of one trimer with 3 FITC molecules.
3, which represents a labeling efficiency of one trimer with 3 FITC molecules.
2.4. Membrane characterization and layer-by-layer functionalization
Samples of PVDF and PC50 membranes were characterized with a scanning electron microscope (SEM) (Hitachi S-4300). The pore sizes were measured based on previous studies using ImageJ and SAS software for statistical analysis.53 OmpF was then immobilized within the PVDF membranes after two layers were assembled. First, a layer of PAA hydrogel was synthesized in situ by free radical polymerization of PAA hydrogel according to previously developed methods.53–55 Second, a solution of PAH was accumulated by convective flow using a dead-end batch cell (Sterlitech HP4750). The PAH solution was prepared with 0.2 M NaCl solution and a two-fold molar excess of PAH with respect to the immobilized PAA. The pH of the PAH solution was adjusted to ∼9.0 using NaOH to deprotonate the PAA in order to bond the amine groups of PAH to the COO− groups of PAA and form a long poly-alkyl double chain that would protect the hydrophobic centers of the OmpF barrels.A top layer of PSS permeated the membrane after the immobilization of OmpF and was used to stabilize the protein in the membrane, crosslinking the OmpF extracellular loops and bonding them via the remaining charges on the PAH layer. PSS was also permeated through a non-OmpF membrane on top of a PAH layer for comparison. 25 mL of deionized ultra-filtered water (DIUF) containing PSS repeating units equal to the quantity of COOH groups on the membrane were prepared. The solution was passed twice at 10.2 bar and pH 6.0. The slightly acidic pH provided positive charges on the extracellular loops of OmpF, endowing them with affinity for the carboxylic groups in PSS. Fig. 2 presents the entire LbL assembly to OmpF immobilization process. The functionalized membranes were also characterized with SEM; in the case of the fluorescence-labeled OmpF membranes, a confocal microscope was employed (Zeiss LSM880 Multiphotom Microscope). Detailed descriptions of the functionalization methods used are provided in Section 2 of the ESI.†
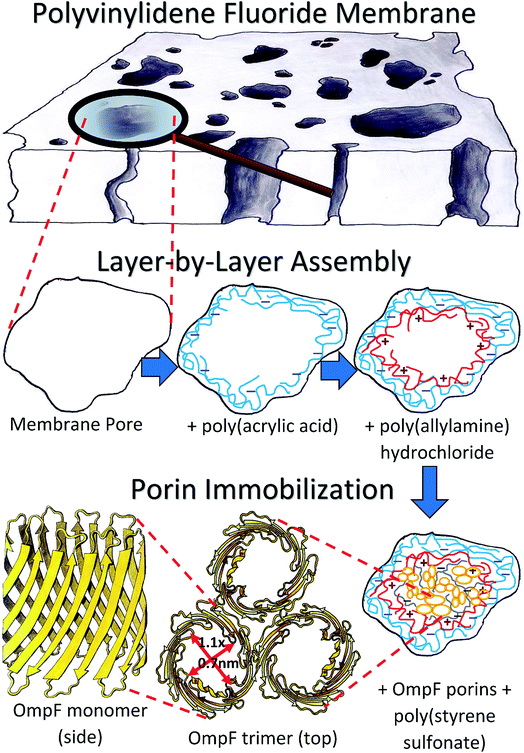 | ||
| Fig. 2 Schematic of the layer-by-layer assembly process of polyelectrolytes into a PVDF membrane and subsequent immobilization of OmpF. | ||
2.5. Immobilization of OmpF in the LbL assembled membrane
The OmpF solution was sonicated to reduce association and permeated twice through the PVDF–PAA–PAH membrane at 6.8 bar for 5 hours and at 9.5 bar for 5.5 hours. The original frozen OmpF solution (2.3 M valeric acid) containing 51 μg mL−1 protein was thawed to room temperature and filtered through a cellulose membrane syringe filter with an average pore diameter of 200 nm to remove any remaining cell debris. Before diluting it with water, 5 mL of additional valeric acid were added to the purified OmpF solution to prevent excessive association. 93 mL of DIUF water were added to obtain a total volume of 100 mL. The pH was increased to 5.5 with the addition of NaOH to improve the miscibility of valeric acid in water and the detergency, as observed through the increased clarity of the solution. The BCA assay and fluorescence measurements (Varian Cary Eclipse Fluorescence Spectrophotometer) were carried out for material balance purposes.2.6. Flux rejection and selectivity studies
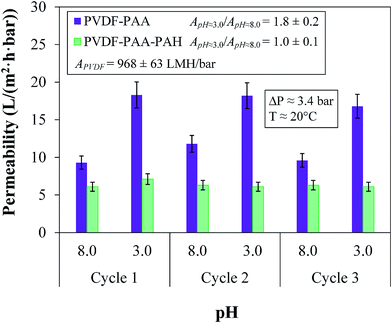
The permeation of different solutions was tested in a dead-end batch cell at 3.4 bar with DIUF at pH 7.0 to exceed the pKa of the functional polymers. ζ potential values (Anton-Paar Surpass Electrokinetic Analyzer) were determined to quantify changes in surface charge; see Section 3 of the ESI† for more details. Depending on the functional groups present on the membrane surface, the ζ potential varied significantly; thus, this method could be used to verify the proper functionalization of each layer. Another verification technique for the layers involved changing the pH of the water from 8 to 3 for both PVDF–PAA and PVDF–PAA–PAH. The different pH solutions were allowed to pass until the flux reached a steady state. Between each pass, the membrane was washed with DIUF water for 30 min to ensure that ions were removed before the next pass at a different pH value. Each pH sample was fluxed three times (cycles) to ensure the stability of the layers.The functionalized membrane was tested throughout for its rejection of salts and uncharged (organic) molecules as well as for the passage of pure water through each layer. Testing the rejection of uncharged molecules gives an indication of the rejection capabilities of a membrane based solely on size and thus indicates the size of the pores. At 3.4 bar, mixture solutions containing one uncharged molecule (glucose, sucrose, polyethylene glycol (PEG) 400 or PEG 1000) and one salt (NaCl or CaCl2) were passed through the membrane after each layer of assembly to demonstrate selectivity. The passes were conducted at pH 6.0 in DIUF water to avoid the effects of additional ions. Membranes containing OmpF should significantly reject molecules around the size of sucrose and larger while allowing the permeation of small ions. The aforementioned solutes plus Dextran Blue 5000 and Dextran 41000 mixture solutions were used in rejection cycles with the OmpF membrane; see Table 1. Here, one cycle consisted of passing all six model organic solutes, with DIUF permeation through the membrane between each cycle. Three cycles were performed to provide consistent results between rejection and stability. The solutions were permeated through the membrane for an average of 8 h per day over three weeks. Due to the previously reported functionality of OmpF at varying pH values, rejection and flux were also measured in the pH range between 3.0 and 10.0 and compared to the pH functionality of the non-OmpF membrane.
| Molecule | Molecular weight (Da) | rH (nm) | Ionic radius (nm) | Reference |
|---|---|---|---|---|
| a Mean of rH referenced values.b Calculated rH by curve fitting of referenced values.c Hydrated radii. | ||||
| Na+ | 23.0 | 0.36c | 0.095 | 58 and 59 |
| Ca2+ | 40.1 | 0.41c | 0.099 | |
| Cl− | 35.5 | 0.33c | 0.181 | 59 |
| Glucosea | 180.2 | 0.37 | — | 60–65 |
| Sucrosea | 342.3 | 0.46 | — | 60–63, 65 and 66 |
| PEG 400b | 400 | 0.65 | — | 60, 67 and 68 |
| PEG 1000b | 1000 | 0.93 | — | |
| Dextran blue 5000b | 5000 | 1.87 | — | 66 and 69–71 |
Dextran 41![[thin space (1/6-em)]](https://www.rsc.org/images/entities/char_2009.gif) 000b 000b |
41![[thin space (1/6-em)]](https://www.rsc.org/images/entities/char_2009.gif) 000 000 |
4.60 | — | |
A total organic carbon analyzer (TOC) (TOC-5000A, Shimadzu) was used to measure the feed, permeate, and retentate concentrations of the model organic solutions used; see Section 4 of the ESI† for details. Salt rejection was measured with a conductivity probe (Fisher Scientific Traceable Bench Conductivity Meter) and an inductively coupled plasma mass spectrometer (ICP-OES) (Varian Vista-PRO).
As a control method, track-etched polycarbonate membranes (PC50) were used to investigate the necessity of LbL assembly for OmpF immobilization and to determine if OmpF dissociated under shear stress. PC50 provides pores of consistent size (75 ± 1 nm) and has effectively no surface charge to cause OmpF grafting. The OmpF solution used had a pH value of 5.5 and contained 0.0352 M valeric acid. This OmpF solution was permeated through PC50 at 3.4 bar, and feed, permeate, and retentate samples were collected to calculate the OmpF loading.
3. Results and discussion
3.1. Characterization of OmpF
Purified OmpF was analyzed using SDS-PAGE (Fig. 3). Lane 1 is the protein marker and Lane 2 is the purified OmpF. The single band between 35 and 40 kDa is OmpF monomer, which has a molecular weight of 38.9 kDa. A diluted solution of valeric acid (0.035 M at pH 5.5) was used to gradually pass extracted OmpF through the functionalized membranes. pH 5.5 was chosen because valeric acid is miscible in water at this pH, and the slightly acidic pH achieves the desired charges of residues on the OmpF extracellular loops.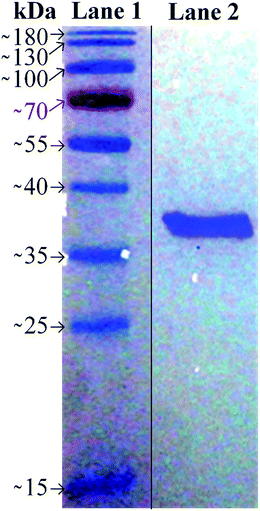 | ||
| Fig. 3 SDS-PAGE of OmpF extracted using valeric acid. Lane 1 is the protein marker, and Lane 2 is the purified OmpF obtained. | ||
3.2. Membrane characterization
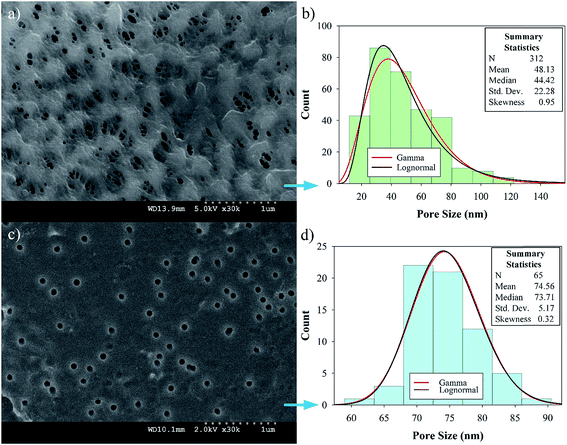
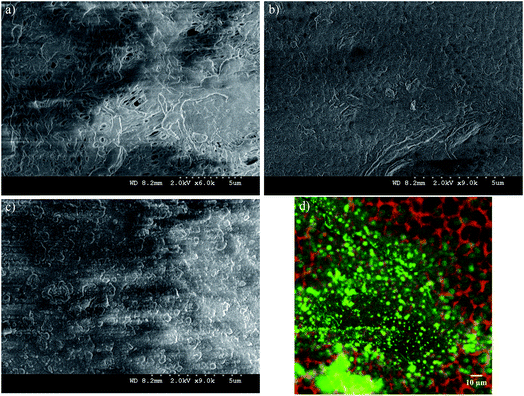
Preliminary studies to select a suitable PVDF membrane were performed and are discussed in Section 5 of the ESI.† The selected PVDF membrane is shown in Fig. 4a (PV200 from Table S1†); the SEM image shows a fairly porous, intricate surface with different pore shapes and sizes with an upper limit of 140 nm (Fig. 4b). The test for the alternative PV700 membrane shows larger pores; see Section 5 of the ESI, Fig. S1.† On the other hand, PC50 has more uniform pores, as expected. Histograms of the size distributions for both PVDF and PC50 (Fig. 4b and d) reveal average pore diameters of 48 ± 1 nm and 75 ± 1 nm, respectively. For PVDF, the pore size distribution was well fitted with both lognormal and gamma distributions, with the latter being more adjusted. With α = 0.05, the Kolmogorov–Smirnov parameter was D = 0.046, with a probability P = 0.051 for lognormal and D = 0.038, P > 0.25 for gamma functions. PVDF provides pores that are large enough for polyelectrolyte LbL-assembled layers and the subsequent addition of OmpF without complete collapse. For PC50, the median pore diameter is 74 nm, which is closer to its mean value than that of PVDF. The skewness was low for the gamma and lognormal distribution models and the standard deviation was small, suggesting highly consistent pores and more normal goodness-of-fit distribution parameters with α = 0.05 (D = 0.085, P = 0.170 for lognormal and D = 0.082, P = 0.209 for gamma).After each polymer layer was assembled, images of the membranes were taken with the SEM and confocal microscope; the latter was used only for the fluorescence (FITC)-labeled OmpF membranes. As shown in Fig. 6a, the PAA layer decreased the porosity extensively; however, some larger pores can be seen. Non-OmpF membranes with all layers (PAA to PSS) show almost no porous structure and some polymer aggregates on the surface (Fig. 6c); this differs from the OmpF membrane, shown in Fig. 6b. The OmpF membranes still show some open spaces (higher porosity) with less polymer agglomeration, evidencing a different arrangement of the layers that can increase the permeability of these membranes, as discussed below. The labeled OmpF membranes in Fig. 6d show that OmpF is distributed uniformly on the porous structure of the membrane, both on the surface and in its depth: confocal images show the presence of fluorescence as deep as 20 μm.
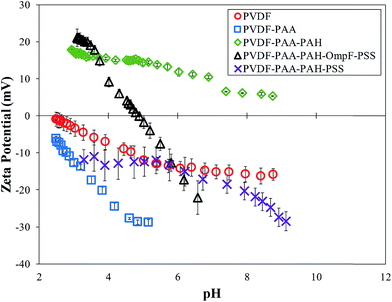
Surface charge measurements verified the presence of each polymer layer. Each layer builds upon the next, with functional groups of the most recently added layer influencing the ζ potential. The functional groups show negative values when negatively charged ionization is present and positive values for positively charged groups. Neutral surfaces change the charge from positive to negative throughout the pH range. As seen in Fig. 7, the bare PVDF membrane has slightly acidic behavior due to charges on its surface, the PAA functionalized membrane shows negative behavior and PAA–PAH shows positive behavior due to the amine groups in its structure. The charge on the final PVDF–PAA–OmpF–PSS membrane in this case changes from positive to negative. The hydrophilic amino acids on each end of OmpF were stabilized by electrostatic interactions with the functional polymers. In addition, the presence of previous charges from PAA and PAH shifted the OmpF ionization point to pH 5.0. In the case of the non-OmpF membrane (PVDF–PAA–PAH–PSS), its behavior is negative, as expected due to the sulfonate groups in PSS. There is a small range between pH 4 and 6 where the ζ potential of the non-OmpF membrane does not change, possibly due to balance of the charges between the PAH and the PSS layers.
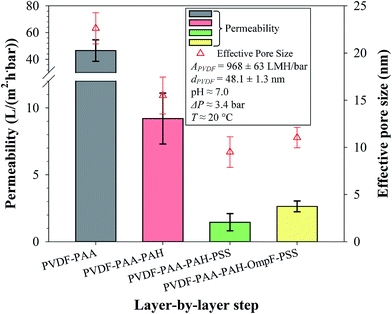
On the other hand, increased grafting of properly aligned OmpF within the pore can actually increase flux because OmpF contains positive and negative residues on opposite sides within its tightest midsection; therefore, this area is polar and highly hydrophilic at neutral pH.56 Thus, the non-OmpF membranes have, on average, a slightly smaller permeability (1.5 ± 0.5 LMH bar−1) than the OmpF membranes (2.6 ± 0.3 LMH bar−1). From these results, an effective pore diameter was calculated using a modified Hagen–Poiseuille equation.57 The effective pore size based on flow is larger for the OmpF membranes than for the non-OmpF membranes, which demonstrates a flux enhancement due to the presence of OmpF. Note that this pore size is not an actual value of the pores but rather represents a nominal pore size. This means that the presence of OmpF increases the water permeability compared to the non-OmpF membranes, which in turn is associated with a larger effective pore diameter. The effective pore size suggests a larger permeability due to the presence of OmpF.
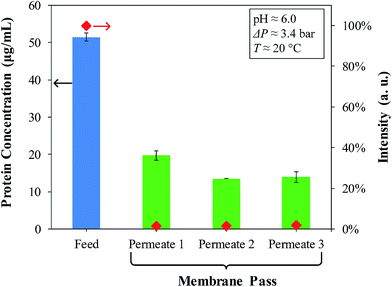
From the enhanced BCA assay, the material balance of the OmpF solutions passed through the PVDF–PAA–PAH membranes (Fig. 9) presents the feed (with 50 μg mL−1) and the subsequent permeates which are in the range of detection. A permeate of one pass becomes the feed of the next; for instance, Permeate 1 = Feed 2. By the third pass, no decrease in concentration between Feed 3 (Permeate 2) and Permeate 3 is observed, suggesting that only two passes of OmpF solution are necessary. On the other hand, fluorescence labelling with 5 μg mL−1 porin is almost negligible, which demonstrates the effective immobilization of OmpF by LbL functionalization. This was also confirmed by fluorescence spectra of the feeds and permeates of the FITC-labelled OmpF solutions, shown in Fig. S5 in the ESI.†
For the first and second passes of OmpF solution, the loaded protein was 1.74 g m−2 of membrane after two passes. The total number of OmpF units loaded can be determined from their molecular weight. The permeation of 50 mL DIUF water at pH 6 and 6.8 bar contained non-detectable OmpF, suggesting secure immobilization of the protein. The OmpF feed used was 51 to 53 μg mL−1 for all membranes produced. The charges of the outer, exposed residues of OmpF and those in the extracellular loops at the top and bottom of the β-barrel are mainly positive at low pH and negative at high pH.56 Thus, because the second layer of polyelectrolytes is PAH and essentially has a neutral charge, the OmpF pores can be oriented parallel to the flux through the membrane. It is also likely that while loosely bound valeric acid molecules were washed away, tightly bound ones remained, forming a protection layer around the hydrophobic part of the protein, with the acid head group facing out to the remaining positive charges of the PAH layer.
3.3. Rejection of solutes
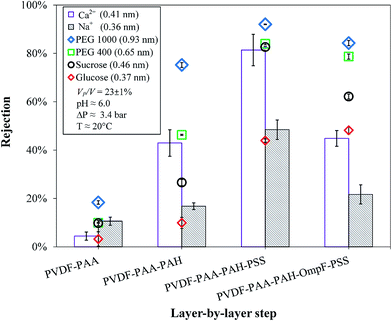
Glucose, sucrose, PEG and dextran with different molecular weights were mixed separately with salts (NaCl or CaCl2) in each solution. Table 1 shows the hydrodynamic radii (rH), the hydrated radii and the molecular weights of the solutes used from different references. 58–71 The different molecular weights and their corresponding rH values were correlated for dextran and poly(ethylene glycol) (PEG) molecules, while mean values were used for glucose and sucrose. From these correlations, the calculated values were used in the rejection studies for each species; see Fig. S3 and S4 in Section 7 of the ESI.† It is important to note that for the two largest molecules, the rH values are the average of a normally distributed range of sizes. PEG and dextran molecules show polydispersity because the length of their chains is not controllable during synthesis. Also, the exact way in which the chain coils is not consistent and depends on the solvent. Long polymer chains with the same degree of polymerization do not “ball up” in the same way.69,72 Thus, although it appears that 100% rejection should be observed for these molecules with number-average sizes well above the dimensions of the constriction zone of OmpF, the membrane may be defective or some polymer chains may possess lengths, and consequently radii, that are significantly smaller than the average.In the case of ions, there are large differences between their Stokes radii and rH values, as depicted in Table 1. However, these values have been reported to show high variation, and only a few are depicted here. This phenomenon was initially discussed by Nightingale and later by Tansel et al.59,73 Briefly, the Stokes radii of some ions, such as Cl−, are dependent on temperature changes; therefore, chloride becomes more hydrated at higher temperatures, but Cl− can also lose its hydration water during permeation. The Stokes radius of Na+ varies slightly with temperature. On the other hand, for Ca2+, both the Stokes radius and rH are independent of temperature. Na+ and often Ca2+ are not large enough compared to the water molecule to satisfy the Stokes law. Because Na+ has very low charge dispersion, its hydration water is more strongly retained. Ca2+ retains its hydration water less than other divalent ions, such as Mg2+; thus, Ca2+ is more suitable for adsorption on the membrane surface. Still, the rejection of Ca2+ is higher than that of Na+ because the rH of Ca2+ is larger than that of Na+.
Sucrose also could pass through the membranes due to its low molecular weight; however, the difference in its rejections was larger (83–62%). It is possible that the elliptical opening of OmpF (1.1 × 0.7 nm) allows sucrose to orientate in such a way that it can pass through more easily than through a rounded pore of the same diameter. In addition, the size of sucrose is near the molecular cutoff of OmpF; also, the presence of protein channels may aid the formation of sucrose–calcium complexes, which facilitate sucrose transport through the OmpF membranes.74 OmpF has been shown to open more at high and low pH, and although the pH values were around neutral (pH 6.0), this phenomenon may have been replicated by interactions with individual ions and molecules. This causes the midsection of OmpF to open and close due to ionization; the above constriction zone measurements are only correct for the non-hydrated channels. These rejections of the OmpF membrane do not demonstrate which species OmpF fully and partially rejects because it is not clear which portions of the large and small channels (from 0.35 to 0.16 nm, respectively) predominate. The constriction region is mostly hydrophobic at low pH values due to its net negative charge.42,75 Additionally, the switch from small to large channels is abrupt in a very small pH range, which becomes difficult to control when other charged moieties are present in the layers; it is also feasible that there are fewer pores in the membrane with no OmpF, allowing solutes to pass.
The OmpF membrane significantly rejected uncharged molecules larger than 1 nm while allowing ions to pass through. Even though the membranes in this study are intended for microfiltration, due to their functionalization, they may also behave as UF and nanofiltration (NF) membranes with similarities to NF in terms of size and charge (shown by the ζ potential in Fig. 7). The molecular cutoff of the OmpF membrane still requires improvement; however, it can be observed that the type of organic compound used did not affect the rejection of the salt, which is a feature that some conventional UF membranes do not possess. It is worth noting that the experiments performed were designed for dilute concentrations, and increasing the concentrations of model organics would generate additional effects, such as concentration–polarization or pore blocking/constriction.
With their similar rH values, the OmpF membrane selectively allowed the passage of more salts than the non-OmpF membrane. The behavior of the non-OmpF membrane is comparable to previous results from our group for NF membranes: in the non-OmpF membrane, the rejections of CaCl2 and NaCl were 81% and 48%, respectively, while those in the NF membranes increased from 83% and 44–95% and 92% depending on the hydrophilicity of the membrane.76 This implies a ratio of about 2 of the divalent and monovalent ions for the more hydrophilic membranes. This ratio was conserved in the OmpF membrane, but with lower values: sodium chloride rejection was 22% and calcium chloride rejection was 45%, while the rejection of the model organics remained almost the same, except for sucrose, as explained previously. A plausible explanation for this behavior is that the positive charges on Ca2+ and Na+ at the operating pH enable their transport through OmpF.34 This was corroborated later when the effects of pH on salt rejection were analyzed. Therefore, the membrane containing OmpF demonstrates superior selectivity over NF membranes and those containing various polymeric layers. The NF membranes have sharper cutoffs and the fully functionalized non-OmpF membranes reject organics slightly more than the OmpF membrane; however, due to their similar permeability to the non-OmpF membranes, the OmpF membrane can separate charged ions from uncharged molecules, a feature that has not been previously reported in LbL studies. In fact, the non-OmpF membrane rejects CaCl2 (Fig. 10) as well as larger organics; the exposed charges of the polymeric layers likely improve ionic rejection and sacrifice selectivity. The selectivity of the OmpF membrane implies an advantage in reducing the salt concentration in the retentate stream; improvements in the LbL assembly could also improve the rejection and selectivity performance of the membrane.
To estimate salt/organic selectivity (α), one can calculate the ratio of the sieving coefficients of each species (α = (1 − Rsalt)/(1 − Rorg)) or the ratio of the concentration in the permeate to that in the retentate.26,77 Values of α >1 indicate that salts are being filtrated, increasing the specific concentrations of the permeate during the process. In contrast, α <1 corresponds to an increase in salt concentration in the retentate. From the data in Fig. 10, one can calculate the ratio of rejection, Rorg/Rsalt; for example, for PEG 1000, the ratio changes from 1.8 to 3.9 times in the OmpF membrane, depending on the salt used. This represents higher filtration selectivity for salts, with α values from 3.5 to 5.0; see Table 2.
| Membrane | Glucose | Sucrose | PEG 400 | PEG 1000 | ||||
|---|---|---|---|---|---|---|---|---|
| Na+ | Ca2+ | Na+ | Ca2+ | Na+ | Ca2+ | Na+ | Ca2+ | |
| PVDF–PAA | 0.92 | 0.99 | 0.99 | 1.06 | 0.99 | 1.06 | 1.09 | 1.17 |
| PVDF–PAA–PAH | 0.92 | 0.63 | 1.13 | 0.78 | 1.55 | 1.06 | 3.35 | 2.30 |
| PVDF–PAA–PAH–OmpF–PSS | 0.92 | 0.33 | 2.97 | 1.07 | 3.21 | 1.16 | 6.45 | 2.33 |
| PVDF–PAA–PAH–PSS | 1.51 | 1.06 | 2.07 | 1.46 | 3.67 | 2.59 | 4.98 | 3.51 |
For the OmpF membrane, more significant selectivity values were achieved with NaCl than with CaCl2, likely due to the slightly higher rH of the calcium salt. In order to observe the effects of osmotic pressure on permeability over time in the case of significant rejections (those in non-OmpF membrane), a much larger initial salt concentration and much more time are needed.
The rejections were calculated as the averages from multiple passes of salts and model organic solute combinations for each membrane type, taking into account the error propagation for the calculations. For all tests, the permeability and recovery were consistent and were not affected by the presence of solutes; this confirms the stability of the OmpF membrane.
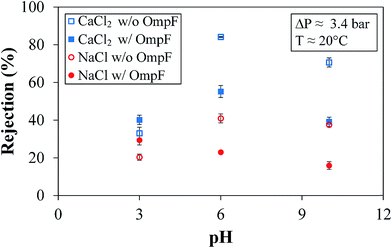
The rejection of NaCl is different. NaCl rejection by the OmpF membrane presents a slightly negative, linear trend with increasing pH due to its smaller size and enlargement of the OmpF channels, as previously reported.38,42 Due to the slightly smaller rH of sodium coupled with the smaller presence of PSS in the OmpF membrane, more sodium can bypass the outer surface charges of PSS and make its way into the OmpF pore. This would cause the rejection mechanism involving the pore residues of the protein to dominate the rejection mechanism related to the PSS that secures the OmpF. The overall effect is an increase in the partitioning between monovalent salts and non-charged molecules, as seen in Fig. 10.
However, an important feature is also presented in Fig. 11: in both salts, the rejection is lower in the OmpF membrane than in the non-OmpF membrane. At pH 3.0, the rejection values may be related to the affinity between the charges on the external PSS layer and the low Donnan potential; regardless, the difference between the OmpF and non-OmpF membranes is insignificant in this pH range.
3.4. Stability and material balance in OmpF LbL membranes
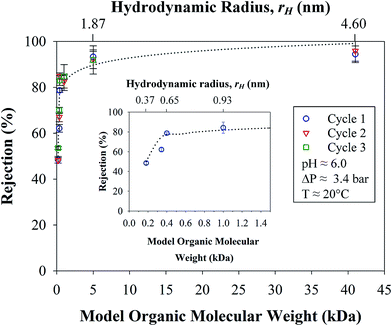
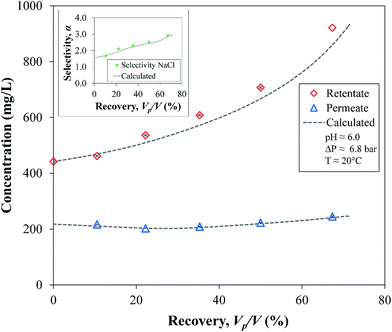
The stability and consistency of the rejections of the OmpF membrane were tested in three cycles for all organic solutes, as shown in Table 1. In Fig. 12, it can be seen that all the solutions were permeated through the membrane for an average of 8 h per day over three weeks; the extremely consistent values with an estimated error of only 3.3% demonstrate the exceptional resiliency of the membrane. The logarithmic pattern (dashed lines in Fig. 12) again correlates the rejection with the molecular weight of the organic compounds (R2 = 0.90) and, thus, with the rH values of the solutes used. It is also worth noting that the rejection plateau is reached at 84% for molecular weights of 0.4 to 1.0 kDa and then, at 5 kDa, the rejection is 92%; see Fig. 12. The mean recovery, 24 ± 1%, for these cycles is also constant and is similar to previous results. It is worth noting that there was an increase in the recovery (up to 9%) after the first cycle due to adsorption, mainly for solutes with lower molecular weights. These adsorptions and measurement errors were as high as absolute 8% in all experiments performed and must be taken into account as imbalances in the material balances; see Section 8 of the ESI.† At this point, it is further confirmed that the OmpF membrane selectively separates model organic solutes from salts that exceed 40% rejection.Using a model solution of sucrose and NaCl, the material balance for a batch process was calculated by taking samples of the retentate and cumulative permeate over time. Assuming that the density does not change due to low solute concentration, the total and the solute mass balances can be calculated by
| JA = −ρdV/dt | (1) |
| JACP = −ρd(VC)/dt | (2) |
To calculate the batch operation, analytical integration between the initial and final concentrations, C0 and C, gives the retentate volume V as a function of its concentration in every step of the integration, leaving only one numerical integration for t using the functions of the experimental data (J and CP vs. C). The experimental and integration values in Fig. 13 show an expected increase of the retentate C as well of the α values of NaCl; consequently, the behavior of the cumulative permeate, CP, is almost constant. This confirms again that the OmpF membrane increases the selective filtration of salts over non-charged organics over time. Comparing the two data sets by a two-tailed t-test showed no evidence of a difference between the experimental and calculated values (|t| = 1.046 < 2.023 with α = 0.05).
4. Conclusions
Successful immobilization of OmpF by a LbL method within a functionalized membrane was achieved. This procedure opens a new approach for the incorporation of biomolecules into an artificial membrane, showing better selectivity of ions over non-charged molecules and, despite a less sharp cutoff, comparable rejection values to NF and LbL non-OmpF membranes. Understanding the behavior of the charged and uncharged portions on the exterior of OmpF will enable improvement of the fluxes and rejections. This topic has not been explored without using lipid bilayers or vesicles for immobilization. Development in this field may enable better alignment within the nanocomposite membrane matrix.With similar pore sizes, the OmpF membrane separated more salts than model organics from the mixtures. Salt rejections through the OmpF-membrane by LbL assembly were much lower than through a polymeric membrane without OmpF. This means that the OmpF-membrane has higher selectivity for the separation of ions over non-charged molecules than NF membranes and LbL membranes without OmpF, allowing these ions to pass through the membrane while rejecting some non-charged molecules. For CaCl2, the rejection ratios (Rorg/Rsalt) were up to 1.7 times higher than those of a non-OmpF membrane, while the rejection ratio of NaCl rose to 2.1 times higher than that of the non-OmpF membrane.
The OmpF membrane was stable and consistent in all cycles tested, suggesting that the membrane was durable for more than 160 h. Solutions flow through both immobilized OmpF pores and the spaces between the layers, reaching 84% rejection from 0.4 to 1.0 kDa and more than 92% rejection for 5 kDa with almost double permeation of salts. The unique pH responsiveness of the LbL membrane with OmpF, with observed changes in permeability and salt rejection, is an indicator that the solution mostly passed through OmpF. Also, the unimproved rejection of salts and organics in track-etched polycarbonate membranes and the merely temporary decrease of flux proves that the LbL method stabilizes OmpF within the membranes and improves their performance. FITC labelled OmpF studies by fluorescence analysis (confocal microscopy and feed/permeate analysis) further verified the stability (and lack of loss) of the porins.
Various methods of verifying the cross-linking of PAA and the subsequent layer depositions of PAH, OmpF and PSS onto a PVDF microfiltration membrane were successful, including pH responsiveness, changes in flux, and ζ potential. The unique behavior of the functionalized PVDF membrane with immobilized OmpF is a promising result, suggesting that the OmpF was immobilized. The membrane potentially provides more mechanical stability than bioinspired membranes with traditional ruptured lipid bilayers or vesicles containing biomolecular channels. Most importantly, this work can be applied for immobilizing other biomolecules, such as aquaporins, which have the potential to reject 100% of almost all solutes.
Conflicts of interest
There are no conflicts to declare.Acknowledgements
Funding: This work was supported by the National Science Foundation NSF KY EPSCoR program (Grant no: 1355438) and the National Institutes of Environmental Health Sciences NIEHS-SRC (grant number P42ES007380). The authors want to thank Nanostone Water Inc. for collaboration related to PVDF membrane scale-up, and the Environmental Research Training Laboratories at the University of Kentucky.References
- S. Qi, R. Wang, G. K. M. Chaitra, J. Torres, X. Hu and A. G. Fane, J. Membr. Sci., 2016, 508, 94–103 CrossRef CAS.
- K. Turner, S. Khatwani and S. Daunert, in Responsive Membranes and Materials, John Wiley & Sons, Ltd., 2012, pp. 243–268, DOI:10.1002/9781118389553.ch11.
- X. Li, S. Chou, R. Wang, L. Shi, W. Fang, G. Chaitra, C. Y. Tang, J. Torres, X. Hu and A. G. Fane, J. Membr. Sci., 2015, 494, 68–77 CrossRef CAS.
- Y.-x. Shen, P. O. Saboe, I. T. Sines, M. Erbakan and M. Kumar, J. Membr. Sci., 2014, 454, 359–381 CrossRef CAS.
- Y.-Q. Liu, Y.-L. Zhang, X.-Y. Fu and H.-B. Sun, ACS Appl. Mater. Interfaces, 2015, 7, 20930–20936 CAS.
- B. Hinds, in Responsive Membranes and Materials, John Wiley & Sons, Ltd., 2012, pp. 51–71, DOI:10.1002/9781118389553.ch3.
- E. Licsandru, I. Kocsis, Y.-x. Shen, S. Murail, Y.-M. Legrand, A. van der Lee, D. Tsai, M. Baaden, M. Kumar and M. Barboiu, J. Am. Chem. Soc., 2016, 138, 5403–5409 CrossRef CAS PubMed.
- S. Schneider, E.-D. Licsandru, I. Kocsis, A. Gilles, F. Dumitru, E. Moulin, J. Tan, J.-M. Lehn, N. Giuseppone and M. Barboiu, J. Am. Chem. Soc., 2017, 139, 3721–3727 CrossRef CAS PubMed.
- J. R. Werber, C. O. Osuji and M. Elimelech, Rev, 2016, 1, 16018 CAS.
- D. S. Sholl and R. P. Lively, Nature, 2016, 532, 435–437 CrossRef PubMed.
- Y. X. Shen, W. Si, M. Erbakan, K. Decker, R. De Zorzi, P. O. Saboe, Y. J. Kang, S. Majd, P. J. Butler, T. Walz, A. Aksimentiev, J. L. Hou and M. Kumar, Proc. Natl. Acad. Sci. U. S. A., 2015, 112, 9810–9815 CrossRef CAS PubMed.
- Y.-R. Kim, S. Jung, H. Ryu, Y.-E. Yoo, S. M. Kim and T.-J. Jeon, Sensors, 2012, 12, 9530 CrossRef CAS PubMed.
- X. Zhang, P. Tanner, A. Graff, C. G. Palivan and W. Meier, J. Polym. Sci., Part A: Polym. Chem., 2012, 50, 2293–2318 CrossRef CAS.
- G.-D. Kang and Y.-M. Cao, J. Membr. Sci., 2014, 463, 145–165 CrossRef CAS.
- S. M. Husson, in Responsive Membranes and Materials, John Wiley & Sons, Ltd., 2012, pp. 73–96, DOI:10.1002/9781118389553.ch4.
- S. R. Lewis, V. Smuleac, L. Xiao and D. Bhattacharyya, in Responsive Membranes and Materials, John Wiley & Sons, Ltd., 2012, pp. 97–142, DOI:10.1002/9781118389553.ch5.
- D. Wandera, S. R. Wickramasinghe and S. M. Husson, J. Membr. Sci., 2010, 357, 6–35 CrossRef CAS.
- H. Yuk, T. Zhang, S. Lin, G. A. Parada and X. Zhao, Nat. Mater., 2016, 15, 190–196 CrossRef CAS PubMed.
- M. Wisniewska, T. Urban, E. Grzadka, V. I. Zarko and V. M. Gun'ko, Colloid Polym. Sci., 2014, 292, 699–705 CAS.
- S. Hernandez, J. K. Papp and D. Bhattacharyya, Ind. Eng. Chem. Res., 2014, 53, 1130–1142 CrossRef CAS PubMed.
- G. Decher, J. D. Hong and J. Schmitt, Thin Solid Films, 1992, 210, 831–835 CrossRef.
- V. Smuleac, D. A. Butterfield and D. Bhattacharyya, Langmuir, 2006, 22, 10118–10124 CrossRef CAS PubMed.
- D. A. Butterfield, D. Bhattacharyya, S. Daunert and L. Bachas, J. Membr. Sci., 2001, 181, 29–37 CrossRef CAS.
- M. Wang, Z. Wang, X. Wang, S. Wang, W. Ding and C. Gao, Environ. Sci. Technol., 2015, 49, 3761–3768 CrossRef CAS PubMed.
- A. Zydney, in Encyclopedia of Membranes, ed. E. Drioli and L. Giorno, Springer Berlin Heidelberg, Berlin, Heidelberg, 2015, pp. 1–2, DOI:10.1007/978-3-642-40872-4_129-4.
- A. Mehta and A. L. Zydney, J. Membr. Sci., 2005, 249, 245–249 CrossRef CAS.
- N. Saint, K. L. Lou, C. Widmer, M. Luckey, T. Schirmer and J. P. Rosenbusch, J. Biol. Chem., 1996, 271, 20676–20680 CrossRef CAS PubMed.
- T. Schirmer and P. S. Phale, J. Mol. Biol., 1999, 294, 1159–1167 CrossRef CAS PubMed.
- H. Nikaido, J. Gen. Physiol., 1981, 77, 121–135 CrossRef CAS PubMed.
- H. Nikaido, E. Y. Rosenberg and J. Foulds, J. Bacteriol., 1983, 153, 232–240 CAS.
- H. Nikaido and E. Y. Rosenberg, J. Bacteriol., 1983, 153, 241–252 CAS.
- S. Kojima and H. Nikaido, Proc. Natl. Acad. Sci. U. S. A., 2013, 110, E2629–E2634 CrossRef CAS PubMed.
- K. M. Robertson and D. P. Tieleman, FEBS Lett., 2002, 528, 53–57 CrossRef CAS PubMed.
- J. Cama, H. Bajaj, S. Pagliara, T. Maier, Y. Braun, M. Winterhalter and U. F. Keyser, J. Am. Chem. Soc., 2015, 137, 13836–13843 CrossRef CAS PubMed.
- B. K. Ziervogel and B. Roux, Structure, 2013, 21, 76–87 CrossRef CAS PubMed.
- H. Nikaido and M. Vaara, Microbiol. Rev., 1985, 49, 1–32 CAS.
- V. J. v. Hijkoop, A. J. Dammers, K. Malek and M.-O. Coppens, J. Chem. Phys., 2007, 127, 085101 CrossRef PubMed.
- J. C. Todt, W. J. Rocque and E. J. McGroarty, Biochemistry, 1992, 31, 10471–10478 CrossRef CAS PubMed.
- R. Benz, K. Janko and P. Lauger, Biochim. Biophys. Acta, 1979, 551, 238–247 CrossRef CAS.
- H. Schindler and J. P. Rosenbusch, Proc. Natl. Acad. Sci. U. S. A., 1978, 75, 3751–3755 CrossRef CAS.
- L. K. Buehler and J. P. Rosenbusch, Biochem. Biophys. Res. Commun., 1993, 190, 624–629 CrossRef CAS PubMed.
- J. C. Todt and E. J. McGroarty, Biochem. Biophys. Res. Commun., 1992, 189, 1498–1502 CrossRef CAS PubMed.
- S. S. Klara, P. O. Saboe, I. T. Sines, M. Babaei, P. L. Chiu, R. DeZorzi, K. Dayal, T. Walz, M. Kumar and M. S. Mauter, J. Am. Chem. Soc., 2016, 138, 28–31 CrossRef CAS PubMed.
- M. Kumar, M. Grzelakowski, J. Zilles, M. Clark and W. Meier, Proc. Natl. Acad. Sci. U. S. A., 2007, 104, 20719–20724 CrossRef CAS PubMed.
- H. Wang, T. S. Chung, Y. W. Tong, K. Jeyaseelan, A. Armugam, Z. Chen, M. Hong and W. Meier, Small, 2012, 8, 1185–1190 CrossRef CAS PubMed.
- R. Taylor, J. W. Burgner, J. Clifton and W. A. Cramer, J. Biol. Chem., 1998, 273, 31113–31118 CrossRef CAS PubMed.
- A. Holzenburg, A. Engel, R. Kessler, H. J. Manz, A. Lustig and U. Aebi, Biochemistry, 1989, 28, 4187–4193 CrossRef CAS PubMed.
- F. Yoshimura, L. S. Zalman and H. Nikaido, J. Biol. Chem., 1983, 258, 2308–2314 CAS.
- R. M. Garavito and J. P. Rosenbusch, Methods Enzymol., 1986, 125, 309–328 CAS.
- S. Arcidiacono, M. M. Butler and C. M. Mello, Protein Expression Purif., 2002, 25, 134–137 CrossRef CAS PubMed.
- H. Xiao, D. Hong, T. Zhu, S. Liu and G. Li, J. Appl. Electrochem., 2009, 39, 1163–1167 CrossRef CAS.
- A. Jarząb, D. Witkowska, E. Ziomek, A. Dąbrowska, Z. Szewczuk and A. Gamian, PLoS One, 2013, 8, e70539 Search PubMed.
- S. Hernández, S. Lei, W. Rong, L. Ormsbee and D. Bhattacharyya, ACS Sustainable Chem. Eng., 2016, 4, 907–918 CrossRef.
- V. Smuleac, R. Varma, S. Sikdar and D. Bhattacharyya, J. Membr. Sci., 2011, 379, 131–137 CrossRef CAS PubMed.
- L. Xiao, D. M. Davenport, L. Ormsbee and D. Bhattacharyya, Ind. Eng. Chem. Res., 2015, 54, 4174–4182 CrossRef CAS PubMed.
- V. M. Aguilella, M. Queralt-Martin, M. Aguilella-Arzo and A. Alcaraz, Integr. Biol., 2011, 3, 159–172 RSC.
- V. Smuleac, L. Bachas and D. Bhattacharyya, J. Membr. Sci., 2010, 346, 310–317 CrossRef CAS PubMed.
- P. M. Dove and C. J. Nix, Geochim. Cosmochim. Acta, 1997, 61, 3329–3340 CrossRef CAS.
- E. R. Nightingale, J. Phys. Chem., 1959, 63, 1381–1387 CrossRef CAS.
- J. J. Kasianowicz, M. Kellermayer and D. Deamer, Structure and Dynamics of Confined Polymers: Proceedings of the NATO Advanced Research Workshop on Biological, Biophysical & Theoretical Aspects of Polymer Structure and Transport Bikal, Hungary, 20–25 June 1999, Springer, Netherlands, 2012 Search PubMed.
- J. R. Pappenheimer, Physiol. Rev., 1953, 33, 387–423 CAS.
- L. E. Ramm, M. B. Whitlow and M. M. Mayer, Proc. Natl. Acad. Sci. U. S. A., 1982, 79, 4751–4755 CrossRef CAS.
- A. C. F. Ribeiro, O. Ortona, S. M. N. Simões, C. I. A. V. Santos, P. M. R. A. Prazeres, A. J. M. Valente, V. M. M. Lobo and H. D. Burrows, J. Chem. Eng. Data, 2006, 51, 1836–1840 CrossRef CAS.
- O. M. Sabek, S. Ferrati, D. W. Fraga, J. Sih, E. V. Zabre, D. H. Fine, M. Ferrari, A. O. Gaber and A. Grattoni, Lab Chip, 2013, 13, 3675–3688 RSC.
- S. G. Schultz and A. K. Solomon, J. Gen. Physiol., 1961, 44, 1189–1199 CrossRef CAS PubMed.
- L. Lebrun and G. A. Junter, Enzyme Microb. Technol., 1993, 15, 1057–1062 CrossRef CAS PubMed.
- H. Ghandehari, P. L. Smith, H. Ellens, P. Y. Yeh and J. Kopecek, J. Pharmacol. Exp. Ther., 1997, 280, 747–753 CAS.
- K. Ling, H. Jiang and Q. Zhang, Nanoscale Res. Lett., 2013, 8, 538 CrossRef PubMed.
- A. Pluen, P. A. Netti, R. K. Jain and D. A. Berk, Biophys. J., 1999, 77, 542–552 CrossRef CAS PubMed.
- O. Baron-Epel, P. K. Gharyal and M. Schindler, Planta, 1988, 175, 389–395 CrossRef CAS PubMed.
- J. J. Choi, S. Wang, Y. S. Tung, B. Morrison III and E. E. Konofagou, Ultrasound Med. Biol., 2010, 36, 58–67 CrossRef PubMed.
- M. A. Masuelli, J. Polym. Biopolym. Phys. Chem., 2013, 1, 13–21 Search PubMed.
- B. Tansel, J. Sager, T. Rector, J. Garland, R. F. Strayer, L. Levine, M. Roberts, M. Hummerick and J. Bauer, Sep. Purif. Technol., 2006, 51, 40–47 CrossRef CAS.
- T. J. Leitão, L. M. A. Tenuta, G. Ishi and J. A. Cury, Braz. Oral Res., 2012, 26, 100–105 CrossRef.
- B. K. Jap and P. J. Walian, Physiol. Rev., 1996, 76, 1073–1088 CAS.
- A. S. Colburn, N. Meeks, S. T. Weinman and D. Bhattacharyya, Ind. Eng. Chem. Res., 2016, 55, 4089–4097 CrossRef CAS.
- C. Umpuch, S. Galier, S. Kanchanatawee and H. R.-d. Balmann, Process Biochem., 2010, 45, 1763–1768 CrossRef CAS.
Footnote |
| † Electronic supplementary information (ESI) available: Detailed methods and analysis are illustrated in the ESI material. These include sections on functionalization and characterization of the OmpF solution and membrane; ζ potential procedures; preliminary characterization of the concentrations of feed retentate and permeate; membrane selection; optimization of PAA functionalization; FITC labelled OmpF analysis of the feed and permeate; model organic compound regressions; and material imbalance minimization. See DOI: 10.1039/c7ra08737c |
| This journal is © The Royal Society of Chemistry 2017 |


