DOI:
10.1039/C7RA08403J
(Paper)
RSC Adv., 2017,
7, 44647-44654
Thermoelectric properties of DO3 V3Al using first principles calculations
Received
30th July 2017
, Accepted 2nd September 2017
First published on 18th September 2017
Abstract
The structural, electronic, and thermoelectric properties of DO3 V3Al in the paramagnetic (PM) and antiferromagnetic (AF) phases are investigated using the semi-classical Boltzmann theory in combination with deformation potential theory from first-principles calculations. The structural results are consistent with other theoretical and experimental data. AF-DO3 V3Al is verified to be a gapless semiconductor. Based on the calculated relaxation time τ and lattice thermal conductivity κL, the thermoelectric properties of PM-DO3 and AF-DO3 V3Al have been predicted. Compared with PM-DO3 V3Al, the AF-DO3 phase exhibits favorable thermoelectric performance. The optimized thermoelectric figure of merit ZT of the p-type AF-DO3 phase can be as high as 0.32 at T = 500 K. It is possible to make V3Al a promising candidate for efficient thermoelectricity by reducing its thermal conductivity.
1 Introduction
Thermoelectric (TE) materials can realize electric power generation from waste heat, thus they are considered as potential materials to be used to address both the energy crisis and environmental pollution. The performance of thermoelectric materials is measured according to a dimensionless figure of merit in the form of ZT = S2σT/κ. In the equation, S is the Seebeck coefficient, T denotes the absolute temperature, σ stands for the electrical conductivity and κ is the thermal conductivity. However, the thermal conductivity κ consists of the lattice thermal conductivity κL and electronic conductivity κe. The fact is that the higher the ZT value, the better the performance of a thermoelectric material is.1 To obtain an ideal thermoelectric material, one must try to maximize the Seebeck coefficient S, maximize the electrical conductivity σ and minimize the thermal conductivity κ. Identifying and designing materials with high ZT has proven to be very challenging because of the mutual coupling among S, σ and κ.
Ternary Half-Heusler (HH) alloys such as MCoSb and MNiSn (M = Ti, Zr, and Hf) have great potential as high-temperature thermoelectric materials due to their high power factor (S2).2–5 These compounds, formed in a cubic crystal structure with an F4/3m (no. 216) space group, are semiconductors with an 18 valence electron count (VEC) per unit cell, a narrow energy gap, and a Fermi level slightly above the top of the valence band, and so, they have a decent Seebeck coefficient with moderate electrical conductivity. ZT values of 0.8–1.0 for n-type half-Heusler alloys (Zr,Hf)NiSn have been achieved at 600–700 °C.6,7 The studies on n-type Hf0.5Zr0.25NiSn0.975Sb0.025 (ref. 8) and p-type Hf0.5Zr0.25CoSn0.8Sb0.2 (ref. 9) showed that the values of ZT can be improved to 1.0 and 0.8, respectively. From first-principles calculations, the thermoelectric properties of half-Heusler alloys ABPb (A = Hf,Zr; B![[double bond, length as m-dash]](https://www.rsc.org/images/entities/char_e001.gif) Ni,Pd) were also studied.10 Fu and his collaborators obtained a maximum ZT of 1.1 in p-type FeNb1−xTixSb (0.04 ≤ x ≤ 0.24)11 at a temperature of 1100 K. Then, they focused their attention on the p-type FeNbSb crystal and reported that the value of ZT reached up to 1.5 at 1200 K.12 However, the ZT values of HHs are still lower than those of most state-of-the-art thermoelectric materials. The search into the fundamentals and improvement in TE transport phenomena continues.
Ni,Pd) were also studied.10 Fu and his collaborators obtained a maximum ZT of 1.1 in p-type FeNb1−xTixSb (0.04 ≤ x ≤ 0.24)11 at a temperature of 1100 K. Then, they focused their attention on the p-type FeNbSb crystal and reported that the value of ZT reached up to 1.5 at 1200 K.12 However, the ZT values of HHs are still lower than those of most state-of-the-art thermoelectric materials. The search into the fundamentals and improvement in TE transport phenomena continues.
Recently, another Heusler-like alloy, DO3 V3Al, was theoretically anticipated to be an antiferromagnetic (AF) gapless semiconductor (GS),13 and then was experimentally synthesized by arc-melting and annealing and characterized as a GS14 with a zero magnetic moment. V3Al exhibits many typical features of a good room-temperature TE material, such as a narrow band gap and a high density of states near the band edges. Understanding phonon and electron transport in V3Al is important in the design and optimization of TE materials. In order to systematically study the relationship between the TE properties and the structural features and to understand the transport mechanisms in TE materials, we present a theoretical insight into the structural, electronic, and thermoelectric properties of DO3 V3Al by employing the semi-classical Boltzmann transport theory and deformation potential theory performed with first-principles calculations.
2 Computational method and process
We performed the electronic structure calculations of V3Al by applying density function theory (DFT),15,16 as implemented in the VASP package17–19 according to the projector-augmented wave (PAW) method.20 The generalized gradient approximation (GGA) with Perdew–Burke–Ernzerhof (PBE) functionals21 is adopted to deal with the exchange-correlation energy. A Monkhorst–Pack k-mesh sample of 15 × 15 × 15 in the whole Brillouin zone and a cut-off energy of 560 eV are used. The optimal structure is considered to be optimized when the force carried on each atom is less than 0.01 eV Å−1. Transport calculations conducted rely on the semi-classic Boltzmann transport theory within the BoltzTrap code,22 which has been successfully used to predict the performance of some thermoelectric (TE) materials.23–25
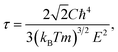
Theoretical treatments for both phonon and electron transport still have two challenges to be solved in order to get accurate predictions for TE materials. Firstly, many theoretical calculations on electrical conductivity κe are usually based on a constant relaxation time or a non-constant one from an experiment,26,27 the reliability of which still remains to be confirmed in many cases. The relaxation time is usually very complicated since it depends on detailed scattering mechanisms. The lattice constant is quite small compared with the wavelength of thermally activated carriers at room temperature. Then, the scattering of carriers is dominated by the electron-acoustic phonon coupling.28 Hence, the deformation potential (DP) theory together with the effective mass approximation is adopted to evaluate the relaxation time in this study. The relaxation time at temperature T for a three-dimensional system is29
| |
 | (1) |
where
C represents the elastic constant which takes the form of
| |
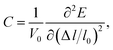 | (2) |
in which
V0 and
l0 are the equilibrium volume and lattice parameter, Δ
l =
l −
l0 which is the lattice distortion and
E is the corresponding free energy of the system. The DP constant
E denotes the shift of the conduction (valence) band edge with respect to unit strain, which can be defined as
| |
 | (3) |
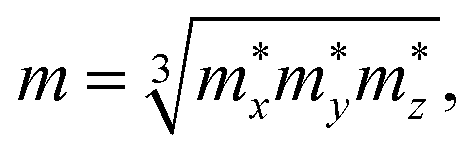
The effective mass m at the conduction (valence) band edge is calculated from
| |
 | (4) |
where

,

, and

are the effective masses along the
x,
y and
z directions, respectively. With
f0 standing for the equilibrium Fermi–Dirac distribution function,
µ representing the chemical potential, and
vk denoting the group velocity at state
k, the Seebeck coefficient
S is in the form of
| |
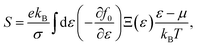 | (5) |
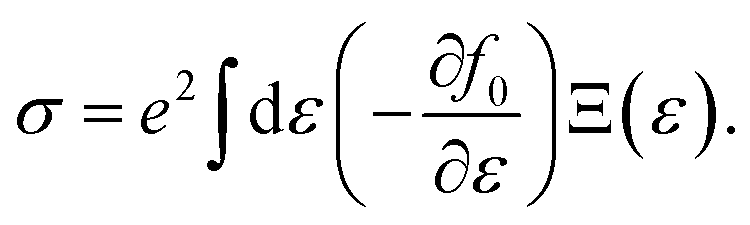
in which the transport distribution function can be written as
The electrical conductivity σ is given by
| |
 | (7) |
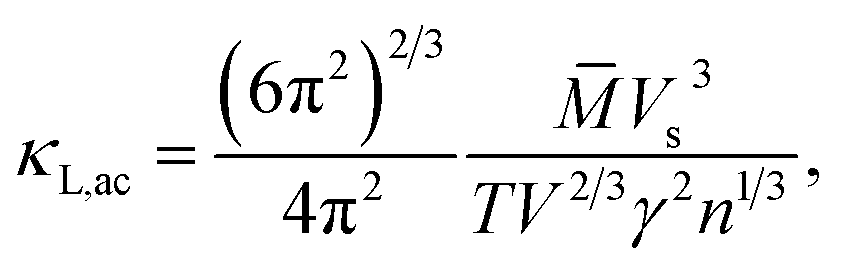
It is noted that the three mentioned parameters (C, E, and m) can be obtained from the DFT calculations. Thus, one can predict the relaxation time of different carriers. Secondly, the lattice thermal conductivity κL is considered to be in sum with the electronic component κe to obtain the thermal conductivity κ. We employ a simplified Debye–Callaway model30 to calculate κL which contains acoustic and optical phonon modes. However, the acoustic phonon is usually dominant in κL and approximated to be31
| |
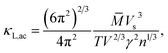 | (8) |
in which
![[M with combining macron]](https://www.rsc.org/images/entities/i_char_004d_0304.gif)
is the mass per atom in the crystal,
V is the average volume of all the atoms, and
n is the total atomic number in the primitive cell. We consider the Grüneisen parameter
γ from the structural data as implemented within the quasi-harmonic Debye model.
32 The speed of sound
Vs can be approximated using the formula

with
B and
d respectively denoting the bulk modulus and density. The optical phonon modes can be described as
33| |
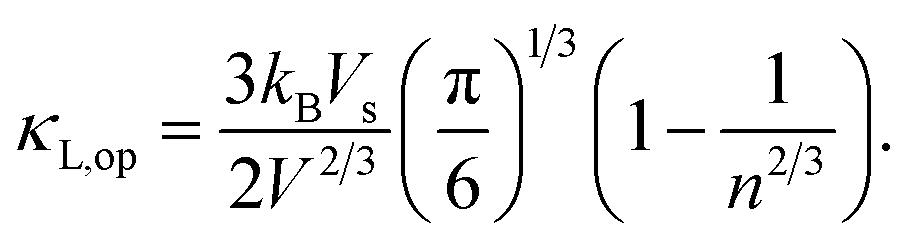
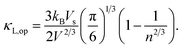 | (9) |
So far, we can get the magnitude of lattice thermal conductivity κL and it is possible to make a prediction of the ZT value.
3 Results and discussion
3.1 Structural property
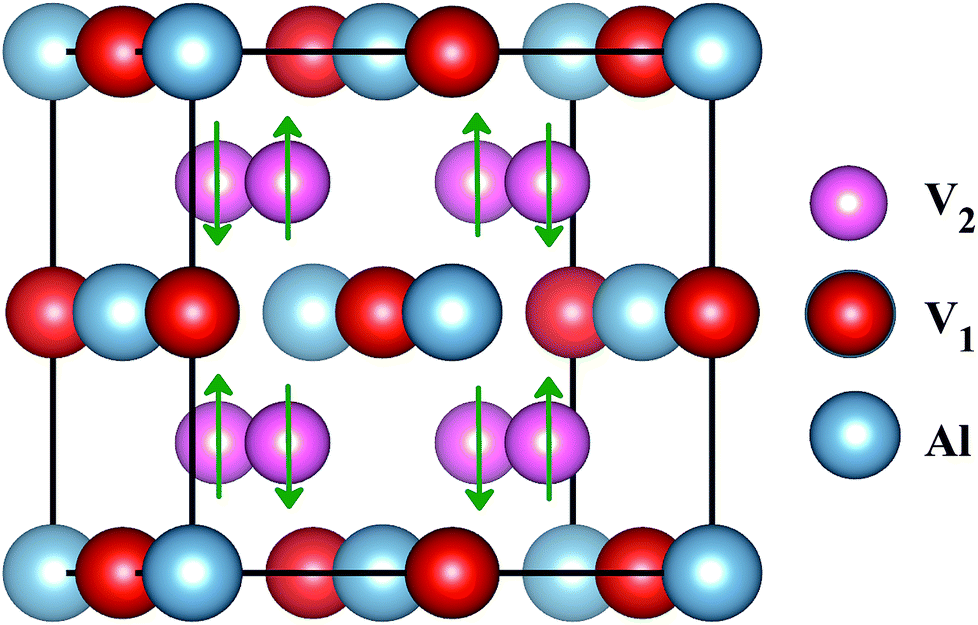
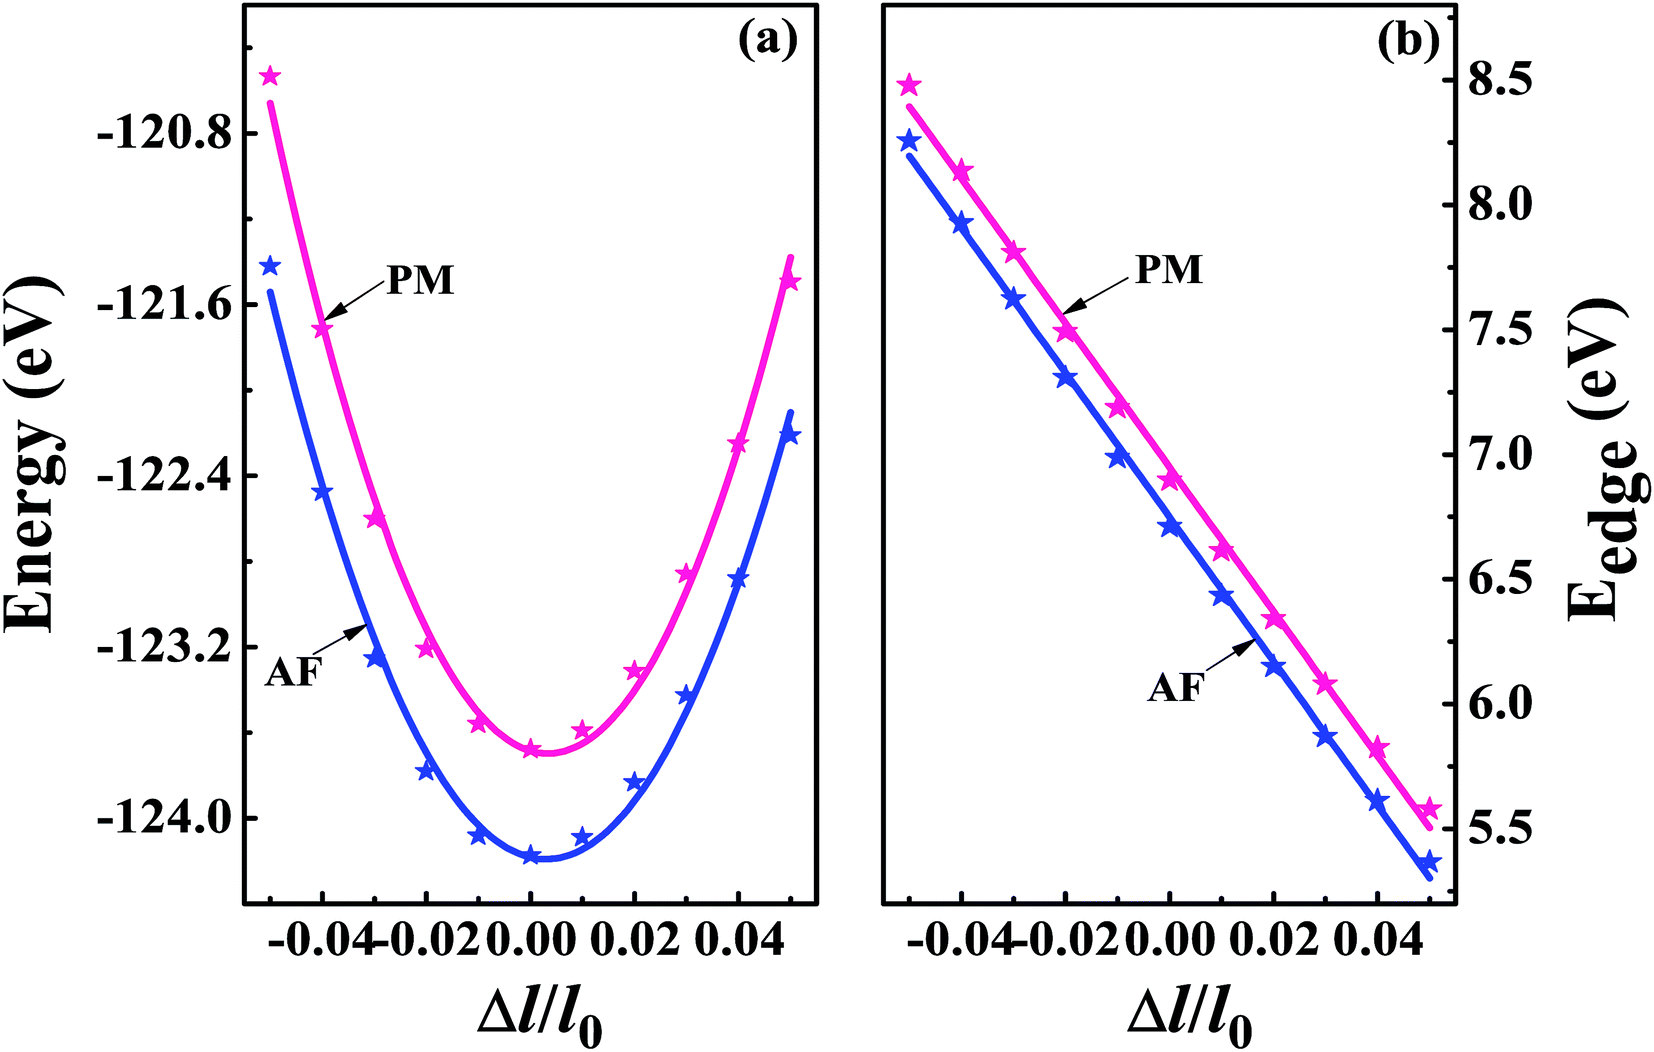
The superconducting properties of pseudo-Heusler DO3 structure V3Al have been studied during the past few decades.34–36 In addition, the antiferromagnetic (AF) gapless semiconducting DO3 phase of V3Al was successfully observed in experiment.14 The space group of the DO3 structure is Fm![[3 with combining macron]](https://www.rsc.org/images/entities/char_0033_0304.gif) m, which is the same as that of the L21 structure. In general, the ternary L21 structure is represented by the generic formula X2YZ. When the Y element is replaced by X, it turns out to be the binary DO3 structure with X3Z basis. So, the Al atom in V3Al is located at the 4a (0,0,0) position of Wyckoff coordination. The two inequivalent V atoms respectively occupy the 4b (0.5,0.5,0.5) (labeled V1) and 4c (0.25,0.25,0.25) (labeled V2) positions,37 as shown in Fig. 1. It is noted that both the V2 atoms are equal in the paramagnetic (PM) phase, but in the AF phase they possess opposite spin directions as can be seen in Fig. 1. From the DFT calculation, the V2 atoms of the AF phase hold anti-aligned moments of 1.527 µB per atom and the V1 atom remains nonmagnetic. Fig. 2(a) presents the total energy of PM-DO3 and AF-DO3 V3Al as the variation of lattice parameter l relative to equilibrium lattice parameter l0 ranges from −0.05 to 0.05. The calculated results are expressed by dots and the solid lines are the fitted data using the Murnaghan equation of state.38,39 The obtained elastic constant C values for both the PM-DO3 and AF-DO3 phases are listed in Table 1. It is noted that the total energy of the AF-DO3 V3Al is much smaller than that of the PM-DO3 phase. As a result, we confirm the metastability of PM-DO3 V3Al. The optimized lattice parameter in this study is 6.067 Å, which is similar to the value of 6.06 Å from another theoretical result.13
m, which is the same as that of the L21 structure. In general, the ternary L21 structure is represented by the generic formula X2YZ. When the Y element is replaced by X, it turns out to be the binary DO3 structure with X3Z basis. So, the Al atom in V3Al is located at the 4a (0,0,0) position of Wyckoff coordination. The two inequivalent V atoms respectively occupy the 4b (0.5,0.5,0.5) (labeled V1) and 4c (0.25,0.25,0.25) (labeled V2) positions,37 as shown in Fig. 1. It is noted that both the V2 atoms are equal in the paramagnetic (PM) phase, but in the AF phase they possess opposite spin directions as can be seen in Fig. 1. From the DFT calculation, the V2 atoms of the AF phase hold anti-aligned moments of 1.527 µB per atom and the V1 atom remains nonmagnetic. Fig. 2(a) presents the total energy of PM-DO3 and AF-DO3 V3Al as the variation of lattice parameter l relative to equilibrium lattice parameter l0 ranges from −0.05 to 0.05. The calculated results are expressed by dots and the solid lines are the fitted data using the Murnaghan equation of state.38,39 The obtained elastic constant C values for both the PM-DO3 and AF-DO3 phases are listed in Table 1. It is noted that the total energy of the AF-DO3 V3Al is much smaller than that of the PM-DO3 phase. As a result, we confirm the metastability of PM-DO3 V3Al. The optimized lattice parameter in this study is 6.067 Å, which is similar to the value of 6.06 Å from another theoretical result.13
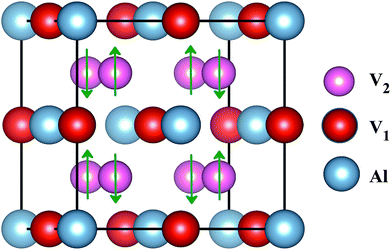 |
| | Fig. 1 The structure of antiferromagnetic DO3-V3Al. The up and down arrows stand for the positive and negative spins of the V2 atoms. | |
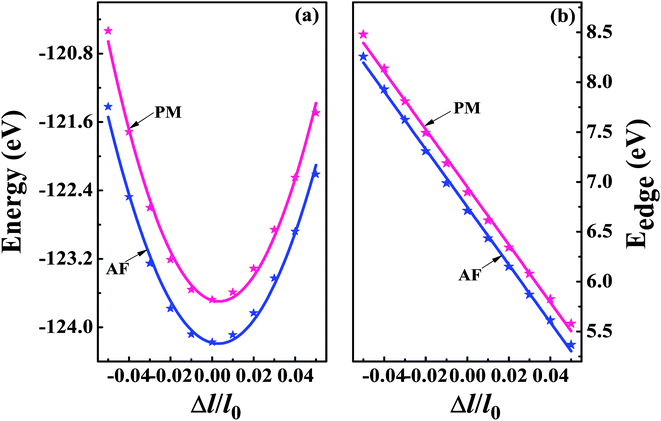 |
| | Fig. 2 The total energy (a) and band edge energy (Eedge) (b) versus the uniaxial strain Δl/l0 with Δl = l − l0 and l0 denoting the equilibrium lattice parameter. The calculated results are expressed by dots and the solid lines are the fitted data for both PM-DO3 V3Al (shown in red) and AF-DO3 V3Al (shown in blue). | |
Table 1 The calculated deformation potential constant E, elastic constant C, effective mass m and obtained relaxation time τ at room temperature of PM-DO3 and AF-DO3 V3Al
| Phase |
Carrier type |
E (eV) |
C |
m (me) |
τ (fs) |
| PM-DO3 |
Electron |
28.89 |
1.67 |
0.04 |
742 |
| Hole |
28.89 |
1.67 |
0.07 |
403 |
| AF-DO3 |
Electron |
28.92 |
1.45 |
0.05 |
493 |
| Hole |
28.92 |
1.45 |
0.08 |
273 |
3.2 Electronic structure
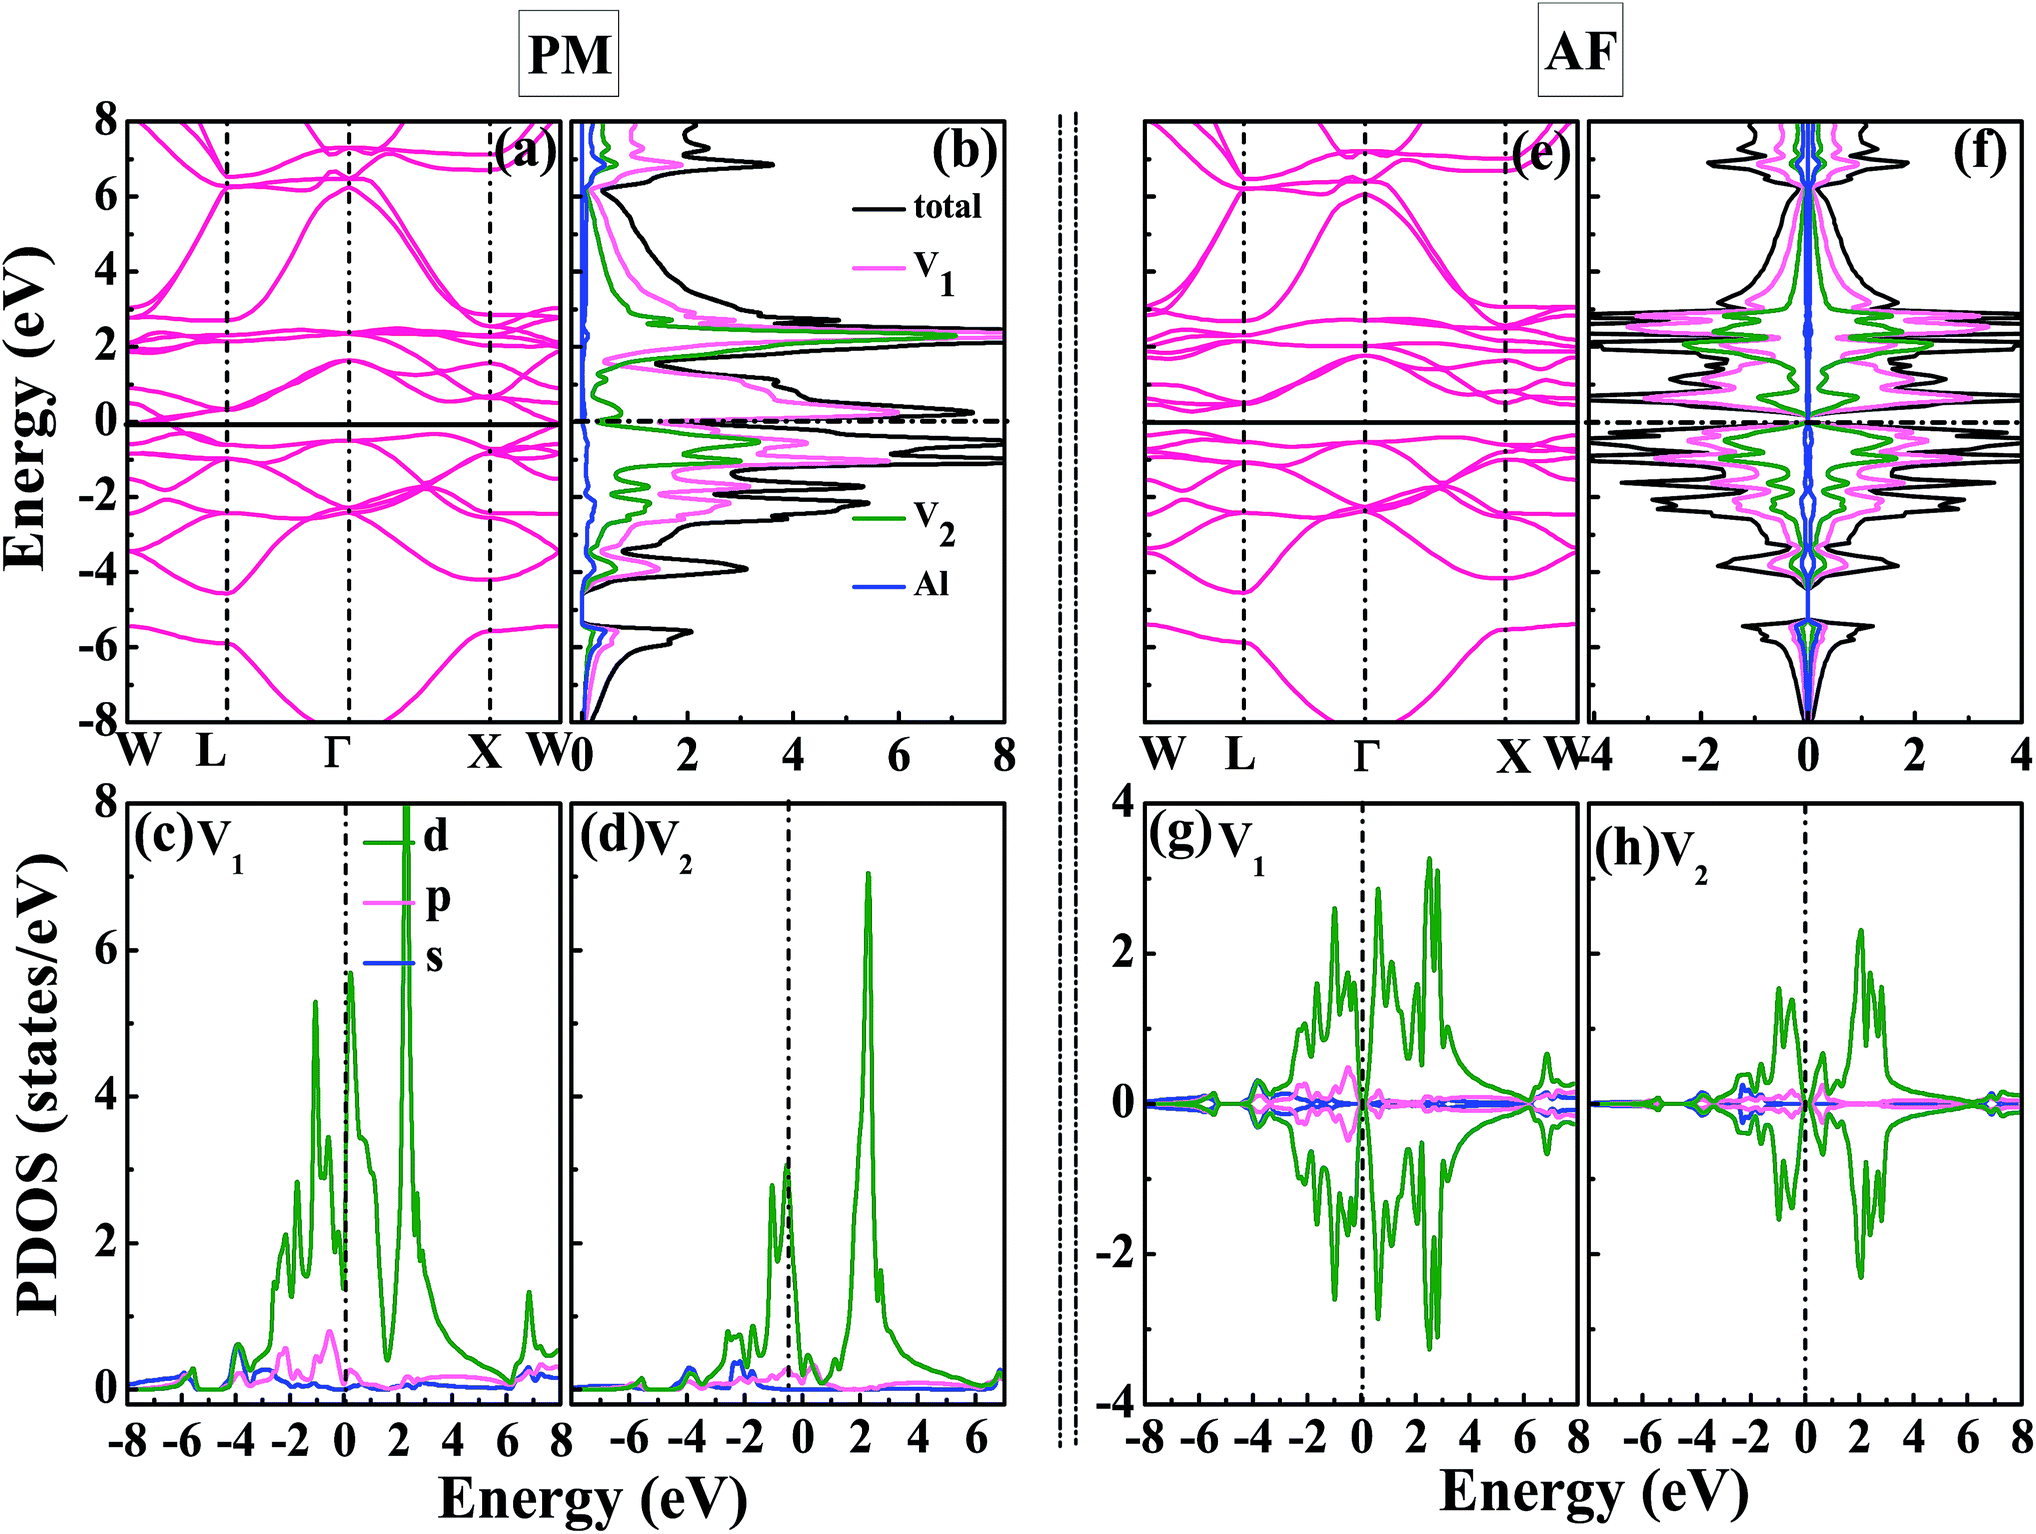
Now, we focus on the density of states and band structure of PM-DO3 and AF-DO3 V3Al. From Fig. 3(a), it can be seen that both the top of the valence band and the bottom of the conduction band are sited at point W and they just touch together, thus a band gap does not exist. There are also some states in Fig. 3(b) around the Fermi level. As a result, PM-DO3 V3Al is a metal. It is also seen that the local DOS (LDOS) of the V1 with V2 atoms contributes to the major total DOS. In order to further explore the bonding features, the projected DOSs (PDOSs) for the s-, p-, and d-orbitals of the V1 and V2 atoms are drawn in Fig. 3(c and d). The d-orbitals of the two V atoms dominate the LDOS, showing the d–d hybridization between the V1–V2 atoms for PM-DO3 V3Al. However, the total DOS of AF-DO3 V3Al in two spin directions is symmetrical, as shown in Fig. 3(f). In the AF configuration shown in Fig. 3(e), the maximum of the valence band and the minimum of the conduction band are quite close, thus forming a small direct band gap, which is the same as in other theoretical studies,14,40 and the band gap is smaller than 0.1 eV. AF-DO3 V3Al therefore exists as an antiferromagnetic gapless semiconductor.14 The LDOSs of the V1 and V2 atoms contribute mostly to AF-DO3 V3Al’s total DOS. From Fig. 3(g) and (h), it can be seen that the bonding characteristics in the AF-DO3 phase are preserved and the same as in the case of PM-DO3. It is the hybridization of the V1 and V2 d-bands that makes the main contribution of the total DOS.
 |
| | Fig. 3 The calculated band structure (a), total DOS for V3Al together with local DOSs (LDOSs) for the V1 atoms, V2 atoms, and Al atoms (b), projected DOSs (PDOSs) for the s-, p-, and d-orbitals of the V1 atoms (c), together with those of the V2 atoms (d) for PM-DO3 V3Al. The calculated band structure (e), total DOS and LDOSs (f), PDOSs of V1 (g), together with the PDOSs of V2 (h) for AF-DO3 V3Al. The dashed lines in the DOSs denote the Fermi levels. | |
On the other hand, we obtain the effective mass m for both the n-type and p-type carriers of PM-DO3 and AF-DO3 V3Al from the above electronic structure calculation and list in Table 1. The valence band maximum (VBM) touches the conduction band minimum (CBM) for both phases of V3Al, so the energy values of the VBM and CBM are the same. Fig. 2(b) plots this same band edge energy (Eedge) versus the ratio of lattice distortion Δl = l − l0 and equilibrium lattice parameter l0 for PM-DO3 and AF-DO3 V3Al. They exhibit good linear dependence and the Eedge of AF-DO3 V3Al is a little lower than that of the PM-DO3 phase. Here, we obtain DP constant values, as summarized in Table 1, together with the elastic constant C, effective mass m and relaxation time τ at room temperature for electrons and holes of PM-DO3 and AF-DO3 V3Al. The effective mass m next to the CBM of PM-DO3 V3Al is about 0.04 me, which is smaller than the 0.07 me near the VBM. This is due to the fact that the energy band next to the CBM is sharper than that next to the VBM. Similarly, for AF-DO3 V3Al, the sharper energy band near the CBM also results in a smaller effective mass. As a result, the relaxation time for holes is shorter than that for electrons in both PM-DO3 and AF-DO3 V3Al. It is noted that the relaxation time between two carriers is also obviously different in other systems such as NbFeSb41 and LaPtSb.42 Otherwise, the relaxation time of electrons and holes in V3Al is much larger than that in thermoelectric materials like ZrNiPb,43 suggesting the promising thermoelectric performance of V3Al.
3.3 Thermoelectric properties
Fig. 4(a) shows the lattice thermal conductivity κL as a function of temperature for V3Al. The acoustic phonon lattice thermal conductivity κL,ac and optical phonon mode κL,op in the temperature range from 0 to 1200 K are plotted in Fig. 4(b) and (c), respectively. It is seen that the total κL is dominated by κL,ac and κL,op makes very little contribution to κL. On the other hand, both the components of AF-DO3 V3Al are smaller than those of PM-DO3 V3Al. Therefore, the former phase has a lower value of total κL. It is important to note that such a lower κL value may suggest the favorable TE performance of AF-DO3 V3Al compared to the other phase.
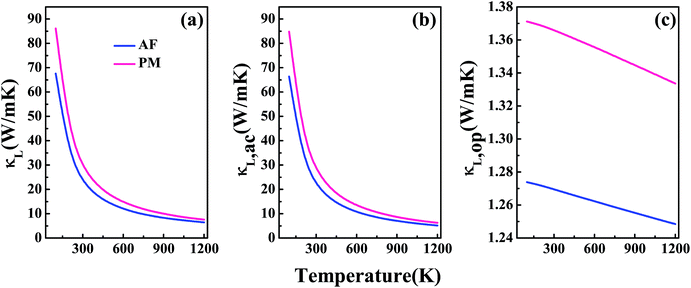 |
| | Fig. 4 The calculated lattice thermal conductivity κL (a) and its two components: acoustic phonon modes κL,ac (b) and optical phonon modes κL,op (c). | |
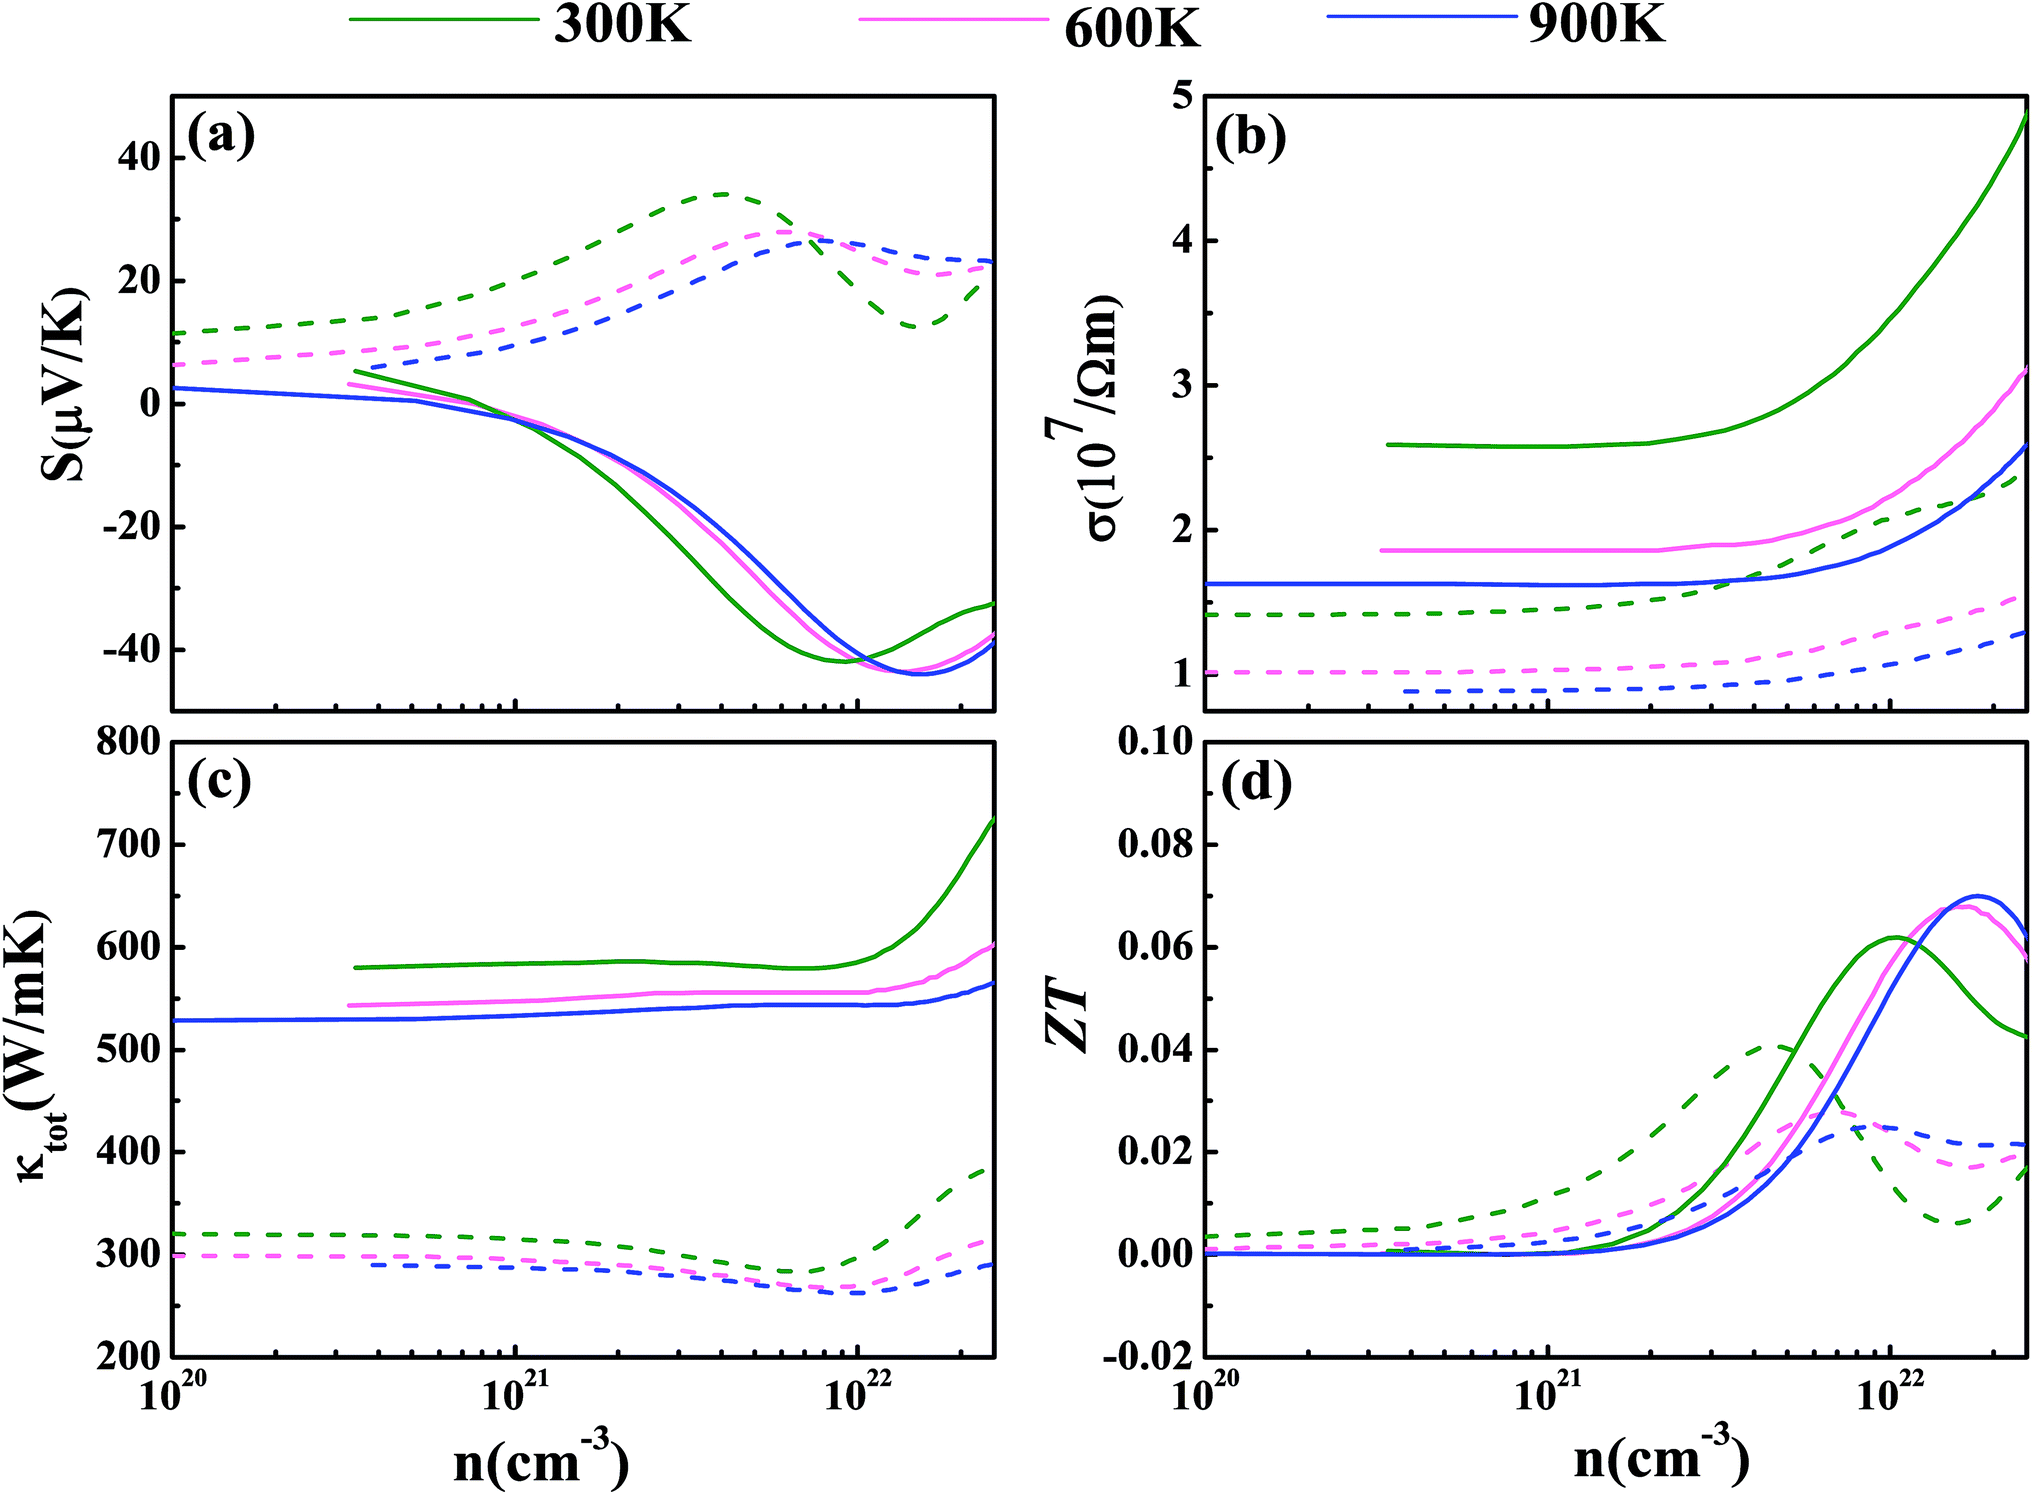
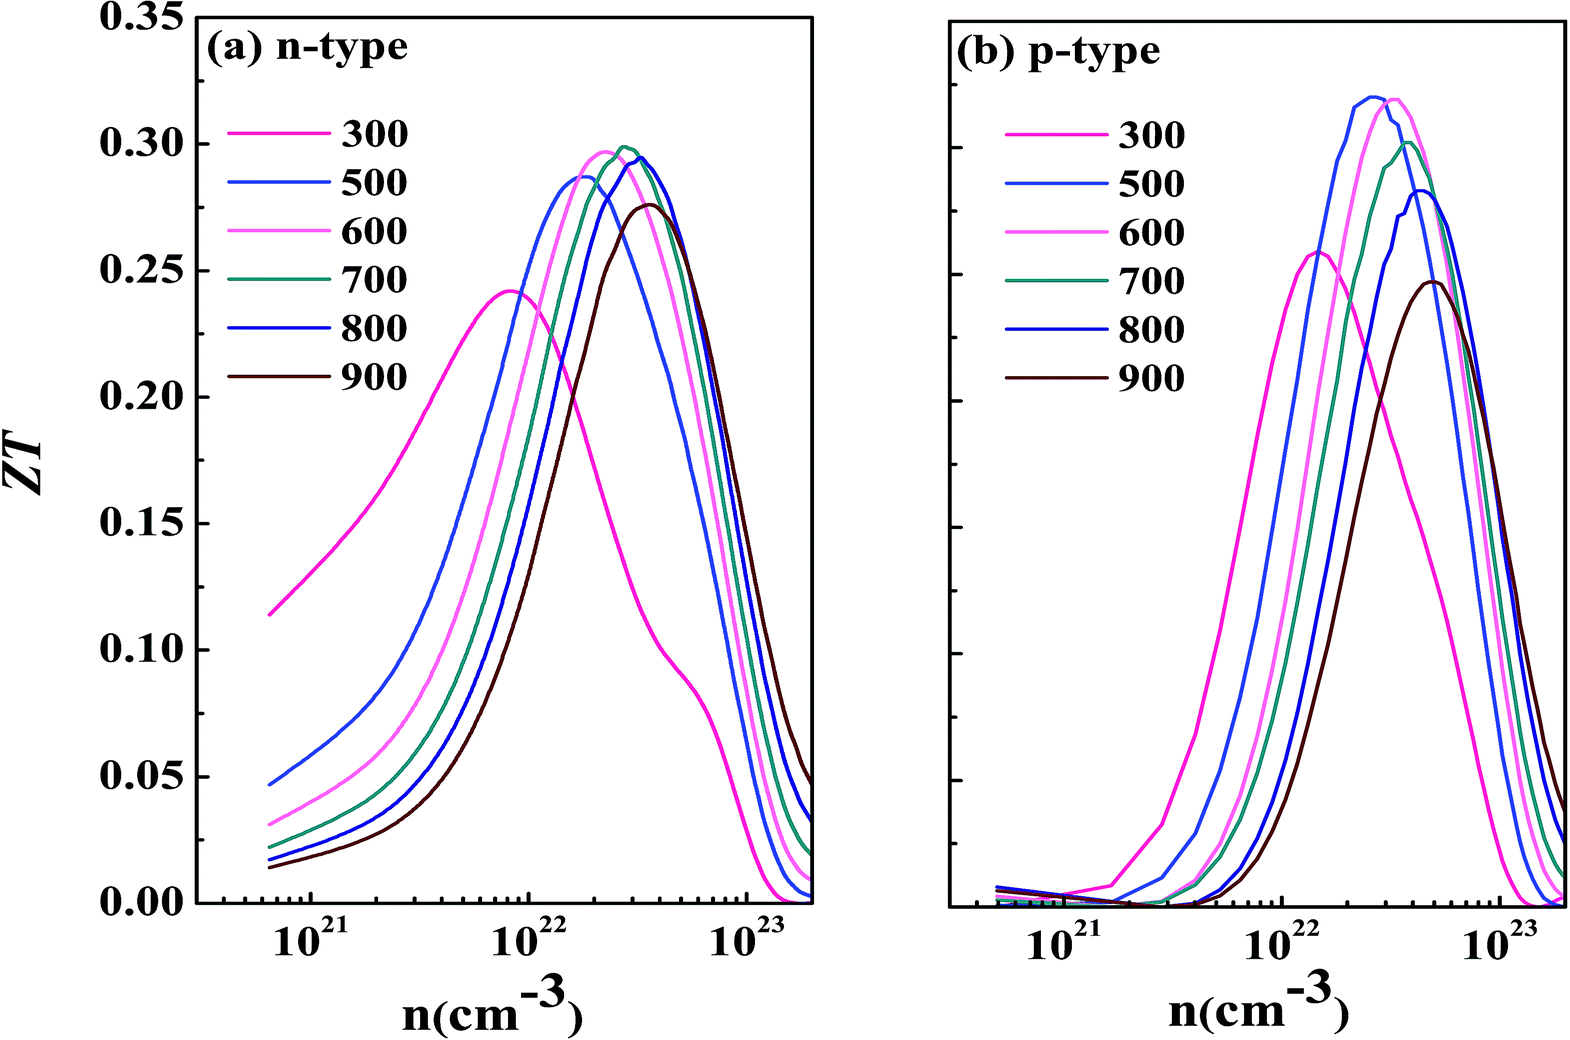
Now we have obtained all of the transport coefficients (including the Seebeck coefficient S, the electronic conductivity σ and the total thermal conductivity κ) for PM-DO3 and AF-DO3 V3Al. By inserting them into the formula ZT = S2σT/κ, one can get useful information about the thermoelectric performance. In Fig. 5 and 6, we summarize some representative sets of data about these coefficients as a function of carrier concentration n respectively for PM-DO3 and AF-DO3 V3Al when the temperature is 300 K, 600 K and 900 K. The TE performances of n-type V3Al are shown by solid lines and dashed lines show those of p-type V3Al. The absolute value of S firstly increases and then decreases as n increases at a constant temperature. This value is larger at lower temperature before the single-peaked value and the Seebeck coefficient S at higher temperature holds a larger value when the carrier concentration grows further. It also can be seen that the absolute value of S for AF-DO3 V3Al is greater than that of PM-DO3 V3Al, thus predicting the favorable thermoelectric performance of AF-DO3 V3Al. The electrical conductivity σ of n-type V3Al is higher than that of p-type V3Al for both phases which results from the significant difference between the relaxation times of the two different carriers. Fig. 5(b) shows that the magnitude of σ is sensitive to temperature in the whole mentioned carrier concentration, but the σ value is insensitive to T before the carrier concentration reaches 1021 cm−3. We can see from Fig. 5(a) and (b) that there exists an obvious increasing trend of σ at the carrier concentration where the absolute value of S is very small, which is similar to that found in Fig. 6(a) and (b). So it is of great importance to find a good balance between the Seebeck coefficient and electrical conductivity for V3Al. By adding the calculated lattice thermal conductivity κL to the obtained electronic thermal conductivity κe, we get the total thermal conductivity κtot. κtot exhibits the same dependency on carrier concentration as σ shows when the temperature remains unvaried. Nevertheless, the total κ appears to exhibit an increasing trend with increasing temperature in the low n ranges for AF-DO3 V3Al as shown in Fig. 6(c). Finally, we are able to evaluate the thermoelectric performance of V3Al. As shown in Fig. 5(d), the obtained ZT value of n-type PM-DO3 V3Al is rather larger than that of p-type PM-DO3 V3Al and the ZT data for both are unfortunately quite low for this phase of V3Al. For AF-DO3 V3Al, the ZT is greatly enhanced as seen in Fig. 6(d). A large ZT of 0.297 for the n-type system is obtained at the optimal conditions (n = 1.39 × 1022 cm−3 and T = 600 K). For the p-type system, at n = 2.31 × 1022 cm−3 and T = 600 K, the ZT reaches 0.319. As temperature keeps increasing, the peak height of both maximal ZT values firstly increases and then decreases with the increasing carrier concentration. In order to further explore the temperature influence on the ZT of AF-DO3 V3Al, we plot Fig. 7. The maximal ZT of n-type AF-DO3 V3Al appears to be 0.3 when n and T are respectively tuned to 2.05 × 1022 cm−3 and 700 K. For the p-type AF-DO3 V3Al, the optimal ZT data is further enhanced to be 0.32 at a concentration of 1.59 × 1022 cm−3 and temperature of 500 K. The calculated upper limit ZT values of XNiSn (X = Hf, Zr, and Ti) are severally 0.22, 0.26, and 0.29 and it is 0.30 for ZrNiPb,43 which are all less than that of p-type AF-DO3 V3Al, thus suggesting the better TE performance of p-type AF-DO3 V3Al. However, there are still many TE materials like ZrRhBi,44 FeNbSb,45 and Nb1−xTixFeSb alloys41 which show favorable thermoelectric performances. Compared with the transport coefficients (S, σ, and κ) of all the just mentioned TE materials, V3Al is found to have a high thermal conductivity κ, which is a fatal disadvantage in obtaining a high ZT value. So, reducing the magnitude of the thermal conductivity κ may be an effective approach to attain better TE performance.
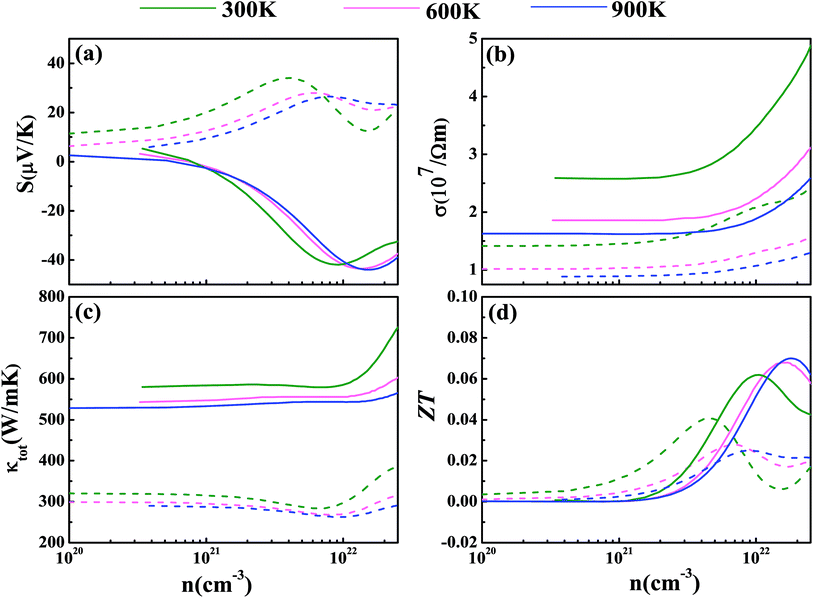 |
| | Fig. 5 The calculated Seebeck coefficient S (a), electronic conductivity σ (b), total thermal conductivity κtot (c), and thermoelectric figure of merit ZT (d) at T = 300 K (shown in green), 600 K (shown in pink), and 900 K (shown in blue) for PM-DO3 V3Al. The dashed and solid lines represent the p-type and n-type phases, respectively. | |
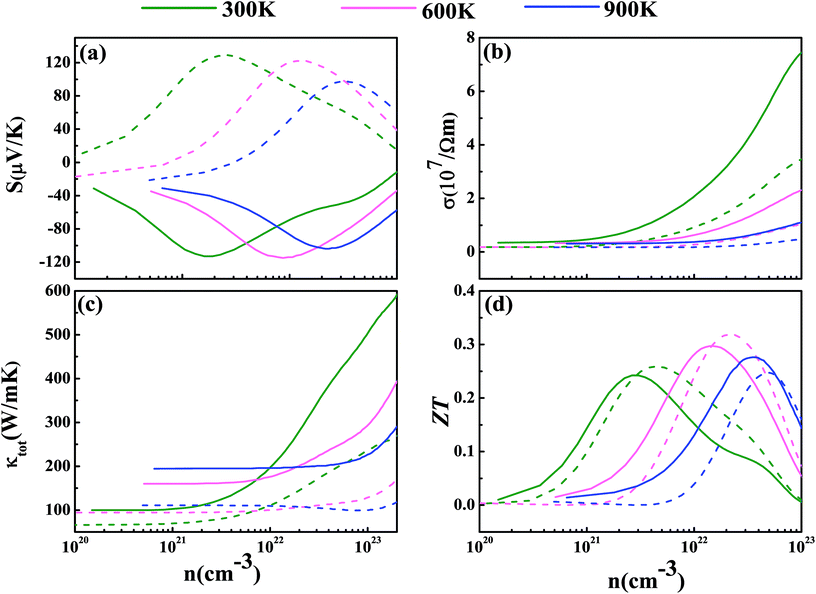 |
| | Fig. 6 The calculated Seebeck coefficient S (a), electronic conductivity σ (b), total thermal conductivity κtot (c), and thermoelectric figure of merit ZT (d) at T = 300 K (shown in green), 600 K (shown in pink), and 900 K (shown in blue) for AF-DO3 V3Al. The dashed and solid lines represent the p-type and n-type phases, respectively. | |
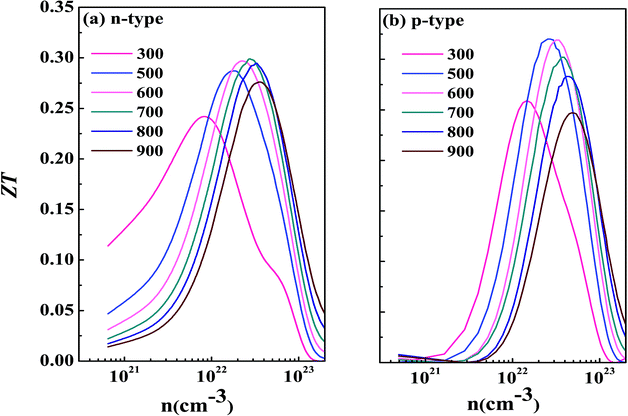 |
| | Fig. 7 The calculated ZT as a function of temperature for n-type AF-DO3 V3Al (a) and p-type AF-DO3 V3Al (b). | |
4 Conclusions
The structural, electronic, and thermoelectric properties of PM-DO3 V3Al and AF-DO3 V3Al have been systematically studied by employing first-principles calculations based on DFT theory. By calculating the total energy versus volume, it is found that V3Al prefers to be an antiferromagnetic system. The obtained equilibrium lattice constant is 6.067 Å, which is similar to other theoretical results. Electronic structure calculations confirm the gapless semiconductor properties of antiferromagnetic V3Al. In order to understand the thermoelectric properties of V3Al, we firstly obtained the relaxation time τ using deformation potential theory and the lattice thermal conductivity κL from the DFT results. The values of κL for PM-DO3 V3Al and AF-DO3 V3Al are respectively 29.16 W mK−1 and 23.14 W mK−1 at room temperature. Then the Seebeck coefficient S, electrical conductivity κ, thermal conductivity σ, and ZT values of both phases of V3Al were investigated. PM-DO3 V3Al exhibits a lower Seebeck coefficient, resulting in a worse thermoelectric performance. The maximal ZT value of p-type AF-DO3 V3Al reaches 0.32 at n = 1.59 × 1022 cm−3 and T = 500 K. Further studies should be focused on reducing the thermal conductivity to enhance the TE performance of AF-DO3 gapless semiconductor V3Al. We hope that our calculations and results offer useful guidance for further study on TE materials.
Conflicts of interest
There are no conflicts to declare.
Acknowledgements
This work was supported by the National Natural Science Foundation of China under Grant No. 11645002, the Natural Science Foundation of Chongqing under Grant No. CSTC-2011BA6004, and the Postgraduates’ Research and Innovation Project of Chongqing under Grant No. CYB17077.
References
- Y. Ma, R. Heijl and A. E. C. Palmqvist, J. Mater. Sci., 2013, 48, 2767–2778 CrossRef CAS.
- H. Hohl, A. P. Ramirez, C. Goldmann, G. Ernst, B. Wölfing and E. Bucher, J. Phys.: Condens. Matter, 1999, 11, 1697–1709 CrossRef CAS.
- G. S. Nolas, J. Poon and M. Kanatzidis, MRS Bull., 2006, 31, 199–205 CrossRef CAS.
- C. Yu, T. J. Zhu, R. Z. Shi, Y. Zhang, X. B. Zhao and J. He, Acta Mater., 2009, 57, 2757–2764 CrossRef CAS.
- Q. Shen, L. Chen, T. Goto, T. Hirai, J. Yang, G. P. Meisner and C. Uher, Appl. Phys. Lett., 2001, 79, 4165–4167 CrossRef CAS.
- G. Joshi, X. Yan, H. Z. Wang, W. S. Liu, G. Chen and Z. F. Ren, Adv. Energy Mater., 2011, 1, 643–647 CrossRef CAS.
- S. Populoh, M. H. Aguirre, O. C. Brunko, K. Galazka, Y. Lu and A. Weidenkaff, Scr. Mater., 2012, 66, 1073–1076 CrossRef CAS.
- S. R. Culp, S. J. P. N. Hickman, T. M. Tritt and J. Blumm, Appl. Phys. Lett., 2006, 88, 042106 CrossRef.
- S. R. Culp, J. W. Simonson, S. J. Poon, V. Ponnambalam, J. Edwards and T. M. Tritt, Appl. Phys. Lett., 2008, 93, 022105 CrossRef.
- G. T. Wang and D. Y. Wang, J. Alloys Compd., 2016, 682, 375–380 CrossRef CAS.
- C. G. Fu, T. J. Zhu, Y. T. Liu, H. H. Xie and X. B. Zhao, Energy Environ. Sci., 2014, 8, 216–220 Search PubMed.
- C. G. Fu, S. Q. Bai, Y. T. Liu, Y. S. Tang, L. D. Chen, X. B. Zhao and T. J. Zhu, Nat. Commun., 2015, 6, 9144 Search PubMed.
- G. Y. Gao and K. L. Yao, Appl. Phys. Lett., 2013, 103, 232409 CrossRef.
- M. E. Jamer, B. A. Assaf, G. E. Sterbinsky, D. Arena, L. H. Lewis, A. A. Saúl, G. Radtke and D. Heiman, Phys. Rev. B: Condens. Matter Mater. Phys., 2015, 91, 094409 CrossRef.
- P. Hohenberg and W. Kohn, Phys. Rev., 1964, 136, B864–B871 CrossRef.
- W. Kohn and L. J. Sham, Phys. Rev., 1965, 140, A1133–A1138 CrossRef.
- G. Kresse and J. Hafner, Phys. Rev. B: Condens. Matter Mater. Phys., 1993, 47, 558–561 CrossRef CAS.
- G. Kresse and J. Hafner, Phys. Rev. B: Condens. Matter Mater. Phys., 1994, 49, 14251–14269 CrossRef CAS.
- G. Kresse and J. Furthmüller, Comput. Mater. Sci., 1996, 6, 15–50 CrossRef CAS.
- P. E. Blöchl, Phys. Rev. B: Condens. Matter Mater. Phys., 1994, 50, 17953–17979 CrossRef.
- J. P. Perdew, K. Burke and M. Ernzerhof, Phys. Rev. Lett., 1996, 77, 3865–3868 CrossRef CAS PubMed.
- G. K. H. Madsen and D. J. Singh, Comput. Phys. Commun., 2006, 175, 67–71 CrossRef CAS.
- B. L. Huang and M. Kaviany, Phys. Rev. B: Condens. Matter Mater. Phys., 2008, 77, 125209 CrossRef.
- L. Q. Xu, Y. P. Zheng and J. C. Zheng, Phys. Rev. B: Condens. Matter Mater. Phys., 2010, 82, 195102 CrossRef.
- J. J. Pulikkotil, D. J. Singh, S. Auluck, M. Saravanan, D. K. Misra, A. Dhar and R. C. Budhani, Phys. Rev. B: Condens. Matter Mater. Phys., 2012, 86, 155204 CrossRef.
- A. J. Hong, L. Li, H. X. Zhu, Z. B. Yan, J. M. Liu and Z. F. Ren, J. Mater. Chem. A, 2015, 3, 13365–13370 CAS.
- V. K. Gudelli, V. Kanchana, G. Vaitheeswaran, A. Svane and N. E. Christensen, J. Appl. Phys., 2013, 114, 223707 CrossRef.
- Y. Q. Cai, G. Zhang and Y. W. Zhang, J. Am. Chem. Soc., 2014, 136, 6269–6275 CrossRef CAS PubMed.
- J. Bardeen and W. Shockley, Phys. Rev., 1950, 80, 72–80 CrossRef CAS.
- J. Callaway, Phys. Rev., 1959, 113, 1046–1051 CrossRef CAS.
- E. S. Toberer, A. Zevalkink and G. J. Snyder, J. Mater. Chem., 2011, 21, 15843–15852 RSC.
- E. Francisco, J. M. Recio, M. A. Blanco, A. M. Pendás and A. Costales, J. Phys. Chem. A, 1998, 102, 1595–1601 CrossRef CAS.
- J. Yan, P. Gorai, B. Ortiz, S. Miller, S. A. Barnett, T. Mason, V. Stevanović and E. S. Toberer, Energy Environ. Sci., 2015, 8, 983–994 Search PubMed.
- Y. Du, G. Z. Xu, X. M. Zhang, Z. Y. Liu, S. Y. Yu, E. K. Liu, W. H. Wang and G. H. Wu, Europhys. Lett., 2013, 103, 37011 CrossRef.
- L. R. Testardi, T. Wakiyama and W. A. Royer, J. Appl. Phys., 1977, 48, 2055–2061 CrossRef CAS.
- S. Ohshima, H. Ishida, T. Wakiyama and K. Okuyama, Jpn. J. Appl. Phys, 1989, 28, 1362–1366 CrossRef.
- A. Bansil, S. Kaprzyk, P. E. Mijnarends and J. Tobola, Phys. Rev. B: Condens. Matter Mater. Phys., 1999, 60, 13396–13412 CrossRef CAS.
- F. D. Murnaghan, Proc. Natl. Acad. Sci. U. S. A., 1944, 30, 244–247 CrossRef CAS.
- F. Birch, Phys. Rev., 1947, 71, 809–824 CrossRef CAS.
- I. Galanakis, Ş. Tırpancı, K. Özdoğan and E. Şaşıoğlu, Phys. Rev. B, 2016, 94, 064401 CrossRef.
- A. J. Hong, L. Li, R. He, J. J. Gong, Z. B. Yan, K. F. Wang, J. M. Liu and Z. F. Ren, Sci. Rep., 2016, 6, 22778 CrossRef CAS PubMed.
- Q. Y. Xue, H. J. Liu, D. D. Fan, L. Cheng, B. Y. Zhao and J. Shi, Phys. Chem. Chem. Phys., 2016, 18, 17912–17916 RSC.
- S. D. Guo, RSC Adv., 2016, 6, 47953–47958 RSC.
- Vikram, J. Kangsabanik, Enamullah and A. Alam, J. Mater. Chem. A, 2017, 5, 6131–6139 CAS.
- W. F. Li, G. Yang and J. W. Zhang, J. Phys. D: Appl. Phys., 2016, 49, 195601 CrossRef.
|
| This journal is © The Royal Society of Chemistry 2017 |
Click here to see how this site uses Cookies. View our privacy policy here. 
 Open Access Article
 This Open Access Article is licensed under a
  *
*
 ,
,  , and
, and  are the effective masses along the x, y and z directions, respectively. With f0 standing for the equilibrium Fermi–Dirac distribution function, µ representing the chemical potential, and vk denoting the group velocity at state k, the Seebeck coefficient S is in the form of
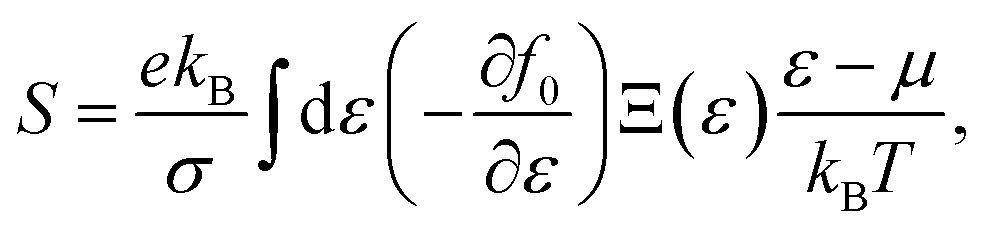
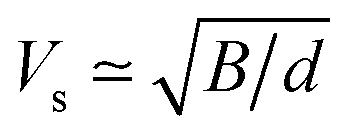 with B and d respectively denoting the bulk modulus and density. The optical phonon modes can be described as33