 Open Access Article
Fabrication of nanoporous copper with tunable ligaments and promising sonocatalytic performance by dealloying Cu–Y metallic glasses†
Ning Wang,
Ye Pan *,
Shikai Wu,
Enming Zhang and
Weiji Dai
School of Materials Science and Engineering, Southeast University, Jiangsu Key Laboratory for Advanced Metallic Materials, Nanjing 211189, P. R. China. E-mail: panye@seu.edu.cn; Fax: +86 25 52090681; Tel: +86 25 52090681
First published on 6th September 2017
Abstract
Nanoporous copper (NPC) with tunable ligaments was prepared by dealloying Cu–Y binary amorphous ribbons in sulfuric acid (H2SO4) solution. The ligament size of the NPC sample synthesized by dealloying Cu58Y42 metallic glasses (237 nm) is much smaller than the one by dealloying Cu72Y28 (406 nm). This result reveals that the microstructure of NPC can be strongly influenced by the alloy composition of precursor alloys. Then, NPC with different microstructures were applied in the sono-catalytic degradation of methyl orange (MO) dye. NPC produced by dealloying Cu58Y42 metallic glasses displayed superior sonocatalytic activity compared to commercial copper foil and the sample by dealloying Cu72Y28. The mechanism of the sono-Fenton-like process of NPC can be explained by being due to a combination of Cu ligament, H2O2 and ultrasound. In addition, the influence of the dealloying conditions (acid concentration, temperature and leaching time) on the ligament size of NPC was evaluated comprehensively, which could provide meaningful insight for further fabricating NPC with more desirable morphology and higher catalytic activity.
Introduction
Textile industry wastewater with large amounts of diverse dyes can cause serious environmental problems.1–5 Thus, it is necessary to decompose these dyes to an acceptable level before they are discharged into the environment. As the most popular approach used for dye degradation, the advanced oxidation process (AOP) is proposed to solve this problem.6–9 Hydroxyl radicals (˙OH) produced in this process can effectively degrade organic dye owing to their strong oxidizing and non-selective nature.10–12 Among all AOPs, a photocatalytic method is usually adopted to produce reactive species with the purpose of removing contaminants from water.13,14 However, it is difficult to decompose the opaque or translucent dye wastewater by light irradiation because the penetrating ability of the light is limited, it is too hard for the light to penetrate such solutions, thus leading to low penetrating depth (only several millimeters).1,15 Considering the advantage of having strong penetrating ability for any medium,16 the ultrasonic irradiation is introduced. The ultrasound process has been considered as an advanced technology since 1990, which can operate easily and degrade non-transparent or low-transparent dyes availably.17,18 The main mechanism of ultrasonic process can be understood based on the acoustic cavitations, which involve the formation (nucleation), growth (expansion) and collapse (implosion) of cavitation bubbles.19–21 Among them, implosive collapse of cavitation bubbles can produce local “hot spots” with high temperatures (several thousand K) and high pressures (some 10 Mpa).20,22–25 As a result, water (H2O) molecules are cleaved to highly reactive hydroxyl radicals (˙OH).26–28 Nevertheless, the number of ˙OH generated by the pyrolysis of H2O is limited. To produce more ˙OH, there should be some catalysts in the degradation process, which can act as the nucleus of cavitation bubbles.29–31 In view of this, a high efficient sono-Fenton-like process, namely, a combination of ultrasound and hydrogen peroxide (H2O2) with transition metal was carried out. The Fenton system uses transition metal or transition metal ions to react with hydrogen peroxide, producing hydroxyl radicals to decompose the organic compounds.32 However, traditional metal foil has a very small specific surface area, leading to low catalytic activity, and metal powder is hard to be recycled, which requires much effort for separation. Therefore, fabrication of a catalytic material with both large specific surface area and high recovery is necessary. Nanoporous metal has recently attracted more and more interest due to unique three-dimensional (3D) bi-continuous ligament-channel structure, which has shown promising application in a wide variety of fields of catalysis, sensors, actuators, fuel cells, microfluidic flow controllers and surface plasmon resonance,33–38 etc. Compared with the powder, the nanoporous material can connect all the fine ligaments into one complete set, which is very favorable for its recovery. Moreover, 3D bi-continuous nanostructure indicates that nanoporous metal has enhanced catalytic activity owing to its large special surface area. Consequently, nanoporous metals can be a good choice to construct sono-Fenton-like catalytic system.Dealloying,39 a simple chemical process of selective dissolution of the less noble elements out of a precursor alloy, has been demonstrated to be a promising strategy for fabricating nanoporous metals. Compared to crystalline alloys, metallic glasses were regarded as the more ideal precursors. It is because that the metallic glasses are free from crystallographic defects (mostly grain boundaries, dislocations and segregations) and exhibit a unique disordered atomic structure,40,41 which is conducive to preparing uniform nanoporous material. Rizzi42 have synthesized monolithic nanoporous gold (NPG) with a ligament size of 100–130 nm through dealloying of a Au40Cu28Si20Ag7Pd5 glassy alloys. Jin43 have fabricated homogeneous nanoporous silver (NPS) with tunable ligament sizes (30–90 nm) via chemical dealloying Ag60.5Ca39.5 amorphous ribbons. Dan44 have prepared uniform nanoporous copper (NPC) with the ligament width of 46–338 nm by dealloying Cu–Ti metallic glasses. The results suggest that amorphous alloys are readily available for synthesizing uniform nanoporous metals by dealloying.
In this work, nanoporous copper (NPC) with tunable ligament sizes has been prepared by dealloying Cu100−xYx (x = 28 and 42 at%) binary metallic glasses in dilute H2SO4 solution (the alloy compositions are chosen near eutectic points to aim at obtaining the fully amorphous45). Novel Cu–Y binary metallic glasses are very ideal precursors for dealloying from an electrochemical perspective: the standard electrode potentials of Y and Cu differ as much as 2.714 V (−2.372 V vs. the standard hydrogen electrode (SHE) for Y/Y3+ and 0.342 V vs. SHE for Cu/Cu2+), which promises to be a large driving force for selective leaching of Y from Cu–Y amorphous alloys in dilute H2SO4 solution. Then, NPC with different microstructures were applied in the sono-catalytic degradation of methyl orange (MO) dye. The objectives were to investigate the relationship between the structure of NPC and corresponding sono-Fenton-like catalytic properties, and understand the effects of dye concentration, temperature and output power on MO degradation in the presence of NPC. In addition, the influences of the acid concentration, temperature and leaching time on the ligament size of NPC were evaluated systematically, which could provide abundant information and lay a theoretic basis for further designing NPC with more suitable ligament size and higher catalytic activity. To the best of our knowledge, there is no report about the effect of the ligament size of NPC on its sono-Fenton-like catalytic performance and the fabrication of Cu–Y binary metallic glasses has not been reported so far.
Experimental
Synthesis
The ingots of Cu100−xYx (x = 28 and 42 at%) were prepared by arc melting a mixture of pure Cu and Y elements with purities above 99.99% in a Ti-gettered argon atmosphere, followed by a single roller spinning to obtain amorphous ribbons with a width of 2 mm and a thickness of 20–30 μm.Chemical dealloying Cu–Y amorphous ribbons was performed in dilute H2SO4 aqueous solution. In order to evaluate the effect of chemical composition on the morphologies of the resulting NPC, Cu72Y28 and Cu58Y42 glassy ribbons were used, they were dealloyed in 1 M H2SO4 solution at 333 K for 90 min. Moreover, the different concentration of H2SO4 electrolytic solution was adopted to estimate the influence of acid concentration on the microstructure of NPC, i.e. 0.2, 0.4, 1, 2 M, respectively. Cu58Y42 amorphous ribbons were leached in the acid solution with the difference concentration at 323 k for 90 min. Besides, the effect of temperature on the ligament growth of NPC obtained from Cu58Y42 glassy ribbons was investigated by leaching them in 1 M H2SO4 aqueous solution for 90 min at various temperatures of 323, 333 and 343 K. Furthermore, the influence of immersion time on nanoporous structure was also studied. Cu58Y42 amorphous ribbons were leached in 1 M H2SO4 electrolytic solution at 333 K for different immersion time (60, 120 and 240 min). After dealloying, all the ribbons were rinsed with distilled water and dehydrated alcohol, then kept in vacuum chamber until characterizations.
Characterization
The phase composition of the as-spun and as-dealloyed ribbons was characterized by X-ray diffraction (XRD) using a D8-Discover diffractometer with Cu-Kα radiation (λ = 1.5406 Å), the accelerating voltage and the applied current were 30 kV and 20 mA, respectively. The microstructures of obtained NPC specimens were investigated by FEI-3D scanning electron microscopy (SEM) operating with an accelerating voltage of 10 kV, and transmission electron microscopy (TEM) using a G2-20 instrument operating at 300 kV. The size of the ligament was statistically measured by a single length chord method over 200 sites of SEM morphologies. In addition, a Quantachrome Autosorb-IQ2 analyzer was used to measure the specific surface area (SBET) of the NPC samples.Sonocatalytic measurements
The sonocatalytic activities of the samples were estimated by the degradation of MO. The initial MO concentration was 20 mg L−1. In this experiment, 100 mL MO solution, 50 mg catalyst of NPC and 0.5 mL 30 wt% hydrogen peroxide (H2O2) were put into a 250 mL erlenmeyer flask. Then, the degradation reactions were conducted in a serial-ultrasonic apparatus (KH-300DB, Kunshan Ultrasonic Apparatus Company, China) with a frequency of 40 kHz and output power of 4800 mW cm−2 at 333 K. Prior to irradiation, the whole suspension was stirred for 30 min to ensure the establishment of the adsorption–desorption equilibrium. Afterwards, 3 mL of the suspension was extracted every 5 min during the sonocatalytic process to test the residual concentrations of MO. The concentration of MO solution was evaluated by measuring the change in maximum absorbance through TU-1810 UV-vis spectrophotometer. The absorbance peak at 464 nm was selected, and the residual concentration was obtained by evaluating the intensity ratio between the residual and original MO solutions.Results and discussion
Effects of alloy compositions on the microstructure of NPC
Fig. 1a shows XRD patterns of Cu100−xYx (x = 28 and 42 at%) ribbons. The ribbons all present a broad diffraction peak in their patterns corresponding to a fully amorphous structure. Fig. 1b displays the XRD patterns of Cu–Y amorphous ribbons subjected to immersion in 1 M H2SO4 solution at 333 K for 90 min. It can be seen that the characteristic broad patterns of the samples disappear completely and crystalline diffraction peaks of (111), (200) and (220) appear significantly. All these peaks can be indexed to face centered cubic copper (fcc Cu) with lattice parameter of a = 3.615 Å (JCPDS card no. 04-0836).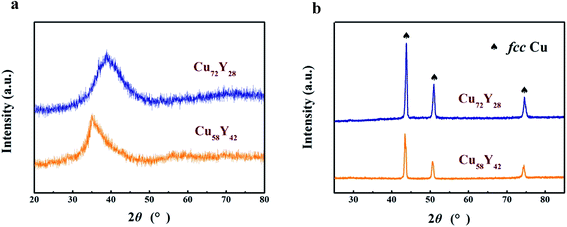 | ||
| Fig. 1 XRD patterns of (a) Cu–Y binary metallic glasses and (b) the corresponding samples after dealloying in 1 M H2SO4 aqueous solution at 333 K for 90 min. | ||
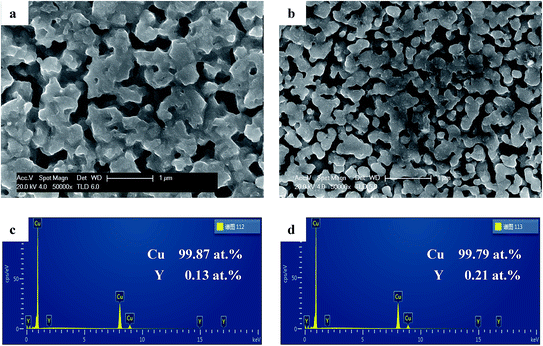
Fig. 2a and b presents the SEM images of the samples by dealloying Cu–Y binary metallic glasses (Cu72Y28 and Cu58Y42) in 1 M H2SO4 aqueous solution at 333 K for 90 min. The samples exhibited uniform 3D bi-continuous nanostructure. Combining this with the results of XRD can confirm that NPC has been successfully synthesized. For convenience, the NPC samples prepared by dealloying Cu72Y28 and Cu58Y42 metallic glasses are denoted as the NPC-72 and NPC-58 sample, respectively. It is observed that the ligament size of the NPC-58 sample (237 nm) is much smaller than that of NPC-72 (406 nm). This is because that the increase in Cu content favors the growth of ligaments.46 The results reveal that the microstructure of NPC can be strongly influenced by the alloy compositions of precursor alloys. In addition, the EDS results (Fig. 2c–d) show that the alloy compositions of the dealloying samples consist almost entirely of Cu element, implying that Y has been completely leached out of the precursors and Cu remains to form a framework of the resulting nanoporous structure. The results are in accordance with the results of XRD.
Fig. 3a and b depicts the TEM images of the NPC samples. The bi-continuous pore-to-ligament structure is clearly visible. It can also be seen that the NPC-58 sample has much finer ligament structure than NPC-72, which agrees well with SEM images. In general, material with finer microstructure possesses larger specific surface area. Therefore, the specific surface area of the NPC-58 sample is much larger than that of NPC-72 (confirmed by BET method and displayed in Table 1). The HRTEM lattice fringe images of the NPC samples can be observed in Fig. 3c and d. The interplanar spacing of the samples is determined to be 0.209 nm, which is associated with the {111} planes of fcc Cu.
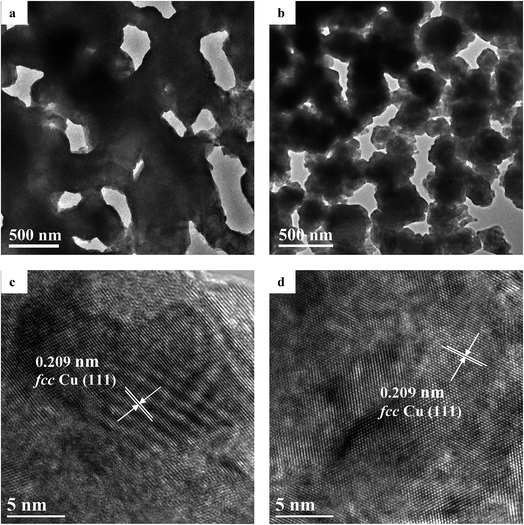 | ||
| Fig. 3 TEM images of the samples: (a) NPC-72; (b) NPC-58. HRTEM lattice fringe images of the samples: (c) NPC-72; (d) NPC-58. | ||
| Samples | d (nm) | SBET (m2 g−1) | Vp-total (cm3 g−1) |
|---|---|---|---|
| NPC-72 | 406 ± 36.6 | 1.88 ± 0.51 | 0.048 |
| NPC-58 | 237 ± 24.3 | 3.84 ± 0.94 | 0.072 |
Sonocatalytic activities
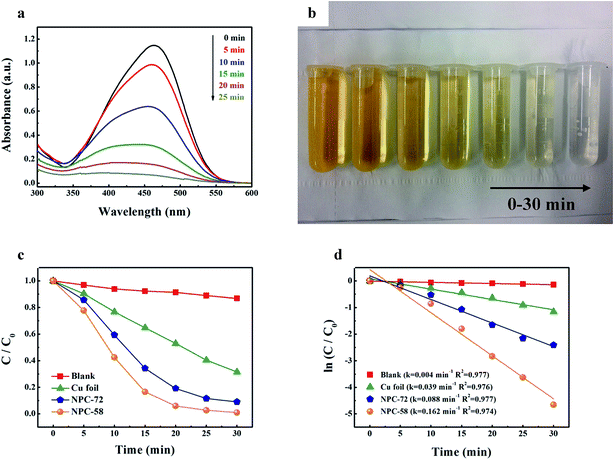
The experiment of sonocatalytic degradation of methyl orange (MO) dye was carried out to explore the catalytic performance of NPC. The temporal absorption spectral changes of MO dye in sono-degradation over the NPC-72 sample are shown in Fig. 4a. The result demonstrates that the intensity of the peak decreases quickly with the increasing of irradiation time, which implies that MO can be effectively decomposed by NPC. Fig. 4b is the image of the solution under ultrasound irradiation for different time. The solution was gradually faded with increasing the reaction time and it was similar to water when the irradiation sustain for 30 min. Wang47 reported sonocatalytic degradation of methyl orange in the presence of TiO2 catalysts, the MO dye was decomposed within 150 min. In this experiment, the degradation of MO can be finished within 30 min, suggesting that NPC is much more efficient for sonocatalytic degradation than traditional catalyst (e.g., TiO2). Fig. 4b shows MO degradation rate as a function of reaction time. The MO solution with commercial copper foil degraded at a relative slow rate, only 35.2% was degraded within 15 min (t1/2 of 30 min), while 65.7% and 83.4% of MO was decomposed over the NPC-72 and NPC-58 sample, respectively, which reveals that the sonocatalytic performance of NPC is much better than that of copper foil. The enhanced catalytic performance of NPC can be ascribed to 3D bi-continuous nanoporous structure, fine Cu ligaments with good dispersion and large special surface area. Thus, NPC can be a very ideal choice to construct sono-Fenton-like catalytic system. In Fig. 4c, a linear relationship between ln(C/C0) and irradiation time suggests that the sonocatalytic degradation process obeys pseudo-first-order kinetics. The values of the reaction rate constant can be calculated based on the Langmuir–Hinshelwood model:49,50| ln(C/C0) = −kt | (1) |
Fig. 5 displays the effects of dye concentration, solution pH, temperature and ultrasonic power on the degradation rate of the NPC-72 sample. To investigate the influence of initial dye concentration on the degradation rate of MO, three different concentrations were selected (10, 20, 40 mg L−1), while keeping constant solution pH (pH = 6), temperature (333 K) and output power (4800 mW cm−2). From Fig. 5a, it is observed that 91.2%, 65.8% and 34.9% of MO was decomposed after 15 min for dye concentration of 10, 20, 40 mg L−1, respectively, the degradation rate of MO decreases obviously with increasing in initial dye concentration. This is because more MO molecules can be adsorbed on the surface of the Cu ligaments with an increase in dye concentration, which had to be degraded by the constant amount of the reactive radicals (˙OH). Furthermore, the increased dye adsorption is expected to reduce the adsorption of hydrogen peroxide (H2O2) on the catalyst surface. Consequently, little H2O2 is available for sono-Fenton-like process to generate ˙OH, leading to low degradation rate. The results suggest that organic dye with low initial concentration is favored for its sono-catalytic degradation process.
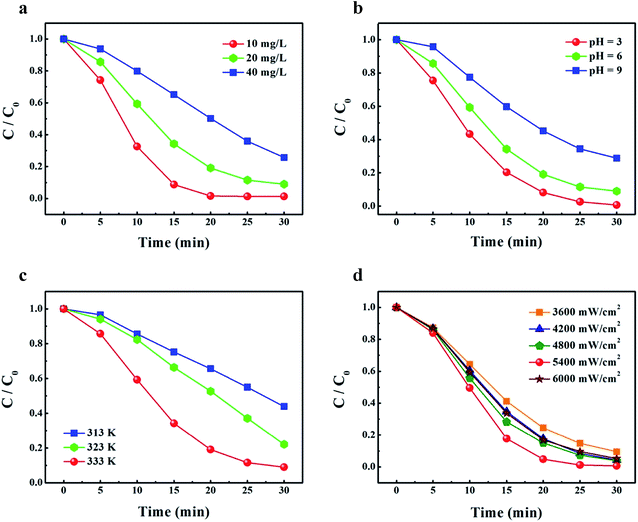 | ||
| Fig. 5 The effects of (a) dye concentration, (b) pH, (c) temperature and (d) output power on the degradation of MO in the presence of the NPC-72 sample. | ||
Another significant parameter in sono-Fenton-like process for dye degradation is solution pH. The influence of the pH of MO solution on its sonocatalytic degradation was studied and the data are shown in Fig. 5b. For these experiments, the initial dye concentration was set to 20 mg L−1, solution temperature and the output power of the ultrasonic generator set to 333 K and 4800 mW cm−2, respectively. It can be seen that the highest degradation efficiency is obtained at the lowest pH value and the degradation rate of MO decreases with the increase of solution pH. This phenomenon can be attributed to the three points: (1) the surface of the catalyst is positively charged at low pH value, it is easily capable of adsorbing MO which have a negative charge, hence more dye molecules can be degraded by ˙OH;47 (2) the number of ˙OH increases on the surface of the catalyst with decreasing of the pH;47 (3) the ˙OH/H2O redox pair oxidation potential increases from 1.65 to 2.59 versus the normal hydrogen electrode (NHE) with decreasing pH value, suggesting that the oxidation potential of ˙OH in acidic medium is much higher than that in alkaline medium.48
The temperature is also an important parameter, which can affect dye sono-degradation efficiency significantly. In view of this, the effect of the temperature on the degradation of MO was investigated in Fig. 5c. The temperature of the mixed solution was adjusted over a range of values (313, 323 and 333 K), and the initial concentration of the dye, solution pH and the power of the ultrasonic generator were set to 20 mg L−1, pH = 6 and 4800 mW cm−2, respectively. The degradation rate of MO can be evaluated to 24.7%, 33.6% and 65.8% for the temperature at 313, 323, 333 K, respectively. Obviously, raising temperature led to the increase of the reaction rate. This can be easily understood if considering the relation between reaction rate and temperature, which usually follows the Arrhenius relationship.52,53
Ultrasonic power is a very important parameter that affects dye degradation. For this reason, the influence of ultrasonic power on the degradation of MO was investigated. The sonocatalytic degradation experiments were conducted by varying output power from 3600 to 6000 mW cm−2 while keeping dye concentration at 20 mg L−1, solution pH at 6 and temperature at 333 K. Fig. 5d shows that the degradation rate of MO increase with enhancing output power of ultrasonic generator ranged from 3600 to 5400 mW cm−2. This is because more energy was dissipated to the system by improving output power, which can increase the number of cavitation bubbles. The more presence of collapsing bubbles led to the formation of a greater number of active ˙OH. However, further enhancement of output power above 5400 mW cm−2 can reduce MO degradation rate, and the degradation rate at output power of 6000 mW cm−2 is even lower than that at 4800 mW cm−2. This can be related to the effects of annihilation of ˙OH, which is caused by the increased probability of collision for excessive dosage of ˙OH. The results indicate that there exists an optimum ultrasonic output power for sono-Fenton-like system to degrade MO dye effectively.
The sonocatalytic process of NPC can be explained as a combination of Cu ligament, H2O2 and ultrasound (sono-Fenton-like process6,48). Under ultrasonic radiation, the ligaments of NPC will react with H2O2 to generate hydroxyl radicals (˙OH) and Cu+, then the resulting Cu+ will further react with H2O2 to form ˙OH and Cu2+. Meanwhile, Cu2+ and Cu+ will combine with electrons (e−) in the solution to be reduced back to Cu+ and Cu, respectively, thereby allowing the sono-Fenton-like process to be repeated. Finally, ˙OH produced by sono-Fenton-like process resolves MO dye molecules into H2O, CO2 and inorganic species. The relevant reaction equations can be described as:6,54,55
| H2O + ))) (ultrasound) → ˙OH + ˙H | (2) |
| H2O2 + ))) (ultrasound) → 2˙OH | (3) |
| Cu ligament + H2O2 + H+ + ))) (ultrasound) → ˙OH + H2O + Cu+ | (4) |
| Cu+ + H2O2 + H+ + ))) (ultrasound) → ˙OH + H2O + Cu2+ | (5) |
| Cu2+ + e− → Cu+ | (6) |
| Cu+ + e− → Cu | (7) |
| ˙OH + MO → H2O + CO2 + inorganic species | (8) |
Relationship between dealloying conditions and ligament size of NPC
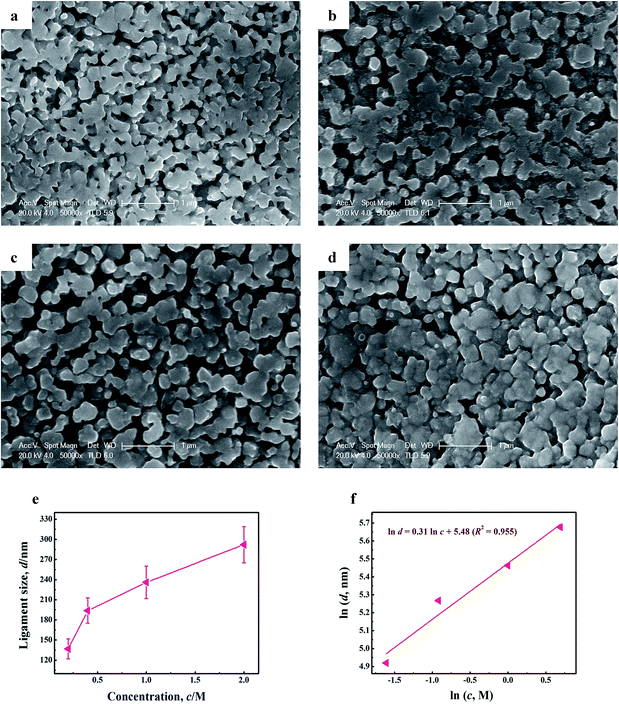
3D bi-continuous NPC with different microstructures have been successfully applied in the sono-catalytic degradation of MO. The one with finer Cu ligaments and larger special surface area exhibited enhanced sono-Fenton-like catalytic properties. The result implies that NPC with superior catalytic activity can be obtained by tuning alloy composition of amorphous precursors. Nevertheless, adjusting the structure of NPC by methods of changing alloy composition of amorphous precursors is inconvenient because the preparation of glassy precursors can be affected by many uncontrolled factors.56,57 Therefore in order to design NPC with more suitable ligament size and higher catalytic activity, the influences of the dealloying conditions (acid concentration, temperature and leaching time) on the ligament size of NPC were evaluated systematically.Fig. 6a–d depicts the SEM images of the samples by dealloying Cu58Y42 metallic glasses at 323 K for 90 min in H2SO4 aqueous solution with different concentration (0.2, 0.4, 1 and 2 M). An open bi-continuous interpenetrating nanoporous structure was formed on a large scale. It can be seen that the ligament size of NPC can coarsen from 137 to 292 nm with increase in the acid concentration (shown in Fig. 6e), implying that the morphology of NPC can be tuned by controlling the acid concentration. In addition, a linear correlation between ln![[thin space (1/6-em)]](https://www.rsc.org/images/entities/char_2009.gif) d and ln
d and ln![[thin space (1/6-em)]](https://www.rsc.org/images/entities/char_2009.gif) c can be established as ln
c can be established as ln![[thin space (1/6-em)]](https://www.rsc.org/images/entities/char_2009.gif) d = 0.31 ln
d = 0.31 ln![[thin space (1/6-em)]](https://www.rsc.org/images/entities/char_2009.gif) c + 5.48 (R2 = 0.955) in Fig. 6f, the relationship built will give a constructive reference for the optimization of the ligament size of NPC.
c + 5.48 (R2 = 0.955) in Fig. 6f, the relationship built will give a constructive reference for the optimization of the ligament size of NPC.
The coarsening behavior of NPC can be described as solid–liquid interface diffusion mechanism, similar to the isothermal grain growth in polycrystalline materials.58 Hence, the relationship between dealloying conditions (temperature T, immersion time t) and ligament size d of NPC can be modelled with the following equation:59
| dn = KtDs | (9) |
 | (10) |
 | (11) |
According to eqn (11), the formula can be further deduced as:
 | (12) |
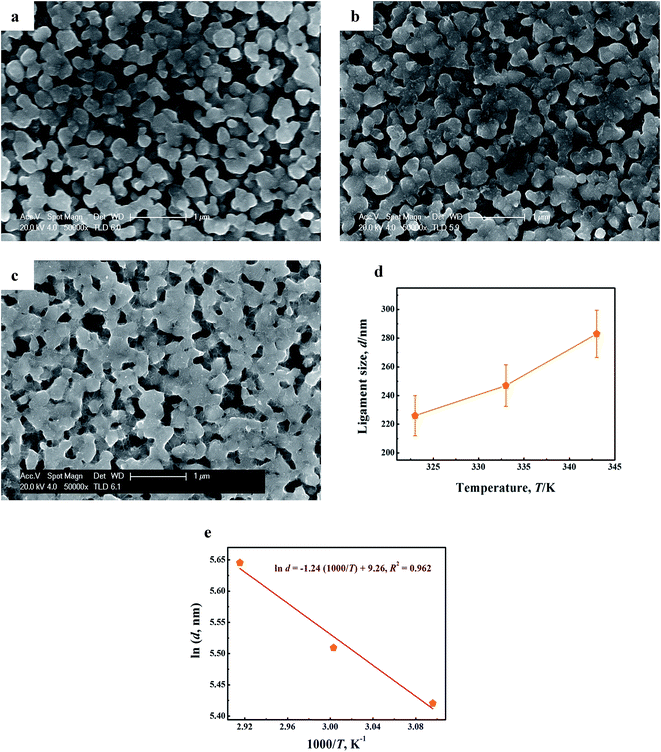
Fig. 7a–c presents the SEM images of the samples by dealloying Cu52Y28 metallic glasses in 1 M H2SO4 aqueous solution for 90 min at various temperatures (323, 333 and 343 K). The typical 3D bi-continuous NPC can be produced in all range of temperature. In Fig. 7d, it is observed that the ligament size of NPC increases from 226 to 283 nm, which exhibits a significant dependence with the temperature. This is because that high temperature can improve the thermal diffusion of Cu atoms at the precursor/solution interface so as to accelerate the ligament growth of NPC.62 Moreover, a linear correlation [ln![[thin space (1/6-em)]](https://www.rsc.org/images/entities/char_2009.gif) d = −1.24 (1000/T) + 9.26, R2 = 0.962] can be fitted in Fig. 7e, which means that the influence of reaction temperature on coarsening behavior of NPC can be well described by eqn (12). According to this fitting, the value of −Ea/1000nR was estimated as −1.24.
d = −1.24 (1000/T) + 9.26, R2 = 0.962] can be fitted in Fig. 7e, which means that the influence of reaction temperature on coarsening behavior of NPC can be well described by eqn (12). According to this fitting, the value of −Ea/1000nR was estimated as −1.24.
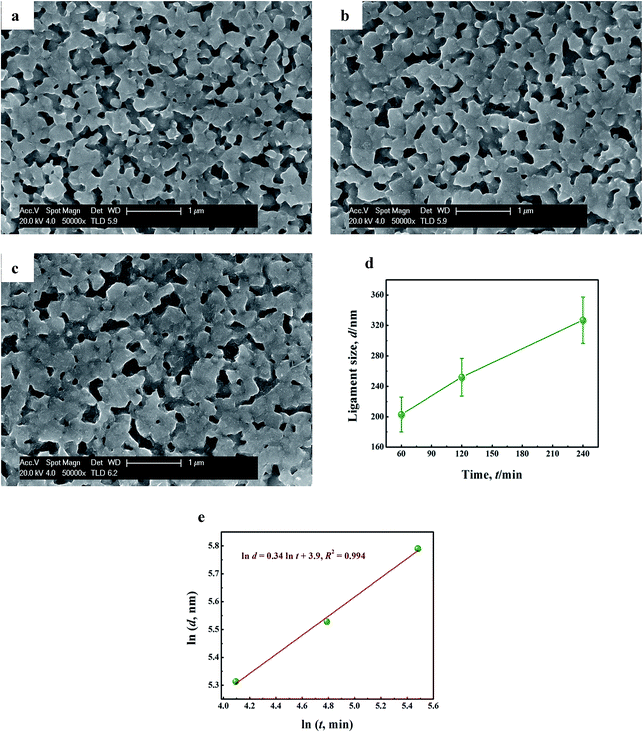
Fig. 8a–c displays the SEM images of the samples by dealloying Cu58Y42 metallic glasses in 1 M H2SO4 aqueous solution at 333 K for various immersion time (60, 120 and 240 min). Similar bi-continuous nanoporous morphologies of NPC are observed. It is noticed that the ligament coarsening is very apparent (from 203 to 327 nm) with the prolongation of leaching time (shown in Fig. 8d), which suggests that the size of ligament strongly depends on the immersion time. Besides, a good linear fitting [ln![[thin space (1/6-em)]](https://www.rsc.org/images/entities/char_2009.gif) d = 0.34 ln
d = 0.34 ln![[thin space (1/6-em)]](https://www.rsc.org/images/entities/char_2009.gif) t + 3.9, R2 = 0.994] was observed in Fig. 8e, thus confirming that the effect of leaching time on ligament growth of NPC can be also described by the diffusion growth model [eqn (12)]. The coarsening exponent n, directly derived by plotting the ln
t + 3.9, R2 = 0.994] was observed in Fig. 8e, thus confirming that the effect of leaching time on ligament growth of NPC can be also described by the diffusion growth model [eqn (12)]. The coarsening exponent n, directly derived by plotting the ln![[thin space (1/6-em)]](https://www.rsc.org/images/entities/char_2009.gif) d vs. ln
d vs. ln![[thin space (1/6-em)]](https://www.rsc.org/images/entities/char_2009.gif) t curves (the reciprocal of the slope in Fig. 8e), was calculated to be 2.941. Combined with previous fitting data (−Ea/1000nR) in Fig. 7e and the values of n, the activation energy (Ea) was deduced to be 30.3 kJ mol−1. The value is too much lower than that of Al–Cu alloy system in NaOH solution (145.3 kJ mol−1),63 indicating that Cu–Y alloy system has great advantages for fabricating NPC rapidly. For Cu58Y42 precursors, lower Ea can be ascribed to high corrosion activity of the less noble element in electrolytes (the activity of Y atoms in H2SO4 aqueous solution is much higher than that of Al atoms in NaOH solution). Based on the above results, it can be seen that the relationships established between the dealloying conditions and ligament size of NPC provides abundant references for the optimization of the morphology of NPC, which is beneficial to the synthesis of NPC with more excellent sono-catalytic activity.
t curves (the reciprocal of the slope in Fig. 8e), was calculated to be 2.941. Combined with previous fitting data (−Ea/1000nR) in Fig. 7e and the values of n, the activation energy (Ea) was deduced to be 30.3 kJ mol−1. The value is too much lower than that of Al–Cu alloy system in NaOH solution (145.3 kJ mol−1),63 indicating that Cu–Y alloy system has great advantages for fabricating NPC rapidly. For Cu58Y42 precursors, lower Ea can be ascribed to high corrosion activity of the less noble element in electrolytes (the activity of Y atoms in H2SO4 aqueous solution is much higher than that of Al atoms in NaOH solution). Based on the above results, it can be seen that the relationships established between the dealloying conditions and ligament size of NPC provides abundant references for the optimization of the morphology of NPC, which is beneficial to the synthesis of NPC with more excellent sono-catalytic activity.
Conclusions
In this work, uniform nanoporous copper (NPC) was developed via chemically dealloying Cu–Y binary metallic glasses. The NPC samples not only exhibited 3D bi-continuous interpenetrating pore-to-ligament nanostructure, but also were found to be highly active for MO degradation. It should be noticed that the NPC-58 sample presented much better sono-catalytic efficiency (k = 0.162 min−1) compared with NPC-72 (k = 0.088 min−1). This result can be caused by larger specific surface area (3.84 m2 g−1), finer bi-continuous Cu ligaments (237 nm) and higher total pore volume (0.072 cm3 g−1) of NPC-58. The sono-Fenton-like process of NPC with desired microstructure has shown great potential in treating dye wastewater. By controlling dealloying conditions (acid concentration, reaction temperature and immersion time) of Cu58Y42 amorphous precursors, the ligament sizes of the resulting NPC were tuned between 137 and 327 nm. The result provides a guide for further designing NPC with more suitable ligaments and higher catalytic activity.Conflicts of interest
There are no conflicts to declare.Acknowledgements
This work was supported by the National Natural Science Foundation of China (Grant No. 51671056) and Jiangsu key laboratory for advanced metallic materials (Grant No. BM2007204).References
- H. B. Zhang, C. S. Wei, Y. Y. Huang and J. Wang, Ultrason. Sonochem., 2016, 30, 61–69 CrossRef CAS PubMed.
- R. Bhavani and A. Sivasamy, Ecotoxicol. Environ. Saf., 2016, 134, 403–411 CrossRef CAS PubMed.
- Y. Jiang, Y. Sun, H. Liu, F. Zhu and H. Yin, Dyes Pigm., 2008, 78, 77–83 CrossRef CAS.
- H. Zhao, G. M. Zhang and Q. L. Zhang, Ultrason. Sonochem., 2014, 21, 991–996 CrossRef CAS PubMed.
- J. Wang, T. Ma, Z. H. Zhang, X. D. Zhang, Y. F. Jiang and Z. J. Pan, Desalination, 2006, 195, 294–305 CrossRef CAS.
- C. K. Wang and Y. H. Shih, Sep. Purif. Technol., 2015, 140, 6–12 CrossRef CAS.
- C. A. Orge, J. J. M. Orfao, M. F. R. Pereira, A. M. Duarte de Farias and M. A. Fraga, Chem. Eng. J., 2012, 200–202, 499–505 CrossRef CAS.
- K. S. Suslick, S. J. Doktycz and E. B. Flint, Ultrasonics, 1990, 28, 280–290 CrossRef CAS PubMed.
- C. Cai, Z. Zhang, J. Liu, N. Shan, H. Zhang and D. D. Dionysiou, Appl. Catal., B, 2016, 182, 456–468 CrossRef CAS.
- R. K. Joshi and P. R. Gogate, Ultrason. Sonochem., 2012, 19, 532–539 CrossRef CAS PubMed.
- M. A. Matouq, Z. A. Al-Anber, T. Tagawa, S. Aljbour and M. Al-Shannag, Ultrason. Sonochem., 2008, 15, 869–874 CrossRef CAS PubMed.
- N. Daneshvar, S. Aber, M. S. Seyed Dorraji, A. R. Khataee and M. H. Rasoulifard, Sep. Purif. Technol., 2007, 58, 91–98 CrossRef CAS.
- R. Saraf, C. Shivakumara, S. Behera, H. Nagabhushana and N. Dhananjaya, Spectrochim. Acta, Part A, 2015, 136, 348–355 CrossRef CAS PubMed.
- A. Turki, C. Guillard, F. Dappozze, Z. Ksibi, G. Berhault and H. Kochkar, Appl. Catal., B, 2015, 163, 404–414 CrossRef CAS.
- M. Zhou, H. Yang, T. Xian, R. S. Li, H. M. Zhang and X. X. Wang, J. Hazard. Mater., 2015, 289, 149–157 CrossRef CAS PubMed.
- Y. L. Min, K. Zhang, Y. C. Chen and Y. G. Zhang, Ultrason. Sonochem., 2012, 19, 883–889 CrossRef CAS PubMed.
- Y. Y. Huang, H. B. Zhang, C. S. Wei, G. S. Li, Q. Wu and J. Wang, Sep. Purif. Technol., 2017, 172, 202–210 CrossRef CAS.
- S. Kaur and V. Singh, Ultrason. Sonochem., 2007, 14, 531–537 CrossRef CAS PubMed.
- C. H. Wang, Y. T. Lin, C. K. Chang and N. Liu, Ultrason. Sonochem., 2013, 20, 970–977 CrossRef PubMed.
- R. Vinu and G. Madras, Environ. Sci. Technol., 2009, 43, 473–479 CrossRef CAS PubMed.
- S. Chong, G. M. Zhang, N. Zhang, Y. C. Liu, J. Zhu and T. Huang, Ultrason. Sonochem., 2016, 32, 231–240 CrossRef CAS PubMed.
- Z. Wu, G. Cravotto, M. Adrians, B. Ondruschka and W. Li, Ultrason. Sonochem., 2015, 27, 148–152 CrossRef CAS PubMed.
- A. Hassani, A. Khataee, S. Karaca, C. Karaca and P. Gholami, Ultrason. Sonochem., 2017, 35, 251–262 CrossRef CAS PubMed.
- K. Suslick, Science, 1990, 247, 1439–1445 CAS.
- E. B. Flint and K. S. Suslick, Science, 1991, 253, 1397–1399 CrossRef CAS PubMed.
- O. Moumeni and O. Hamdaoui, Ultrason. Sonochem., 2012, 19, 404–409 CrossRef CAS PubMed.
- A. Khataee, M. Sheydaei, A. Hassani, M. Taseidifar and S. Karaca, Ultrason. Sonochem., 2015, 22, 404–411 CrossRef CAS PubMed.
- C. Petrier, M. Lamy, A. Francony, A. Benahcene and B. David, J. Phys. Chem., 1994, 98, 1051–1057 CrossRef.
- T. Tuziuti, K. Yasui, M. Sivakumar and Y. Iida, J. Phys. Chem. A, 2005, 109, 4869–4872 CrossRef CAS PubMed.
- Y. Wu, L. Song, S. Zhang, X. Wu, S. Zhang, H. Tian and J. Ye, Catal. Commun., 2013, 37, 14–18 CrossRef CAS.
- H. Sekiguchi and Y. Saita, J. Chem. Eng. Jpn., 2001, 34, 1045–1048 CrossRef CAS.
- E. Neyens and J. Baeyens, J. Hazard. Mater., 2003, 98, 33–50 CrossRef CAS PubMed.
- G. C. Bond and D. T. Thompson, Catal. Rev.: Sci. Eng., 1999, 41, 319–388 CAS.
- T. You, O. Niwa, M. Tomita and S. Hirono, Anal. Chem., 2003, 75, 2080–2085 CrossRef CAS PubMed.
- D. Kramer, R. N. Viswanath and J. Weissmuller, Nano Lett., 2004, 4, 793–796 CrossRef CAS.
- J. R. Weissmueller, N. Viswanath, D. Kramer, P. Zimmer, R. Wuerschum and H. Gleiter, Science, 2003, 300, 312–315 CrossRef CAS PubMed.
- S. H. Joo, S. J. Choi, K. J. Kwa and Z. Liu, Nature, 2001, 412, 169–172 CrossRef CAS PubMed.
- A. Wittstock, V. Zielasek, J. Biener, C. M. Friend and M. Baumer, Science, 2010, 327, 319–322 CrossRef CAS PubMed.
- J. Erlebacher, J. Electrochem. Soc., 2004, 151, C614–C626 CrossRef CAS.
- J. S. Yu, Y. Ding, C. X. Xu, A. Inoue, T. Sakurai and M. W. Chen, Chem. Mater., 2008, 20, 4548–4550 CrossRef CAS.
- A. Inoue, Acta Mater., 2000, 48, 263–279 CrossRef.
- P. Rizzi, F. Scaglione and L. Battezzati, J. Alloys Compd., 2014, 586, S117–S120 CrossRef CAS.
- Y. Jin, R. Li and T. Zhang, Intermetallics, 2015, 67, 166–170 CrossRef CAS.
- Z. H. Dan, F. X. Qin, S. Yamaura, Y. Sugawara, I. Muto and N. Hara, J. Alloys Compd., 2013, 581, 567–572 CrossRef CAS.
- N. Wang, Y. Pan, T. Lu, X. Z. Li, S. K. Wu and J. L. Wu, Appl. Surf. Sci., 2017, 403, 699–706 CrossRef CAS.
- X. K. Luo, R. Li, L. Huang and T. Zhang, Corros. Sci., 2013, 67, 100–108 CrossRef CAS.
- J. Wang, B. D. Guo, X. D. Zhang, Z. H. Zhang, J. T. Han and J. Wu, Ultrason. Sonochem., 2005, 12, 331–337 CrossRef CAS PubMed.
- A. Khataee, P. Gholami, B. Vahid and S. W. Joo, Ultrason. Sonochem., 2016, 32, 357–370 CrossRef CAS PubMed.
- G. Elango and S. M. Roopan, J. Photochem. Photobiol., B, 2016, 155, 34–38 CrossRef CAS PubMed.
- V. Scuderi, G. Amiard, S. Boninelli, S. Scalese, M. Miritello and P. M. Sberna, Mater. Sci. Semicond. Process., 2016, 42, 89–93 CrossRef CAS.
- S. Kumar and A. K. Ojha, J. Alloys Compd., 2015, 644, 654–662 CrossRef CAS.
- Z. Deng, C. Zhang and L. Liu, Intermetallics, 2014, 52, 9–14 CrossRef CAS.
- X. F. Wang, Y. Pan, Z. R. Zhu and J. L. Wu, Chemosphere, 2014, 117, 638–643 CrossRef CAS PubMed.
- P. Vaishnave, A. Kumar, R. Ameta, P. B. Punjabi and S. C. Ameta, Arabian J. Chem., 2014, 7, 981–985 CrossRef CAS.
- J. L. Zhang, F. Chen, B. Z. Tian and L. Z. Wang, Photocatalysis, East China University of Science and Technology Press, Shanghai, 2012 Search PubMed.
- K. Georgarakis, Y. Li, M. Aljerf, D. Dudina, A. LeMoulec and A. R. Yavari, J. Alloys Compd., 2010, 504, S14–S17 CrossRef.
- Y. F. Ma, P. Yu and L. Xia, Mater. Des., 2015, 85, 715–718 CrossRef CAS.
- J. E. Burke, Trans. AIME, 1949, 180, 73–91 Search PubMed.
- L. H. Qian and M. W. Chen, Appl. Phys. Lett., 2007, 91, 083105 CrossRef.
- E. G. Seebauer and C. E. Allen, Prog. Surf. Sci., 1995, 49, 265–330 CrossRef CAS.
- J. M. Dona and J. Gonzalez-Velasco, J. Phys. Chem., 1993, 97, 4714–4719 CrossRef CAS.
- Y. Jin, R. Li, L. Zuo and T. Zhang, J. Alloys Compd., 2017, 695, 1600–1609 CrossRef CAS.
- W. B. Liu, S. C. Zhang, N. Li, J. W. Zheng and Y. L. Xing, Microporous Mesoporous Mater., 2011, 138, 1–7 CrossRef CAS.
Footnote |
| † Electronic supplementary information (ESI) available. See DOI: 10.1039/c7ra08390d |
| This journal is © The Royal Society of Chemistry 2017 |

