
 Open Access Article
 This Open Access Article is licensed under a Creative Commons Attribution-Non Commercial 3.0 Unported Licence
Facile and sensitive chemiluminescence detection of H2O2 and glucose by a gravity/capillary flow and cloth-based low-cost platform†
Huijie Li ,
Dan Wang,
Cuiling Liu,
Rui Liu and
Chunsun Zhang*
,
Dan Wang,
Cuiling Liu,
Rui Liu and
Chunsun Zhang*
MOE Key Laboratory of Laser Life Science, Institute of Laser Life Science, College of Biophotonics, South China Normal University, No. 55, Zhongshan Avenue West, Tianhe District, Guangzhou 510631, China. E-mail: zhangcs@scnu.edu.cn; zhangcs_scnu@126.com; Fax: +86-20-85216052; Tel: +86-20-85217070 ext. 8501
First published on 6th September 2017
Abstract
This paper describes the development of a cloth-based CL strategy that can quantify H2O2 or glucose in a low-cost, easy-to-use, rapid and sensitive manner. Wax screen-printing is applied to fabricate the ultralow-cost cloth-based devices, and thus the as-prepared sensors have a very low cost (about $0.01 per assay). Moreover, an inexpensive CCD camera is used to image the light from the gravity/capillary flow-triggered enzyme-catalysed oxidation of luminol by H2O2. Under optimized conditions, the developed CL platform can fulfill the determination of H2O2, with a linear range of 0.01–10 mM and a detection limit of 9.07 μM. Similarly, glucose can be detected in the range of 0.01–10 mM, with a detection limit of 9.74 μM. Additionally, the RSDs of these two assays are 3.36%, 3.66% and 2.64% for 0.01, 0.1 and 5 mM H2O2, and 3.01%, 2.80% and 3.68% for 0.1, 1 and 5 mM glucose, respectively. Moreover, the devices can maintain ∼95% of their initial response for three weeks, and tolerate a series of interfering species at reasonable concentrations. Therefore, the proposed platform has an acceptable sensitivity, linear range, reproducibility and stability. Finally, this platform is successfully applied to the detection of H2O2 in milk and glucose in human serum.
Introduction
Hydrogen peroxide (H2O2) is often applied for the disinfection of food, beverage packages, instruments and water pools because of its sporicidal and bactericidal properties, which makes it important to measure its residual concentration.1,2 In addition, H2O2 is an essential mediator in many analytical applications including biological, pharmaceutical, clinical, industrial and environmental analyses.1,2 Furthermore, H2O2 is a common intermediate in many biological reactions, and becomes an important parameter for the monitoring of these bio-processes,1,2 such as the oxidization of glucose by glucose oxidase (GOD). As we know, glucose is a major carbohydrate metabolized by animals and plants, and thus its detection is of great importance in many fields ranging from biomedical applications to ecological approaches.3,4 Glucose can be oxidized by oxygen in the presence of GOD, with the production of gluconic acid and H2O2. Therefore, glucose can be measured indirectly by the concentration of the by-product H2O2. Actually, a large number of glucose biosensors have been developed based on the measurement of H2O2.5–10Up to now, much effort has been devoted to the development of rapid and sensitive H2O2 and glucose biosensors based on different analytical principles. And, a variety of detection methods have been explored and applied to the analysis of H2O2 and glucose, such as colorimetry,5 fluorescence,10 electrochemistry,7 photoelectrochemistry,9 chemiluminescence (CL)6,11 and electrochemiluminescence.8 Among them, the CL method is particularly attractive because it possesses excellent compatibility with microfluidic technologies, offers high detectability in low volumes, promises high sensitivity and selectivity with simple instruments, and does not need any light source. So far, a series of CL platforms have been developed for the analysis of H2O2 (ref. 6 and 11–21) or glucose.6,11,22–35 The above-mentioned CL analyses can be performed in large- or micro-scale devices. With respect to their large-scale counterparts, microfluidic CL devices6,11,15,16,19,27–29,32,33,35 usually provide several advantages, such as system integration, rapid analysis speed, low reagent consumption, enhanced ability for parallel processing, and superior control of reaction conditions. However, these microfluidic devices still need relatively expensive substrate materials such as silicon,11 glass,19,27 poly(dimethylsiloxane) (PDMS)15,16,28,33 and poly(methylmethacrylate) (PMMA),29 and complicated chip micromachining/bonding processes for the formation of the enclosed channel. Additionally, most of the devices require the implementation of micro-junction at the channel ends, and one or more external pumps to deliver the solutions. Furthermore, some devices need long reaction microchannels and/or exquisitely-designed micromixers to obtain a better CL assay,11,28,33 with additional difficulties in device design and fabrication. These problems severely limit their use in a facile, low-cost, compact and portable format.
Nowadays, fiber material (paper, cloth and thread)-based microfluidic devices36–38 have attracted more and more attention from scientists in aspects of chemistry, physics, biology, materials and so on. Recently, our group has developed some simple, low-cost microfluidic cloth-based analytical devices (μCADs) for biochemical assays or other applications.39–46 Within these μCADs, colorimetric,39,42 electrochemiluminescence41,43,44 or CL40,46 methods have been applied for determination of H2O2 or glucose. Relative to the two former methods, the CL method indeed exhibits some advantages mentioned above. However, these newly-demonstrated cloth-based CL devices still have some important limitations. For the Guan et al.'s work,40 the corduroy weave cotton cloth with better hydrophilicity is used as the fabrication substrate, and the wax screen-printed μCADs can perform the merely capillary flow-based CL for H2O2 detection. In fact, the natural capillary flow through porous cellulose fiber is often non-controllable and has poor repeatability, and it is difficult for a commonly hydrophilic cloth to realize such flow-based CL assay. Additionally, the detection limit of H2O2 obtained in their μCADs is high up to 460 μM. Theoretically, 1 mol of H2O2 can be produced for every mole of glucose, and thus their μCADs are difficult to perform the assay of low amount of glucose. To partly overcome these limitations, Li et al. have developed a cloth-based CL platform for the glucose measurement.46 Within their work, a desirable hydrophobic barrier is integrated into the flow channel, and the combination of gravity and capillary forces can induce the substrate solution to get across the narrow wax barrier to enter the detection zone, and thus the single device based on the common plain weave cotton cloth can perform the whole CL process involving two steps of enzyme reactions. Because of the use of hydrophobic wax barrier, however, the rate of gravity/capillary flow (GCF) in cloth is very low when the substrate solution flows into the detection zone. Perhaps for this reason, the detection limit of glucose is still high up to 94.8 μM. Of course, it is difficult for such a cloth-based CL strategy to measure H2O2 directly and sensitively. Therefore, it is necessary to develop new cloth-based CL strategies to improve the detection sensitivity of H2O2 and glucose.
Recently, a cloth-based GCF CL method has been demonstrated by our group for the measurement of trivalent chromium (Cr(III)) in water.45 Cr(III) can selectively catalyze the oxidation of luminol by H2O2 in the presence of ethylenediaminetetraacetic acid (EDTA), and thus the sensitive and selective measurement of Cr(III) can be achieved using this GCF CL method. However, such cloth-based CL method is still in its early stage of development. Therefore, there are still pressing needs for the development of new GCF CL methods and applications. The objective of this work is to explore a GCF and cloth-based low-cost platform for facile and sensitive CL detection of H2O2 and glucose. Cloth instead of paper is chosen as the device substrate for the following reasons: cloth is mechanically stronger, more durable, more flexible, better in “wet-strength”, and more efficient in sample delivery and mixing.47 Additionally, cloth is a biodegradable, sustainable and environmentally friendly material. Further, cloth has extremely low cost and is available worldwide; and there is a wide variety of fiber materials available for formation of cloths. It should be noted that the proposed CL is different from the CL on the solid surface reported by Zhang and co-workers.25,27,29,31,48–50 In their works, one or more analytical reagents can be immobilized on a certain solid surface by using the sol–gel,25,29,31,49 glutaraldehyde activation,27 electrostatic48 and coating50 methods. Although these reagent-immobilized CL methods can achieve a good analytical performance, they usually involve a tedious and complex process for preparation of the reagent-containing solid surface, and need one or more bulky and expensive pumps to deliver the solutions. In addition, the CL signal produced on the solid surface is often detected and recorded with a bulky and expensive luminescence analyzer. Therefore, these CL platforms are difficult to be used in economical, practical, or affordable settings. On the contrary, the cloth-based CL platform developed in this work does not require bulky and expensive peripheral equipments, and complicated and time-consuming sensor preparation processes. Thus, it can be operated in an inexpensive, easy-to-use and rapid manner. In addition, the use of two readily available forces-gravity and capillary action enables the proposed cloth-based CL platform to sensitively detect H2O2 and glucose.
For the proposed assay device and method, the wax screen-printing approach was applied to fabricate the very cheap cloth-based devices, and the luminol–H2O2–horseradish peroxidase (HRP)–p-iodophenol (PIP)-based CL system was used for sensitive and selective detection of H2O2. For glucose measurement, glucose was enzymatically oxidized by GOD to gluconic acid and H2O2, and subsequently H2O2 oxidized luminol to produce the blue light in the presence of HRP. It has been shown that the proposed GCF and cloth-based platform could obtain the detection limits of 9.07 μM and 9.74 μM for H2O2 and glucose, respectively. Obviously, such detection limits are much lower than that achieved in our two previous reports.40,46 Finally, the determination of H2O2 or glucose in complex samples has been performed to validate the practicability of the presented method.
Experimental section
Chemicals and materials
Luminol, PIP, dimethyl sulfoxide (DMSO) solution, phosphate buffer solution (PBS, 20×), Tris–HCl buffer solution (TBS) (0.01 M Tris–HCl, 1.0 mM ethylene diamine tetraacetic acid (EDTA), pH 8.0), α-lactose (monohydrate), sucrose (>99%), D-fructose (>99%), sodium phosphate (tribasic, dodecahydrate) (>97%), magnesium sulfate (heptahydrate) (>99%), sodium chloride (>99%), urea acid (UA) (98%), sodium oxalate (>98%), iron(III) nitrate (nonahydrate) (>98%), thiourea (>99%), L-cysteine (>98.5%), reduced glutathione (GSH), zinc chloride (>98%), and vitamin C (Vc) were purchased from Sangon Co. Ltd. (Shanghai, China). H2O2 (>30%, v/v), GOD, HRP, α-D-glucose (anhydrous, 96%), and potassium chloride were bought from Sigma-Aldrich (St. Louis, MO, USA). Lithium lactate (99%), urea (99%), and bilirubin (99%) were obtained from J&K Chemical Ltd. (Beijing, China). Sodium hydroxide (NaOH) was purchased from Guangzhou Chemical Reagent Factory (Guangzhou, China). Iron(II) sulfate (heptahydrate) (99.0%) was bought from Chengdu Aike Da Chemical Reagents Co. Ltd. (Chengdu, China). Calcium chloride (anhydrous) (≥96.0%) was obtained from Chengdu Kelong Chemical Reagents Co. Ltd. (Chengdu, China). p-Acetamidophenol (AP) (≥99.0%) was purchased from Shanghai Rongbai Biological Technology Co. Ltd. (Shanghai, China). White plain weave cotton cloth (∼10.12 mg cm−2, ∼16.85 milligrams per meter of thread, ∼77 threads per inch of width) was purchased from Guangzhou Haiyin Cloth Confluence Co. Ltd. (Guangzhou, China). Whatman chromatography paper #1 was purchased from GE Healthcare World-wide (Shanghai, china). The solid wax crayons (Detong Co., Ltd., Guangzhou, China) and smooth utensil were obtained from a local stationery shop. Clinical human serum samples were supplied by Guangzhou First People's Hospital. Deionized (DI) water (≥18 MΩ, ELGA PURELAB® Option-R15, London, UK) was used to prepare all solutions, and the related solution pH was measured by a PB-10 meter (Sartorius Scientific Instruments (Beijing) Co., Ltd., Beijing, China).Cloth-based device design and sensing principle
The layout for the unfolded cloth-based device is schematically shown in Fig. 1A. It consists of a loading zone (length × width: 4 mm × 4 mm), flow channel (length × width: 20 mm × 3 mm) and detection zone (Φ8 mm). The loading zone is used for the introduction of the CL substrate solution, and its width is somewhat bigger than that of the flow channel, which can meet the requirement of the volume of substrate solution and help to decrease the deviation of the sampling position. The flow channel acts as the achievement of the GCF in cloth, and its design is based on the following consideration: the increase of the size of the channel will increase the consumption of substrate solution, while the decrease in the channel length and/or width adversely affect the formation of the desirable GCF, at least in our present circumstances. To make the test solution spread throughout the detection zone as much as possible (instead of into the GCF channel), the detection zone is designed as a circle 8 mm in diameter.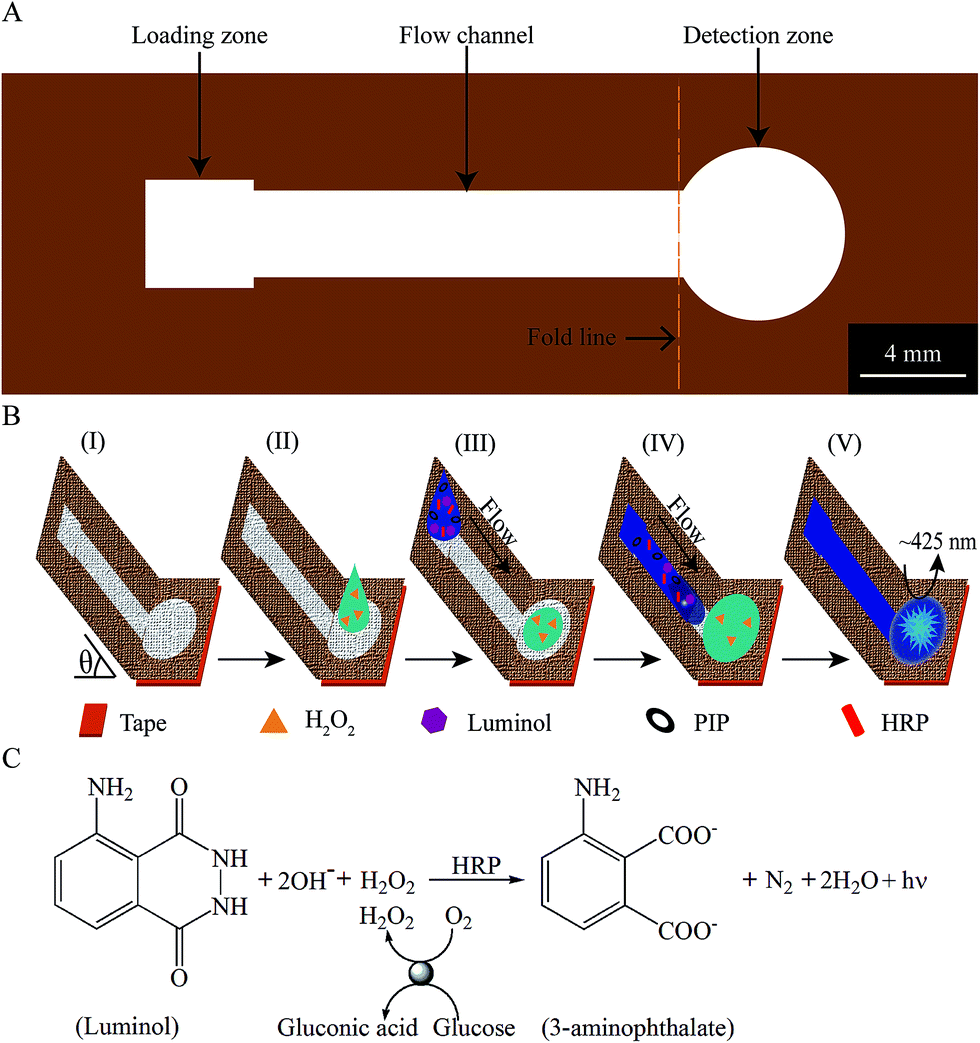 | ||
| Fig. 1 Schematic of the cloth-based device design and sensing principle. (A) The layout for the cloth-based device before folding. It includes a loading zone, flow channel and detection zone. (B) The H2O2 sensing principle using the cloth-based device. (C) The possible reaction mechanism for the H2O2 or glucose sensing. | ||
The principle behind the sensing of H2O2 using the cloth-based device is displayed in Fig. 1B. The cloth-based device is folded in place, and thus the GCF channel is sloped at an appropriate inclination angle (θ) relative to the horizontally placed detection zone whose bottom is covered with a hydrophobic adhesive tape (Fig. 1B(I)). The H2O2-containing test solution is dropped onto the center of the detection zone of the device (Fig. 1B(II)), and it will be evenly distributed over the entire surface of the detection zone under the action of the capillary force of porous fibers. Shortly after that, the substrate solution containing luminol, HRP and PIP is quickly added into the loading zone (Fig. 1B(III)). Under the coupling action of gravity and capillary forces, the substrate solution can rapidly flow in the GCF channel (Fig. 1B(IV)). When it rapidly enters the detection zone and mixes with the test solution, the CL reaction is triggered (Fig. 1B(V)). And, the light-emitting signals that are related to the H2O2 concentrations can be measured. As described previously, the detection of H2O2 is then implemented for the analysis of glucose. Fig. 1C schematically shows the potential reaction mechanism for the H2O2 or glucose sensing.
Cloth-based device fabrication
The wax screen-printing is used to fabricate the unfolded cloth-based devices, and its process is shown in Fig. 2. The patterns and features of the cloth-based device were designed by Adobe Illustrator, and they were then applied to produce the polyester screen (300 mesh) (Lianchang Printing Equipment Shop, Guangzhou, China). The resulting screen was placed on the surface of the appropriately sized cloth piece that was put on a horizontal platform (step 1), and subsequently it was rubbed in turn with a brown crayon and smooth utensil (step 2). The use of smooth utensil enabled more wax to pass through the screen and fill into the cloth. Next, the cloth, together with the screen, was placed onto the heating board (YH-946B, Guangzhou Yihua Electronic Equipments Co., Ltd., Guangzhou, China), and heated at 150 °C for ∼3 s to melt the wax into the cloth to form the hydrophobic barriers (step 3). Finally, the cloth and screen were removed from the heating board (step 4), and separated from each other to form the desired cloth-based devices (step 5). It is noted that the screen could be further heated, and wiped with a cloth to remove the wax residues. In this way, the screen could be reused many times.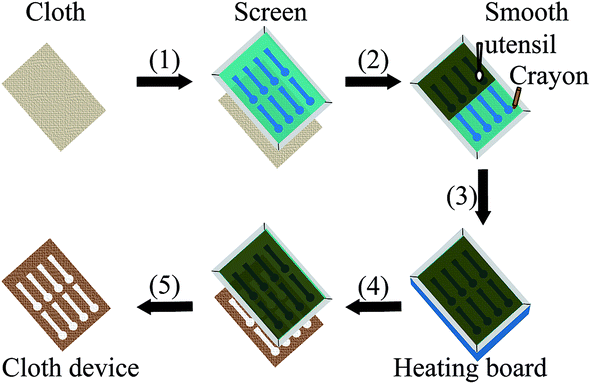 | ||
| Fig. 2 Schematic of the wax screen-printing for fabrication of the unfolded cloth-based devices. (1 and 2) The screen is placed on the cloth, and rubbed with a crayon and smooth utensil in turn. (3) The cloth is placed onto the heating board together with the screen. (4 and 5) The cloth and screen are removed from the heating board, and then separated from each other. | ||
Analytical procedure
After the completion of device fabrication, the cloth-based CL assays could be carried out. A detailed procedure is described as follows. Firstly, the as-fabricated cloth-based device was folded, and fixed on a well-designed plastic support with the help of an adequate low-adhesive double-sided tape. Note that different θ values could be easily and accurately obtained by this home-made folder-type support. Secondly, the support was placed into the cloth-based CL imaging and analysis system, which mainly consists of MC15 charge-coupled device (CCD) camera (Guangzhou Mingmei Technology Co., Ltd., Guangzhou, China), M1614-MP macro lens (Computar, Japan), focus-adjustable bracket, S7650 movable mechanical stage (Taiwan, China), black box and personal computer (PC) (Fig. 3). During this, the detection zone of the device was aligned to the CCD camera, and its image was made clear on the PC screen. Thirdly, unless stated otherwise, 30 μL of H2O2-containing test solution and 35 μL of CL substrate solution were rapidly added onto the detection and loading zones in turn. For the glucose assay, 15 μL of the glucose solution and GOD solution were spotted and mixed on a disposable film for a 5 min of enzymatic reaction, followed by introducing the resulting solution to the detection zone. Finally, the black box was shut, and the CCD automatic imaging function could be used to take the triggered CL images in real time.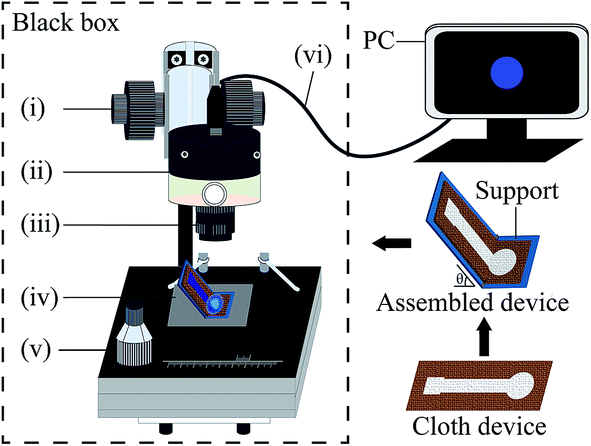 | ||
| Fig. 3 Schematic of the cloth-based microfluidic CL measurement and analysis system. (i) Focus-adjustable bracket; (ii) CCD camera; (iii) macro-lens; (iv) cloth device-containing plastic support; (v) movable mechanical stage; and (vi) USB interface wire. | ||
Data acquisition and analysis
The taken CL images were recorded using the PC and stored into a video data in the WMV format, and the video was then cut into BMP pictures every 100 ms by using the VGIF software (http://video-to-gif.watermark-software.com/). These BMP pictures were processed by the Adobe Photoshop CS4 software, and the acquired TIF batch pictures for each analyte were analyzed by an automated image-processing program which was developed in Matlab R2012a (MathWorks company, USA). As a result, the image with the maximum luminous intensity was easily found. To quantify the analyte, the intensity of each chosen CL image was expressed as the average gray value of the light-emitting region, which was performed in Matlab, and the acquired values were imported into Origin 7.0 (MicroCal Software Inc., MA, USA) for further analysis.Results and discussion
Device fabrication and characterization
Based on the wax screen-printing method developed by our group,42 the proposed cloth-based devices can be well fabricated, and a typical wax screen-printed device is shown in Fig. 4A(I). To probe the device's microscopic characteristics, the SEM images of two functional zones were observed. Fig. 4A(II) and (III) shows the porous structures and microfibers of the pure plain weave cotton cloth (white), which revealed that the bare cloth could offer an excellent hydrophilic micro-environment. However, it can be seen from Fig. 4A(IV) and (V) that the gaps between the cotton fibers and as well the surface of individual fibers were covered by wax, indicating that the wax hydrophobic barrier could be well formed in the cloth.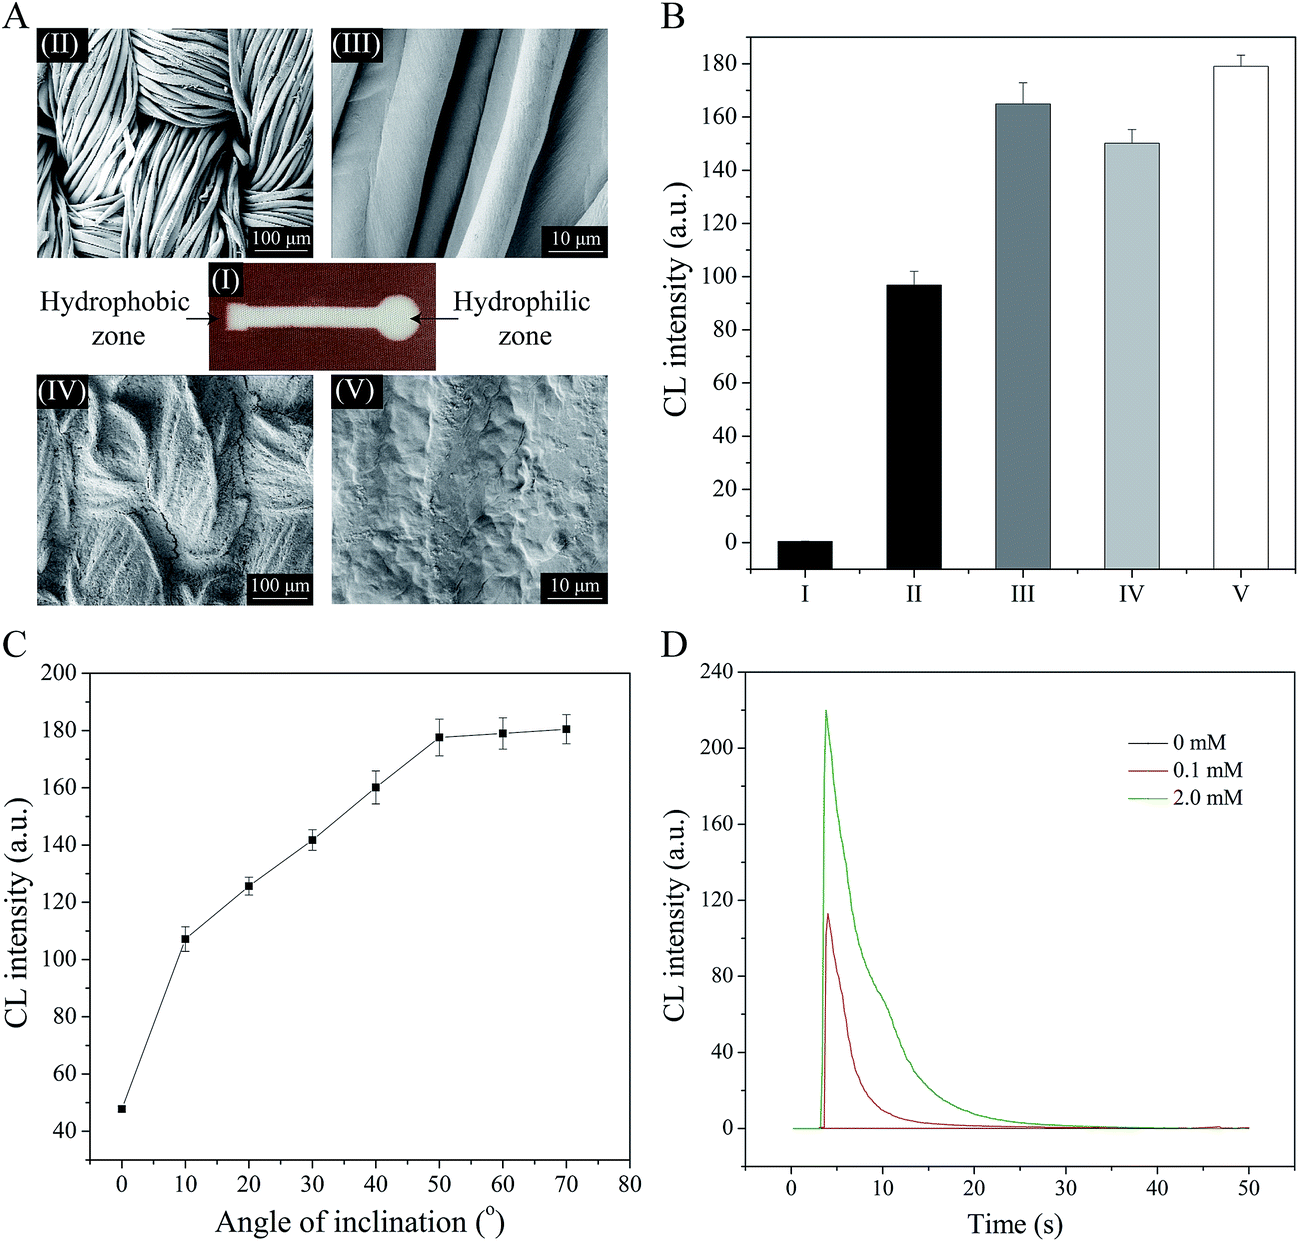 | ||
| Fig. 4 Characterization of the CL cloth-based devices. (A) Photo (I) and SEM images (II–V) of a typical cloth-based device. Here, the structures of the pure cloth (hydrophilic zone) (II and III) and wax-screen-printed cloth (hydrophobic zone) (IV and V) were shown. (B) The effect of the solution's addition ways on the CL intensities. Column “I”-5.5 μL of substrate solution ([luminol]-5.54 mM, [PIP]-1.09 mM, [HRP]-1.64 g L−1) was added onto the detection zone, followed by drying the device for 3.5 h in a dark environment at room temperature, and then 35 μL of H2O2 solution ([H2O2]-0.5 mM) was introduced onto the loading zone. Column “II”-5.5 μL of substrate solution ([luminol]-5.54 mM, [PIP]-1.09 mM, [HRP]-1.64 g L−1) was added onto the detection zone, followed by drying the device for 3.5 h in a dark environment at room temperature. After drying, 30 μL of TBS was dropped on the detection zone, and then 35 μL of H2O2 solution ([H2O2]-0.5 mM) was introduced onto the loading zone. Column “III”-30 μL of substrate solution ([luminol]-1.0 mM, [PIP]-0.2 mM, [HRP]-0.3 g L−1) was added onto the detection zone, and then 35 μL of H2O2 solution ([H2O2]-0.5 mM) was introduced onto the loading zone. Column “IV”-30 μL of H2O2/HRP mixture ([H2O2]-0.5 mM, [HRP]-0.3 g L−1) was added onto the detection zone, and then 35 μL of substrate solution ([luminol]-1.0 mM, [PIP]-0.2 mM) was introduced onto the loading zone. Column “V”-30 μL of H2O2 solution ([H2O2]-0.5 mM) was added onto the detection zone, and then 35 μL of substrate solution ([luminol]-1.0 mM, [PIP]-0.2 mM, [HRP]-0.3 g L−1) was introduced onto the loading zone. For columns I–V, the pH values of PBS and TBS were 7.5 and 8.0, respectively; and the angle of inclination was set to be 50°. (C) The CL intensity is plotted as the angle of inclination (pH of test/substrate solutions-7.5/8.0, [luminol]-1.0 mM, [HRP]-0.3 g L−1, [PIP]-0.2 mM, [H2O2]-0.5 mM). (D) Typical kinetic curves of CL signals at different H2O2 concentrations (0, 0.1 and 2.0 mM) (pH of test/substrate solutions-7.5/8.0, [luminol]-1.0 mM, [HRP]-0.3 g L−1, [PIP]-0.2 mM, angle of inclination-50°). For panels (B) and (C), the error bar represents the standard deviation of five independent measurements. | ||
It has been shown that the addition ways of the solutions could affect the cloth-based CL signals (Fig. 4B). When the components of substrate solution (luminol, HRP and PIP) were dried and immobilized on the detection zone, the direct addition of H2O2 solution onto the loading zone only led to a negligible CL signal (Fig. 4B(I)), possibly because the buffering environment of the luminescence reaction was greatly destroyed. As expected, the similar addition of H2O2 solution could produce a relative strong CL signal after 30 μL of buffer solution (TBS) was dropped onto the detection zone (Fig. 4B(II)). Notably, the CL intensity obtained in this way was still much lower than that obtained in the way that the substrate and H2O2 solutions were introduced onto the detection and loading zones, respectively (Fig. 4B(III)). The possible reason for this phenomenon is that the drying/immobilization process caused a small amount of substrate components to fail to trigger the CL reaction. Moreover, if the substrate and test solutions were correspondingly introduced onto the loading and detection zones, a considerably strong CL signal could be obtained (Fig. 4B(IV) and (V)). But, the HRP included in the substrate solution instead of the test solution could yield a relatively stronger CL emission (Fig. 4B(V)). Therefore, this way for the addition of the solutions was selected for the later experiments.
To better understand the effect of the angle of inclination in this device, CL measurements were performed at eight different inclination angles. As shown in Fig. 4C, a weak CL signal was obtained in the case of the inclination angle of 0°. However, the CL intensity gradually increased with increasing the inclination angle from 10° to 50°, possibly because the rapid reagent mixing was obtained more and more efficiently. For an inclination angle greater than 50°, the CL intensity seemed to reach a plateau. Therefore, the inclination angle of 50° was chosen for the following investigations. Fig. 4D shows the typical kinetic curves of CL signal in the proposed device. At three concentrations of H2O2, the intensity of CL signal reached a maximum about 4 s after the addition of the substrate solution. This result suggests that the proposed CL method has the potential for rapid and quantitative assays of H2O2 or glucose. In addition to that, the assay cost of each cloth-based device was very low, and it was estimated to be about $0.01 (Table S1†).
Here, it needs to be demonstrated that the use of white plain weave cotton cloth for the presented work is based on the following facts. First, several different colors of plain weave cotton cloths were chosen to evaluate the influence of cloth colors on the CL intensity. As shown in Fig. S1,† for each cloth color, the detection zone in the absence of H2O2 had no detectable CL signals. However, the bright luminescence signals at 0.05 and 0.5 mM H2O2 could be produced, and moreover the former signal was weaker than the latter, indicating that these clothes could be used to make the CL cloth-based devices for quantitative H2O2 assay. Surprisingly, however, the white cloth-based devices could produce a stronger CL signal than those fabricated using other colored cloths. At present, we may have been unable to accurately pinpoint the source of this phenomenon, but one possible reason is that the geometrical structure or hydrophilicity of the white cloth is somewhat different from that of the blue, red, pink and brown cloths, due to the use of different cloth production processes; and the former was more beneficial to the proposed gravity/capillary flow-triggered CL assay.
Next, the effect of white cloths with different components on the CL intensity was evaluated. In this evaluation, the cloth materials included white plain weave cotton cloth (“cotton cloth”), white linen-silk blended cloth (“linen-silk cloth”), white linen cloth (“linen cloth”), and white corduroy weave cotton cloth (“corduroy cloth”) (Table S2 and Fig. S2†). It can be seen from Fig. S3† that to a certain extent, these cloth-based devices could affect the proposed CL intensity. For corduroy cloth-based devices, when 35 μL of substrate solution was introduced onto the loading zone, only a very little amount of substrate solution flowed into the detection zone, and thus a very weak luminescence value was observed. The possible reason for this phenomenon is that the corduroy cloth was relatively thick (∼450 μm) and the vast majority of substrate solution was trapped in the flow channel. Note that a stronger CL signal could be obtained if more substrate solution was applied (data not shown). For linen cloth-based devices, a relative weak CL signal was also observed under the similar conditions, possibly because the relatively large interstitial spaces between threads in cloth adversely affected the gravity/capillary flow. Different from the former two kinds, the devices fabricated using cotton cloth and linen-silk cloth could be well used for the proposed CL. Under the similar conditions, however, the CL signals obtained using cotton cloth-based devices were a bit stronger than those using linen-silk cloth-based devices. In addition, the cost of plain weave cotton cloth was about one-third of that of linen-silk blended cloth. Therefore, the white plain weave cotton cloth was chosen for this work.
Assays of H2O2 and glucose on the presented platform
Under the above conditions, the relationship between the CL intensities and different H2O2 concentrations has been evaluated (Fig. 5A). It has been shown that the CL intensity gradually increased as the H2O2 concentration increased from 0 to 10 mM. Moreover, the CL intensity increased linearly with the logarithm of H2O2 concentration in the range of 0.01–10 mM, with a squared correlation coefficient of 0.9740 (R2 = 0.9740, n = 5). As a result, the limit of detection (LOD) was estimated to be 9.07 μM, where the LOD was defined as the lowest H2O2 concentration that could produce a signal three standard deviations higher than the background.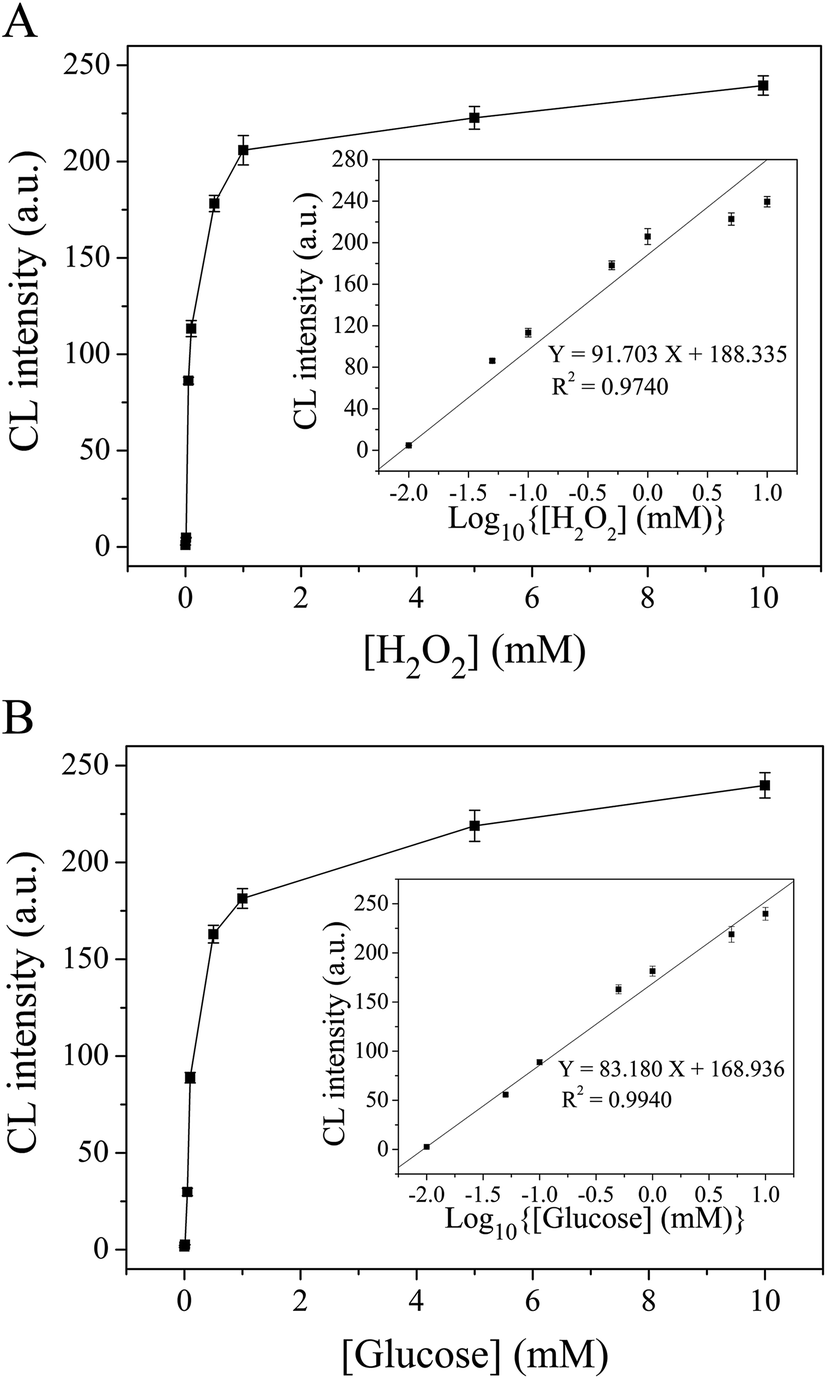 | ||
| Fig. 5 Calibration curves for determination of H2O2 (A) and glucose (B) using the proposed CL cloth-based devices. In panel (A), pH of test/substrate solutions-7.5/8.0, [luminol]-1.0 mM, [HRP]-0.3 g L−1, [PIP]-0.2 mM, [H2O2]-0, 0.01, 0.05, 0.1, 0.5, 1, 5 and 10 mM, angle of inclination-50°, and volumes of test/substrate solutions-30 μL/35 μL; while in panel (B), pH of substrate/test solutions-7.5/8.0, [luminol]-1.0 mM, [HRP]-0.3 g L−1, [PIP]-0.2 mM, [GOD]-0.1 U μL−1, [glucose]-0, 0.01, 0.05, 0.1, 0.5, 1, 5 and 10 mM, angle of inclination-50°, volumes of enzyme/glucose solutions-15 μL/15 μL, volume of substrate solution-35 μL, and enzymatic reaction time for H2O2 production-5 min. The insert showed that the CL intensities could be linearly proportional to the logarithms of analyte concentrations in the range of 0.01–10 mM. The error bar represents the standard deviation of five independent measurements. | ||
Furthermore, the CL cloth-based devices were applied for the glucose assay. Here, the glucose solution and GOD solution were mixed in the same volume, and the resulting solution was introduced onto the detection zone shortly after 5 min of enzymatic reaction. It has been shown that the CL intensity was gradually increased as the glucose concentration increased, and was linearly correlated with the logarithm of glucose concentration over the range from 0.01 mM to 10 mM (R2 = 0.9940, n = 5) (Fig. 5B). In a similar way, the LOD was calculated to be 9.74 μM.
Reproducibility, stability and selectivity of the cloth-based CL assay
The reproducibility of the proposed assay could be defined as the one within the device of two sets of CL units and between three different cloth-based devices. It has been indicated that the relative standard deviations (RSDs) of five independent measurements of 0.01, 0.1 and 5 mM H2O2 were 3.36%, 3.66% and 2.64%, respectively. In addition, the RSDs of five independent measurements of 0.1, 1 and 5 mM glucose were determined to be 3.01%, 2.80% and 3.68%, respectively. So, the reproducibility of the proposed CL devices was acceptable.The stability of the cloth-based devices is a key problem in their application and development. Here, it was evaluated over a twenty-two day period by observing the CL responses with intermittent use by every two days. The cloth-based devices were kept in air at room temperature when they were not used, and moreover they were covered to avoid the possible interferences. The results showed that the CL intensity changed only slightly over this period (Fig. 6). After ten and twenty days, the devices maintained 97.1% and 95.4% of their initial response, respectively. This result indicated that the proposed cloth-based devices had a good storage stability, and might be suitable for long-distance transport in remote areas.
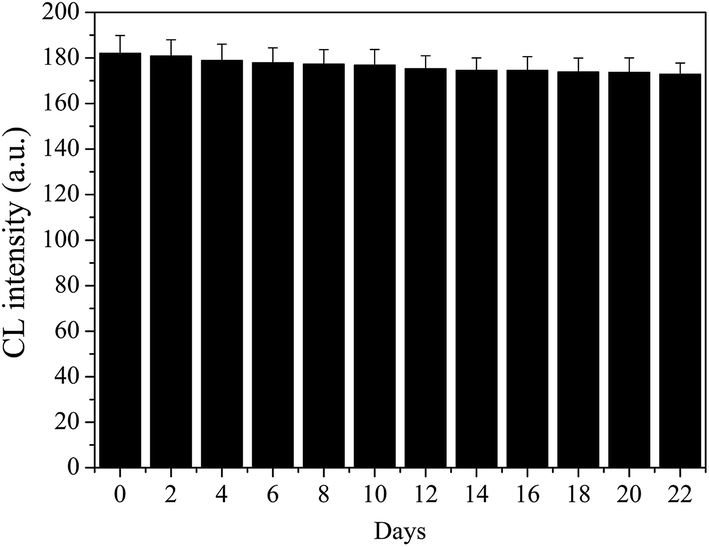 | ||
| Fig. 6 Storage stability of the cloth-based devices for the determination of H2O2 (pH of test/substrate solutions-7.5/8.0, [luminol]-1.0 mM, [HRP]-0.3 g L−1, [PIP]-0.2 mM, [H2O2]-0.5 mM, angle of inclination-50°, volumes of test/substrate solutions-30 μL/35 μL). The error bar represents the standard deviation of five independent measurements. | ||
The evaluation of selectivity of the proposed assay is also very necessary, because some species usually existed and possibly interfered with the CL response of the analyte of interest. In the presented work, taking the glucose detection as an example, different types of potential interfering species were applied to investigate the selectivity of such enzyme-based CL sensor. Here, a coexisting species was considered not to interfere if the induced relative error was less than 5% during the measurement of 0.5 mM glucose. The results of the interference study are shown in Fig. 7. As seen from Fig. 7A, the corresponding 5, 6, 10, 300 and 4000 times excess of Fe2+, Zn2+, Ca2+, Mg2+ and Na+ (or K+) over 0.5 mM glucose was found to be non-interfering. Similarly, the NO3−, PO43−, C2O42−, SO42−, C3H5O3− and Cl− ions would not interfere with the glucose assay when present at levels up to their respective 40, 50, 200, 300, 800 and 4000 fold excess (Fig. 7B). In addition to these above-mentioned ions, other tested species such as AP, Vc, bilirubin, GSH, thiourea, UA, urea, lactose, sucrose and fructose could be tolerated at reasonable concentrations that were higher than their normal levels (Fig. 7C). It has been reported that Vc at high concentrations can interfere with the sensor response, probably because it easily reduces H2O2 produced from the enzymatic reaction.51 In our case, however, it did not have any interference with the CL detection of glucose at the concentration of 0.15 mM over the upper limit of normal concentration range (34–79 μM in human blood52). These results showed that the proposed cloth-based sensor had a good anti-interfering performance, which may be attributed to the use of novel cloth-based platform and enzymatic substrate-specific reactions.
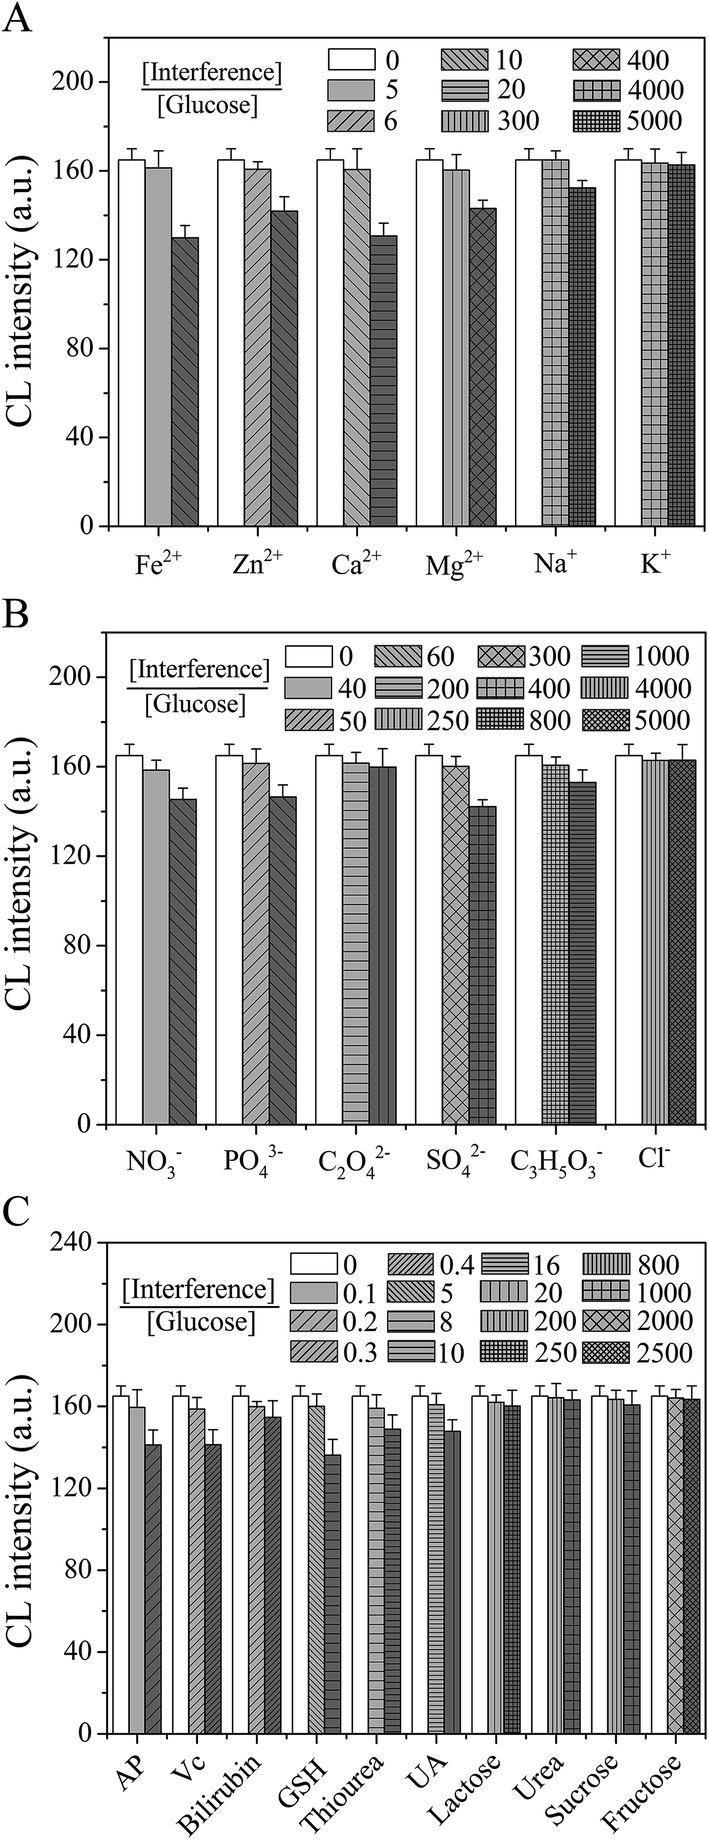 | ||
| Fig. 7 Evaluation of the selectivity for the glucose detection by using several typical coexisting cationic ions (A), anionic ions (B) or other species (C) (pH of substrate/test solutions-7.5/8.0, [luminol]-1.0 mM, [HRP]-0.3 g L−1, [PIP]-0.2 mM, [GOD]-0.1 U μL−1, [glucose]-0.5 mM, volumes of enzyme/glucose solutions-15 μL/15 μL, volume of substrate solution-35 μL, enzymatic reaction time for H2O2 production-5 min). The error bar represents the standard deviation of five independent measurements. | ||
Real sample analysis
To demonstrate the potential applications of the presented method, the cloth-based devices were firstly applied to determine the H2O2 in real milk samples. In this analytical case, different concentrations of H2O2 were spiked into the milk samples. Then, the resulting mixtures were used to prepare the test solutions, and the cloth-based CL was applied to examine the presence of H2O2 in spiked samples. The results showed that the recoveries of H2O2 ranged from 96.68% to 103.86%, with the RSD values of 2.96–5.81% (Table S3†), and the milk sample without spiked H2O2 did not have any detectable CL signal (data not shown). Note that compared with the previous work,53 the proposed method is simple and rapid, without need for high-cost and complicated sample pretreatment.Further, the levels of glucose in human serum samples were detected by the proposed CL and clinical hexokinase-based colorimetric methods. As shown in Fig. 8, the regression equation of Y = 0.9619X + 0.2648 (R2 = 0.9973, n = 5) was obtained. As a result, the concentrations of glucose measured by these two methods were not statistically different at the 95% confidence level. The difference of the slope from unity and as well the difference in error bar of each data point might arise from differences in preparation of the standards. Therefore, the proposed cloth-based CL method might provide an alternative tool for the detection of glucose in real clinical serum samples.
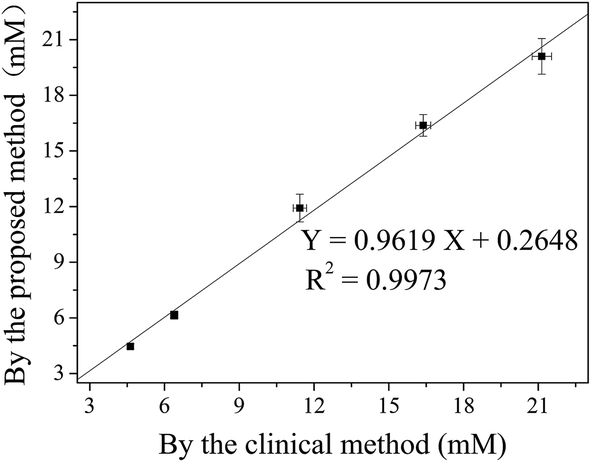 | ||
| Fig. 8 Comparison of the proposed and clinical methods for the detection of glucose in human serum samples. For five clinical samples, the concentrations of glucose were determined by the clinical hexokinase-based colorimetric method on the Beckman Coulter® AU5800 Biochemical Analyzer, and by the CL method on the proposed cloth-based devices. For the proposed method, the clinical samples were appropriately diluted with the buffer solution before the assays were performed (pH of substrate/test solutions-7.5/8.0, [luminol]-1.0 mM, [HRP]-0.3 g L−1, [PIP]-0.2 mM, [GOD]-0.1 U μL−1, volumes of enzyme/glucose solutions-15 μL/15 μL, volume of substrate solution-35 μL, enzymatic reaction time for H2O2 production-5 min), and the error bar represents the standard deviation of five independent measurements. | ||
Comparison of the presented platform with other CL platforms
Up to now, some large-size or lab-on-chip (microfluidic) CL platforms have been developed for the determination of H2O2 (Table S4†) or glucose (Table S5†). It can be clearly seen that the linear dynamic response range for the proposed H2O2/glucose sensor is wider than those for most of the previously reported CL sensors. Especially, the presented range for H2O2 concentration or glucose concentration is two orders of magnitude wider than those obtained in some CL platforms that have the ranges of 0.1–1 mM (ref. 11) and 0.5–5 mM (ref. 40) for H2O2 detection, and the ranges of 0.2–2 mM,26 0.8–10 mM (ref. 29) and 2–10 mM (ref. 33) for glucose detection. With regard to the detection sensitivity, the proposed LOD is lower than or comparable to those achieved in large-size or microfluidic CL platforms listed in Tables S4 and S5.† Notably, although the same CCD camera is used as the CL detector, the LOD of H2O2 in the proposed GCF and cloth-based platform is about fifty times lower than that obtained in our previous capillary flow and cloth-based CL platform.40 In addition, the presented LOD for glucose detection is much lower than those obtained in similar fiber material-based microfluidic CL devices that have the detection limits of 94.8 μM,46 140 μM (ref. 32) and ∼300 μM.35For nearly all of large-sized CL systems in Tables S4 and S5,† certain tubes are required to construct the CL flow cell and to connect the flow cell with the pumping units. In most cases, certain valves are further used to control the introduction of reaction solutions. Therefore, these CL detection systems have a relatively low integration level and are often difficult to operate in a portable manner. To circumvent these limitations, some chip-based microfluidic CL systems have been explored. However, the chips using silicon,11 glass,19,27 PDMS15,16,28,33 and PMMA29 still involve some complicated fabrication processes, and thus have a relatively high cost. In addition, similar to the large-size systems, these chips often require one or more external pumping units and as well a series of fluid/electrical connectors. Moreover, the photomultiplier tube (PMT) is often used in these two types of CL systems. Although the PMT detector has a high amplification factor and a good photoelectric linearity, it has some important limitations such as high supply voltage, large size, and complex mechanical equipment. To partially overcome these limitations, the CCD detector may become an interesting alternative for the detection of optical signals. Notably, the CCD detector has been rarely used for the CL platforms in Tables S4 and S5,† and moreover it has also been rarely applied for detection of CL signals in fiber material-based microfluidic devices.36–38 One of the advantages using the CCD detector is that high-throughput detection is realized easily.50 In the presented work, the simultaneous detection within different CL units on a single cloth piece could be obtained (Fig. S4†). In addition, the CL images can be taken in real-time by the CCD detector. In short, relative to traditional large-size and chip-based CL methods, the presented CL method for analyses of H2O2 and glucose involves the simple configuration and fast fabrication of the cloth-based devices, and utilizes the relatively cheap and portable CCD camera as the CL detector, with no need of bulky and high-cost external instruments and trained operating personnel. Basically, a less-instrumented analytical platform has been explored for detection of H2O2 and glucose.
As mentioned above, microfluidic paper-based analytical devices (μPADs) have been attracting increasing attention in recent years. Similar to μCADs, μPADs are characterized by simple and feasible fabrication and functionalization methods,36,37 and should have the potential to be integrated with the proposed gravity/capillary flow to obtain a similar CL detection. It has been shown that under other similar conditions, the CL paper-based devices could be successfully applied for the H2O2 assay (Fig. S5†). As seen from the insert of Fig. S5,† the CL intensity was linearly correlated with the logarithm of H2O2 concentration in the range of 0.05–10 mM (R2 = 0.9772, n = 5). As a result, the detection limit in terms of the similar rule was calculated to be 25.42 μM. This sensitivity is lower than that obtained using the abovementioned cloth-based devices. We suspect that the variance in detection sensitivity is most likely due to the difference in the structure of the substrate itself. Different from paper, the cloth used in this work is composed of woven threads in warp and weft directions, and is a hierarchical structure made from spun fibers and woven threads. Such cloth structure may be favorable for the gravity/capillary flow-triggered CL. It should be noted that this phenomenon is similar to that reported in our recent works.45,54 It has been reported that under similar conditions, the detection limit for trivalent chromium obtained using the cloth-based devices (6.2 μg L−1) is much lower than that using the paper-based devices (24 μg L−1).45,54 It is necessary to point out that the cost of H2O2 assay on each paper-based device was estimated to be about $0.036, which was much higher than that of each cloth-based device ($0.011) (Table S1†). Therefore, based on the abovementioned facts, it may be reasonable that cloth-based devices instead of paper-based devices are chosen in this work.
Conclusions
In this work, we have successfully developed a novel CL methodology for facile and sensitive measurement of H2O2 and glucose by the coupling of enzymatic luminescence, gravity flow, natural capillary flow and cloth-based microfluidics. By using the wax screen-printing approach, the preparation of such enzymatic CL devices is simple and rapid, and thus the assay cost of each device is very low (about $0.01 per assay). Under optimized conditions, the CL cloth-based devices can fulfill a desirable analysis of H2O2 or glucose, with acceptable dynamic range, sensitivity, selectivity, reproducibility and stability. Moreover, the proposed CL method can be well applied for simple and rapid determination of H2O2 or glucose in complex samples, without the need for complicated and time-consuming sample pretreatment. In future, we will try to improve the integration level and detection sensitivity of the CL devices, and broaden the scope of application of this analytical platform to cover more assay areas.Conflicts of interest
There are no conflicts to declare.Acknowledgements
This research is supported by the National Natural Science Foundation of China (81571765), Guangdong Science and Technology Program (2014A020212503; 2016A020215143), and Guangzhou Science and Technology Program (2014J4100030). We thank Dr Zhiquan Que and Dr Dayu Liu at Guangzhou First People's Hospital for their help in collecting and assaying the serum samples.References
- W. Chen, S. Cai, Q. Q. Ren, W. Wen and Y. D. Zhao, Analyst, 2012, 137, 49–58 RSC.
- R. Z. Zhang and W. Chen, Biosens. Bioelectron., 2017, 89, 249–268 CrossRef CAS PubMed.
- A. Heller and B. Feldman, Chem. Rev., 2008, 108, 2482–2505 CrossRef CAS PubMed.
- C. Chen, Q. J. Xie, D. W. Yang, H. L. Xiao, Y. C. Fu, Y. M. Tan and S. Z. Yao, RSC Adv., 2013, 3, 4473–4491 RSC.
- H. Wei and E. K. Wang, Anal. Chem., 2008, 80, 2250–2254 CrossRef CAS PubMed.
- Y. Zheng, S. L. Zhao and Y. M. Liu, Analyst, 2011, 136, 2890–2892 RSC.
- H. Liu and R. M. Crooks, Anal. Chem., 2012, 84, 2528–2532 CrossRef CAS PubMed.
- X. W. Zhang, J. Li, C. G. Chen, B. H. Lou, L. L. Zhang and E. K. Wang, Chem. Commun., 2013, 49, 3866–3868 RSC.
- J. X. Zhang, L. P. Tu, S. Zhao, G. H. Liu, Y. Y. Wang, Y. Wang and Z. Yue, Biosens. Bioelectron., 2015, 67, 296–302 CrossRef CAS PubMed.
- J. Yuan, Y. Cen, X. J. Kong, S. Wu, C. L. Liu, R. Q. Yu and X. Chu, ACS Appl. Mater. Interfaces, 2015, 7, 10548–10555 CAS.
- A. M. Jorgensen, K. B. Mogensen, J. P. Kutter and O. Geschke, Sens. Actuators, B, 2003, 90, 15–21 CrossRef CAS.
- E. Warm and G. G. Laties, Phytochemistry, 1982, 21, 827–831 CrossRef CAS.
- A. N. Díaz, M. C. R. Peinado and M. C. T. Minguez, Anal. Chim. Acta, 1998, 363, 221–227 CrossRef.
- M. C. Ramos, M. C. Torijas and A. N. Díaz, Sens. Actuators, B, 2001, 73, 71–75 CrossRef CAS.
- O. Hofmann, P. Miller, P. Sullivan, T. S. Jones, J. C. deMello, D. D. C. Bradley and A. J. deMello, Sens. Actuators, B, 2005, 106, 878–884 CrossRef CAS.
- X. H. Wang, O. Hofmann, R. Das, E. M. Barrett, A. J. deMello, J. C. deMello and D. D. C. Bradley, Lab Chip, 2007, 7, 58–63 RSC.
- O. D. Leite, O. Fatibello, H. J. Vieira, F. R. P. Rocha and N. S. de Miranda Cury, Anal. Lett., 2007, 40, 3148–3157 CrossRef CAS.
- W. Wang and H. Cui, J. Phys. Chem. C, 2008, 112, 10759–10766 CAS.
- X. Y. Zeng, K. D. Zhang, J. Pan, G. P. Chen, A. Q. Liu, S. K. Fan and J. Zhou, Lab Chip, 2013, 13, 2714–2720 RSC.
- F. Pan, P. K. Wei, M. L. Zhang and C. Lu, Anal. Methods, 2015, 7, 5667–5673 RSC.
- J. Y. Zhou, J. J. Gu, C. X. Tian, D. C. Jiang, Y. Chen and K. Xi, RSC Adv., 2016, 6, 39480–39483 RSC.
- X. Z. Liu and E. H. Hansen, Anal. Chim. Acta, 1996, 326, 1–12 CrossRef CAS.
- Q. Fang, X. T. Shi, Y. Q. Sun and Z. L. Fang, Anal. Chem., 1997, 69, 3570–3577 CrossRef CAS PubMed.
- D. Janasek and U. Spohn, Sens. Actuators, B, 1997, 38–39, 291–294 CrossRef.
- B. X. Li, Z. J. Zhang and Y. Jin, Anal. Chim. Acta, 2001, 432, 95–100 CrossRef CAS.
- Y. X. Li, L. D. Zhu and G. Y. Zhu, Chem. Res. Chin. Univ., 2002, 18, 12–15 CAS.
- Y. Lv, Z. J. Zhang and F. N. Chen, Talanta, 2003, 59, 571–576 CrossRef PubMed.
- Z. R. Xu and Z. L. Fang, Anal. Chim. Acta, 2004, 507, 129–135 CrossRef CAS.
- W. Liu, Z. J. Zhang and H. S. Liu, Anal. Sci., 2005, 21, 413–416 CrossRef CAS PubMed.
- P. Panoutsou and A. Economou, Talanta, 2005, 67, 603–609 CrossRef CAS PubMed.
- D. Lan, B. X. Li and Z. J. Zhang, Biosens. Bioelectron., 2008, 24, 934–938 CrossRef CAS PubMed.
- J. H. Yu, L. Ge, J. D. Huang, S. M. Wang and S. G. Ge, Lab Chip, 2011, 11, 1286–1291 RSC.
- B. U. Moon, M. G. de Vries, B. H. C. Westerink and E. Verpoorte, Sci. China: Chem., 2012, 55, 515–523 CrossRef CAS.
- M. J. Hao, N. Liu and Z. F. Ma, Analyst, 2013, 138, 4393–4397 RSC.
- H. Jang and H. Noh, Macromol. Res., 2015, 23, 493–495 CrossRef CAS.
- A. K. Yetisen, M. S. Akram and C. R. Lowe, Lab Chip, 2013, 13, 2210–2251 RSC.
- Y. H. Xu, M. L. Liu, N. Kong and J. Q. Liu, Microchim. Acta, 2016, 183, 1521–1542 CrossRef CAS.
- A. Nilghaz, D. R. Ballerini and W. Shen, Biomicrofluidics, 2013, 7, 051501 CrossRef CAS PubMed.
- P. J. Wu and C. S. Zhang, Lab Chip, 2015, 15, 1598–1608 RSC.
- W. R. Guan, C. S. Zhang, F. F. Liu and M. Liu, Biosens. Bioelectron., 2015, 72, 114–120 CrossRef CAS PubMed.
- W. R. Guan, M. Liu and C. S. Zhang, Biosens. Bioelectron., 2016, 75, 247–253 CrossRef CAS PubMed.
- M. Liu, C. S. Zhang and F. F. Liu, Anal. Chim. Acta, 2015, 891, 234–246 CrossRef CAS PubMed.
- M. Liu, R. Liu, D. Wang, C. L. Liu and C. S. Zhang, Lab Chip, 2016, 16, 2860–2870 RSC.
- M. Liu, D. Wang, C. L. Liu, R. Liu, H. J. Li and C. S. Zhang, Sens. Actuators, B, 2017, 246, 327–335 CrossRef CAS.
- R. Liu, P. Zhang, H. J. Li and C. S. Zhang, Sens. Actuators, B, 2016, 236, 35–43 CrossRef CAS.
- H. J. Li, C. L. Liu, D. Wang and C. S. Zhang, Biosens. Bioelectron., 2017, 91, 268–275 CrossRef CAS PubMed.
- A. Nilghaz, S. Bagherbaigi, C. L. Lam, S. M. Mousavi, E. P. Córcoles and D. H. B. Wicaksono, Microfluid. Nanofluid., 2015, 19, 317–333 CrossRef CAS.
- W. Qin, Z. J. Zhang, B. X. Li and S. N. Liu, Anal. Chim. Acta, 1998, 372, 357–363 CrossRef CAS.
- B. X. Li, Z. J. Zhang and L. X. Zhao, Anal. Chim. Acta, 2001, 445, 161–167 CrossRef CAS.
- L. R. Luo, Z. J. Zhang and L. Y. Hou, Anal. Chim. Acta, 2007, 584, 106–111 CrossRef CAS PubMed.
- M. J. Chaichi and M. Ehsani, Sens. Actuators, B, 2016, 223, 713–722 CrossRef CAS.
- P. C. Nien, T. S. Tung and K. C. Ho, Electroanalysis, 2006, 18, 1408–1415 CrossRef CAS.
- J. S. Easow and T. Selvaraju, Electrochim. Acta, 2013, 112, 648–654 CrossRef CAS.
- C. S. Zhang and P. Zhang, China Patent 201510861233.5, 2015-11-30.
Footnote |
| † Electronic supplementary information (ESI) available. See DOI: 10.1039/c7ra06721f |
| This journal is © The Royal Society of Chemistry 2017 |