
 Open Access Article
 This Open Access Article is licensed under a
 Creative Commons Attribution 3.0 Unported Licence
Novel graphene capsule–aminoporphyrin nanohybrids: preparation and application in photodynamic therapy of cancer†
Guoli Liua,
Hongying Lvb,
Jing Zhaoa,
Shen Zhanga and
Shuqing Sun *a
*a
aDepartment of Chemistry, College of Science, Tianjin University, Tianjin, 300072, China. E-mail: sunshuqing@tju.edu.cn
bChinese Academy of Medical Sciences, Institute of Radiation Medicine, Tianjin, 300192, China
First published on 12th December 2017
Abstract
In this work, we firstly prepared new sealed graphene capsules (GCs) that were about 300 nm in size and had different morphologies using a simple reduction method. The quality of the graphene oxide (GO) sheets and the concentration of hydrazine hydrate are proposed to be influencing factors for the formation of sealed graphene capsules. GCs are covalently functionalized with 5,10,15,20-tetra-(4-aminophenyl)porphyrin, forming dispersible GC–aminoporphyrins in aqueous solution. The observed fluorescence quenching of the GCs by the aminoporphyrin indicated that the GCs are electron donors and electron transfer occurs from the GCs to the aminoporphyrin. This Förster Resonance Energy Transfer (FRET) between the GCs and aminoporphyrins is probably the reason for the enhancement of 1O2 generation of the GC–aminoporphyrins. More importantly, the as-prepared GC–aminoporphyrin nanohybrids as novel photosensitizers (PSs) with a short excitation wavelength can be used as PDT reagents for the treatment of malignant melanoma A375 with high efficiency. We expect that GC–aminoporphyrins will be promising PSs in future cancer therapy.
1. Introduction
Graphene has attracted tremendous research interest due to its outstanding physical and chemical properties in various fields such as electronic devices, photonic devices, energy conversion and storage, nanocomposites, catalysis, and biosensing.1–12 To date, many research works have focused on graphene sheets. Obviously, graphene with different morphologies, such as 3D graphene networks, graphene capsules or graphene tubes, etc., is of significant importance in the areas of supercapacitors, catalysis and drug delivery.13–15 Among these graphene materials with different morphologies, only a few reports are available in the literature about the preparation and application of graphene capsules that were prepared by assembling low-dimensional graphene sheets. Hong et al. reported that graphene sheets were deposited onto the surface of sacrificial colloidal particles using a layer-by-layer assembly method, leading to the formation of the graphene capsules.13 The capsule-embedded reduced graphene oxide (rGO) was synthesized by photocatalytic reduction in the presence of monodispersed peanut shaped α-Fe2O3 particles.16,17 Novel composite GO/poly(allylamine hydrochloride) multilayer capsules have been fabricated by layer-by-layer (LbL) assembly.14 Recently, Qu et al. prepared branched graphene nanocapsules on which there are abundant edges and defects, which largely favored the lithiation/delithiation reaction and resulted in a high Li-ion storage level.18 However, these processes are complex and time consuming. Therefore, it is important to develop simple, practical, and effective methods for the fabrication of sealed graphene capsules to take advantage of its properties.PDT is a promising cancer treatment modality owing to its minimally invasive nature, fewer side effects, cost-effectiveness, and its nondamaging effects on healthy tissue, which may help to avoid the disadvantages of conventional modalities.19–22 PDT has been used in extensive investigations and has emerged as a disease site specific treatment modality. In PDT, after the administration of a tumor-localizing photosensitizer, the tumors are irradiated under light with a specific wavelength to activate the PS. Then cancerous cells are locally killed by reactive oxygen species (ROS), especially singlet oxygen (1O2), which is generated by the PS.23 In the past few decades, Hu et al. have published several important works on the PDT effects of graphene-based nanohybrids.24–29 For nanometer carbon materials, green-light-emitting carbon quantum dots (CQDs) have been conjugated with Ce6 to improve their biocompatibility and light emission intensity and this composite has a PDT anticancer effect.30 In addition, it was reported that graphene quantum dots (GQDs) passivated with polyethylene glycol derivatives could generate 1O2 upon irradiation with blue light.31
Porphyrins are a class of macrocyclic compound that have π-electron conjugated frameworks, which can be linked onto the surfaces of carbon nanomaterials through covalent and noncovalent interactions.32 The extensive 2D 18π-electron porphyrins and porphyrin-modified acceptor nanoparticles exhibit good optoelectronic properties.33 Porphyrin-based functional carbon materials have been extensively researched because of their structural rigidity, thermal stability, and photochemical and photophysical properties. Research indicates that the extensive 18π-electron conjugated tetraphenyl porphyrins can be used for the functionalization of carbon nanotubes, graphene and nanohorns on the basis of π–π interactions between them,34 and in these nanohybrids it resulted in the fluorescence emission of porphyrin being quenched and the electron-transfer occurring from porphyrin to the carbon nanotubes, graphene and nanohorns, respectively.35
Until now, GC–porphyrins have not yet been reported. In this work, a simple liquid phase reaction method was developed to prepare new sealed GCs and this is our novel work. Then, the GCs were covalently functionalized with 5,10,15,20-tetra-(4-aminophenyl)porphyrin, forming dispersible GC–aminoporphyrin nanohybrids in aqueous solution. The observed fluorescence quenching of the GCs by the aminoporphyins indicated that the GCs are electron donors and electron transfer occurs from the GCs to the aminoporphyrin. Subsequently, the photoactivity of the GC–aminoporphyrin nanohybrids is higher than that of the aminoporphyin nanorods (NRs). Furthermore, the GC–aminoporphyrin nanohybrids were used as a photosensitizer to kill cancer cells in vitro and to inhibit the growth of tumors in vivo.
2. Experimental section
2.1 Materials and instruments
Natural graphite flakes (325 mesh, 99.8%) were purchased from Alfa Aesar. 3-(4,5-Dimethylthiazol-2-yl)-2,5-diphenyl tetrazolium bromide (MTT), phosphate citrate buffer, tetrahydrofuran (THF) and dimethyl sulfoxide (DMSO) were purchased from Sigma-Aldrich. RPMI 1640 culture medium, fetal bovine serum (FBS), Dulbecco’s phosphate buffered saline (PBS), and the antibiotic agents were purchased from Invitrogen (USA). The Singlet Oxygen Sensor Green (SOSG) reagent was ordered from Life Technology. High-purity water with a resistivity greater than 18.4 MΩ cm was collected from an in-line Millipore RiOs/Origin water purification system. All chemicals were used as supplied without further purification.TEM images were captured on a Jeol JEM-2100F transmission electron microscope operated at 100 keV. FT-IF spectra were recorded on a Magna-560 spectrophotometer using a KBr pellet. Raman analyses of the GO sheets and GCs were carried out by micro-Raman spectroscopy with confocal configuration (NT-MDT NTEGRA Spectra, with a 532 nm laser). Photoluminescence (PL) spectra were measured using a Cary Eclipse EL06063917 fluorescence spectrophotometer with a xenon arc lamp as the light source.
2.2 Preparation of graphene capsules
Graphene oxide sheets were prepared using a modified Hummers’ method. In a typical procedure, 1.5 g of graphite powder and 48 mL of concentrated sulfuric acid were added into a 250 mL flask. The mixture was stirred vigorously for 30 min. Next, 1.8 g of NaNO3 was added, followed by cooling of the mixture to 0 °C using an ice water bath. After continuous stirring for 1 h, 4.5 g of KMnO4 was added slowly over a period of 1 h. Subsequently, the system temperature was kept at 35 °C for 30 min. Then the reaction was quenched by adding 0.18 L of ice water and 15 mL of H2O2 (30%). The resultant GO was centrifuged and washed with plenty of water until no precipitation of BaSO4 occurred in the presence of the aqueous BaCl2 solution and the chloride test with AgNO3 was negative. The resultant product was dried at 50 °C for 24 h in a vacuum oven. The GCs were formed from the GO sheets using hydrazine hydrate as the reducing agent. Typically, 0.1 g of the GO sheets was treated for 2 h by ultrasonication in a 250 mL mixture of water and ethanol with a ratio of Vwater/ethanol = 4/1 to obtain a uniform brown solution. Then, the required quantity of hydrazine hydrate was slowly added to the brown dispersion, which gradually became gray-black.2.3 Synthesis of 5,10,15,20-tetra-(4-aminophenyl)porphyrin
Synthesis of 5,10,15,20-tetra-(4-nitrophenyl)porphyrin: 7.34 g of 4-nitrobenzaldehyde was mixed with 20 mL of acetic anhydride, then the mixture was added into 250 mL of propionic acid at 140 °C. Pyrrole (3.36 mL) was added dropwise to the hot solution and the resultant mixture was refluxed for 0.5 h. The resulting solution was allowed to cool and stand in air for 2 h. Filtration of the tar-like mixture afforded a black solid which was washed with methanol (6 × 50 mL) and dried in vacuo. The residue was added into pyridine (60 mL) and the mixture was refluxed at 120 °C for 1 h. The resulting mixture was allowed to cool to room temperature and then to stand in a fridge (4 °C) for 14 h. Next, the mixture was filtered to remove the pyridine under vacuum. The residue was washed with acetone and a purple solid was obtained (1.3 g).Synthesis of 5,10,15,20-tetra-(4-aminophenyl)porphyrin: a solution of SnCl2·2H2O (6.52 g) in 14 mL of concentrated hydrochloric acid was added to a mixture of 5,10,15,20-tetra-(4-nitrophenyl)porphyrin (1.43 g) and concentrated hydrochloric acid (70 mL) drop by drop. The system was heated to 70 °C and kept for 0.5 h and then cooled at 4 °C. 140 mL of ammonia water (25%) was added into the system and was stirred for 1 h. Next, the suspension was filtered and the residue was washed with water and dried in vacuo. Finally, the raw product was purified by Soxhlet extraction with acetone and chloroform to gain violet 5,10,15,20-tetra-(4-aminophenyl)porphyrin.
2.4 Preparation of CG–aminoporphyrin nanohybrids
40 mg of 1-ethyl-3-(3-dimetylaminopropyl)carbodiimide hydrochloride (EDC, sigma) and 52 mg of N-hydroxysulfosuccinimide sodium salt (sulfo-NHS, sigma) were dissolved in 2 mL of deionized water. Then the solution was added into a 10 mL graphene capsule suspension (1 mg mL−1) to react for 15 min. Next, 8 mg of 5,10,15,20-tetra-(4-aminophenyl)porphyrin dissolved in 1 mL of THF was gradually added. The mixture was stirred at room temperature for 2 h and then transferred to a membrane bag for dialysis against pure water to remove unreacted molecules (the cutoff molecular weight was 12![[thin space (1/6-em)]](https://www.rsc.org/images/entities/char_2009.gif) 000).
000).
2.5 Preparation of the aminoporphyrin NRs
To prepare aminoporphyrin NRs, a reprecipitation method is used. Typically, a 400 μL (0.5 mg mL−1) aliquot of the aminoporphyrin solution in THF is added into 5 mL of milli-Q water under vigorous stirring at room temperature for 10 min. After the mixture is stirred for another 30 min, THF is removed by nitrogen blowing.2.6 Singlet oxygen detection
The 1O2 production of the GCs, aminoporphyrin NRs, and GC–aminoporphyrin conjugates was studied using SOSG as an indicator. Specifically, 60 μL of the SOSG solution (1 mg mL−1) was mixed with 3 mL of the dispersion containing 100 μg of the GCs, aminoporphyrin NRs or GC–aminoporphyrin conjugates. The mixtures were irradiated with white light (100 mW cm−2) for different durations. Fluorescence spectra of the irradiated samples were then measured with an excitation wavelength of 504 nm. The oxidized SOSG in the irradiated samples was quantified by its fluorescence intensity based on the 1O2 amount. The experiments for each group were run in triplicate.2.7 In vitro cytotoxicity evaluation
In vitro cytotoxicities of the GCs, aminoporphyrin NRs and GC–aminoporphyrin conjugates were evaluated using the standard 3-(4,5-dimethylthialzol-2-yl)-2,5-diphenyltetrazolium bromide (MTT) assay in the Hela cell line. The Hela cells were seeded on 96-well plates in Dulbecco’s modified Eagle’s medium (DMEM) containing 10% fetal bovine serum (FBS) under an atmosphere of 5% CO2. After growing overnight, the original medium in each well was removed and 200 μL of DMEM containing the designated concentrations of the GCs, the aminoporphyrin NRs or the GC–aminoporphyrin dispersion was added to the planed wells. After 12 h of incubation in the dark at 37 °C, the cells incubated with the GCs, the aminoporphyrin NRs or the GC–aminoporphyrins were irradiated under a xenon lamp with a power of 100 mW cm−2 for 15 min. The cells were then incubated at 37 °C for another 12 h and then the medium in each well was removed. Next, 180 μL of DMEM and 20 μL of the MTT solution (5 mg mL−1 in PBS) were added and incubated for 4 h. Subsequently, the medium containing MTT was completely removed, followed by the addition of 200 μL of DMSO to each well. After that, a micro-plate reader was used to measure the absorbance at 490 nm to determine cell viability. The cells incubated with a serum-supplemented medium represent 100% cell survival. To avoid random errors, five replicate wells were run for each concentration and control.2.8 In vivo animal experiments
All animal experiments were conducted at the Institute of Radiation Medicine Chinese Academy of Medical Science and were approved by the China Committee for Research and Animal Ethics in compliance with the law on experimental animals. PDT treatments were performed on 4 to 6 week-old nude mice after inoculation of the about 2–4 mm3 melanoma A375 tumor pieces. The xenografted mice were randomly divided into 6 groups (five mice per group). When the tumor volume reached about 100 mm3 PBS, the aminoporphyrin NRs, and the GC–aminoporphyrins were administered respectively by intratumoural injection at a dose of 2 mg kg−1 once every other day. Then, light treatment was performed 2 h after injection by irradiating the tumour regions with white LED light for 15 min. The changes in the tumor volumes in the mice were then monitored once every other day. The mice were sacrificed and their tumors were immediately removed and weighed after 14 days of treatment.2.9 Haematoxylin- and eosine-staining
Paraffin-embedded tumors and organs were cut into 7 μm sections and the sections were transferred to slides and dried overnight at room temperature, followed by drying in an oven at 43 °C. Then, the sections were stained and dehydrated according to the following method: the sections were incubated for 3 minutes with xylene, 1 minute with 100% ethanol, 2 minutes with 95% ethanol, 1 minute with 70% ethanol, 3 minutes with distilled water, 7 minutes with haematoxylin, 3 minutes with distilled water, and 30 seconds with eosin. Next, the sections were rinsed with distilled water and incubated again with an increasing gradient of ethanol (2 minutes of 70%, 95%, and 100% ethanol, respectively) and finally 1 minute with xylene. Finally, the sections were mounted, covered with a cover slip and dried overnight. Microscopy was performed to take images.2.10 Statistical analysis
All data are presented as the mean ± standard deviation (S.D.). The significant differences between groups were evaluated with Tukey’s method after analysis of variance (ANOVA). In all statistical analyses, p < 0.05 was considered to be statistically significant.3. Results and discussion
3.1 Preparation of the graphene capsules
The GCs were prepared using a simple reduction method. In this method, the GO sheets and hydrazine hydrate were used as precursors of the graphene capsules and reducing agent, respectively. The TEM images of the GCs show their morphology features as shown in Fig. 1. Differently shaped GCs were formed during the reduction of the GO sheets and they are about 300 nm in size (Fig. 1a and c). These GC are sealed because they are bellied under E-beam impact during TEM measurement. This type of GC was not observed earlier by self-assembly processes. Previously, researchers used sacrificial colloidal particles or α-Fe2O3 particles as the cores and then the GO or rGO sheets were covered on the surfaces of these cores to form shells. After the cores were removed, the shells became GCs.13,16,17 Obviously, GCs formed by self-assembly processes are not sealed. Therefore, it can be concluded that the sealed GCs are firstly achieved by our simple reduction method. It is worth noting that all graphene capsules are single without linking (Fig. 1d). However, when the graphene capsules and aminoporphyrins formed the GC–aminoporphyrin nanohybrids through a series of reactions, the two graphene capsules joined together appear as shown in Fig. 1b. Due to too small a size of the aminoporphyrin molecule compared with the graphene capsules they cannot be seen in the TEM image. The DLS measurement (see ESI, Fig. S1†) gives a hydrodynamic diameter of about 303 nm for the graphene capsules and 353 nm for the GC–aminoporphyrin nanohybrids.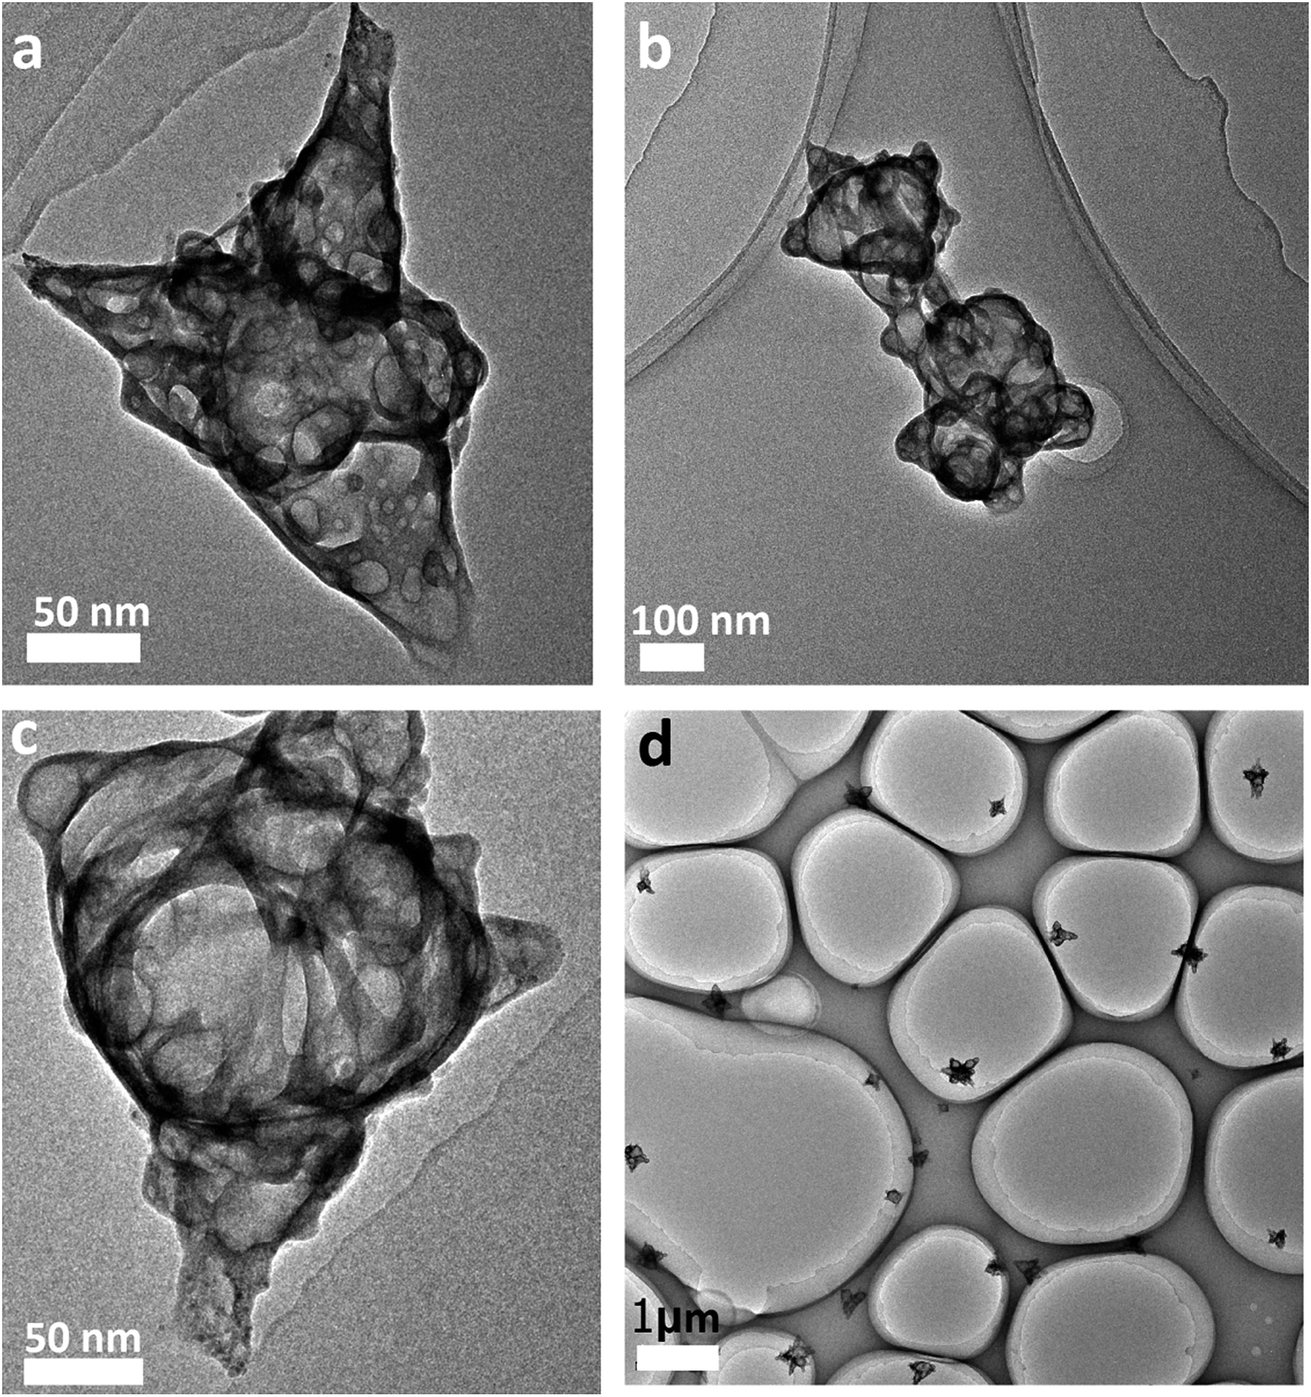 | ||
| Fig. 1 TEM images of the graphene capsules with different morphologies (a and c); TEM image of GC–aminoporphyrin nanohybrids (b); TEM image of many graphene capsules (d). | ||
Two factors may result in the formation of the sealed GCs. Firstly, the precursors of the GCs are large-sized, flat and thin GO sheets as shown in Fig. 2a. The TEM image reveals that the GO sheets are transparent under the electron beam, suggesting that the single-layer or few-layer graphene sheets were exfoliated from graphite. In addition, the GO sheets are shown to be large-sized and they have lateral dimensions of over 3 μm. Secondly, the concentration of the hydrazine hydrate was in an appropriate range from 0.5% to 0.8%. It is well known that some C atoms were functionalized with –OOH, –OH and –O– on the surfaces and edges of the GO sheets. When the hydrazine hydrate was added into the dispersion of the GO sheets it reduced some –OOH, –OH and –O– groups, resulting in the increase of sp2 domains. As a result, the hydrophobicity of the surface of the GO sheet would increase and the GO sheet would shrink to decrease its surface area in the aqueous solution. The formation of the graphene capsules initiated after the concentration of hydrazine hydrate reached 0.5% (Fig. 2b). In this case, a larger hydrophobicity of the surface of the rGO sheets due to the increase of the degree of reduction of the GO sheets tended to make the surface area minimize in the aqueous solution, leading to the rGO sheets gradually diffusing and forming sealed GCs. Interestingly, the reduction rates on the different surfaces of the GO sheets are different. The surfaces with larger reduction rates are inward and the surfaces with smaller reduction rates are outward. Otherwise, the GCs cannot form. When the concentration of hydrazine hydrate was below 0.5%, the GO sheets were reduced to become rGO sheets. When the concentration of hydrazine hydrate was over 0.8%, the GO sheets were overly reduced, resulting in open graphene capsules with bigger holes (see ESI, Fig. S2†).
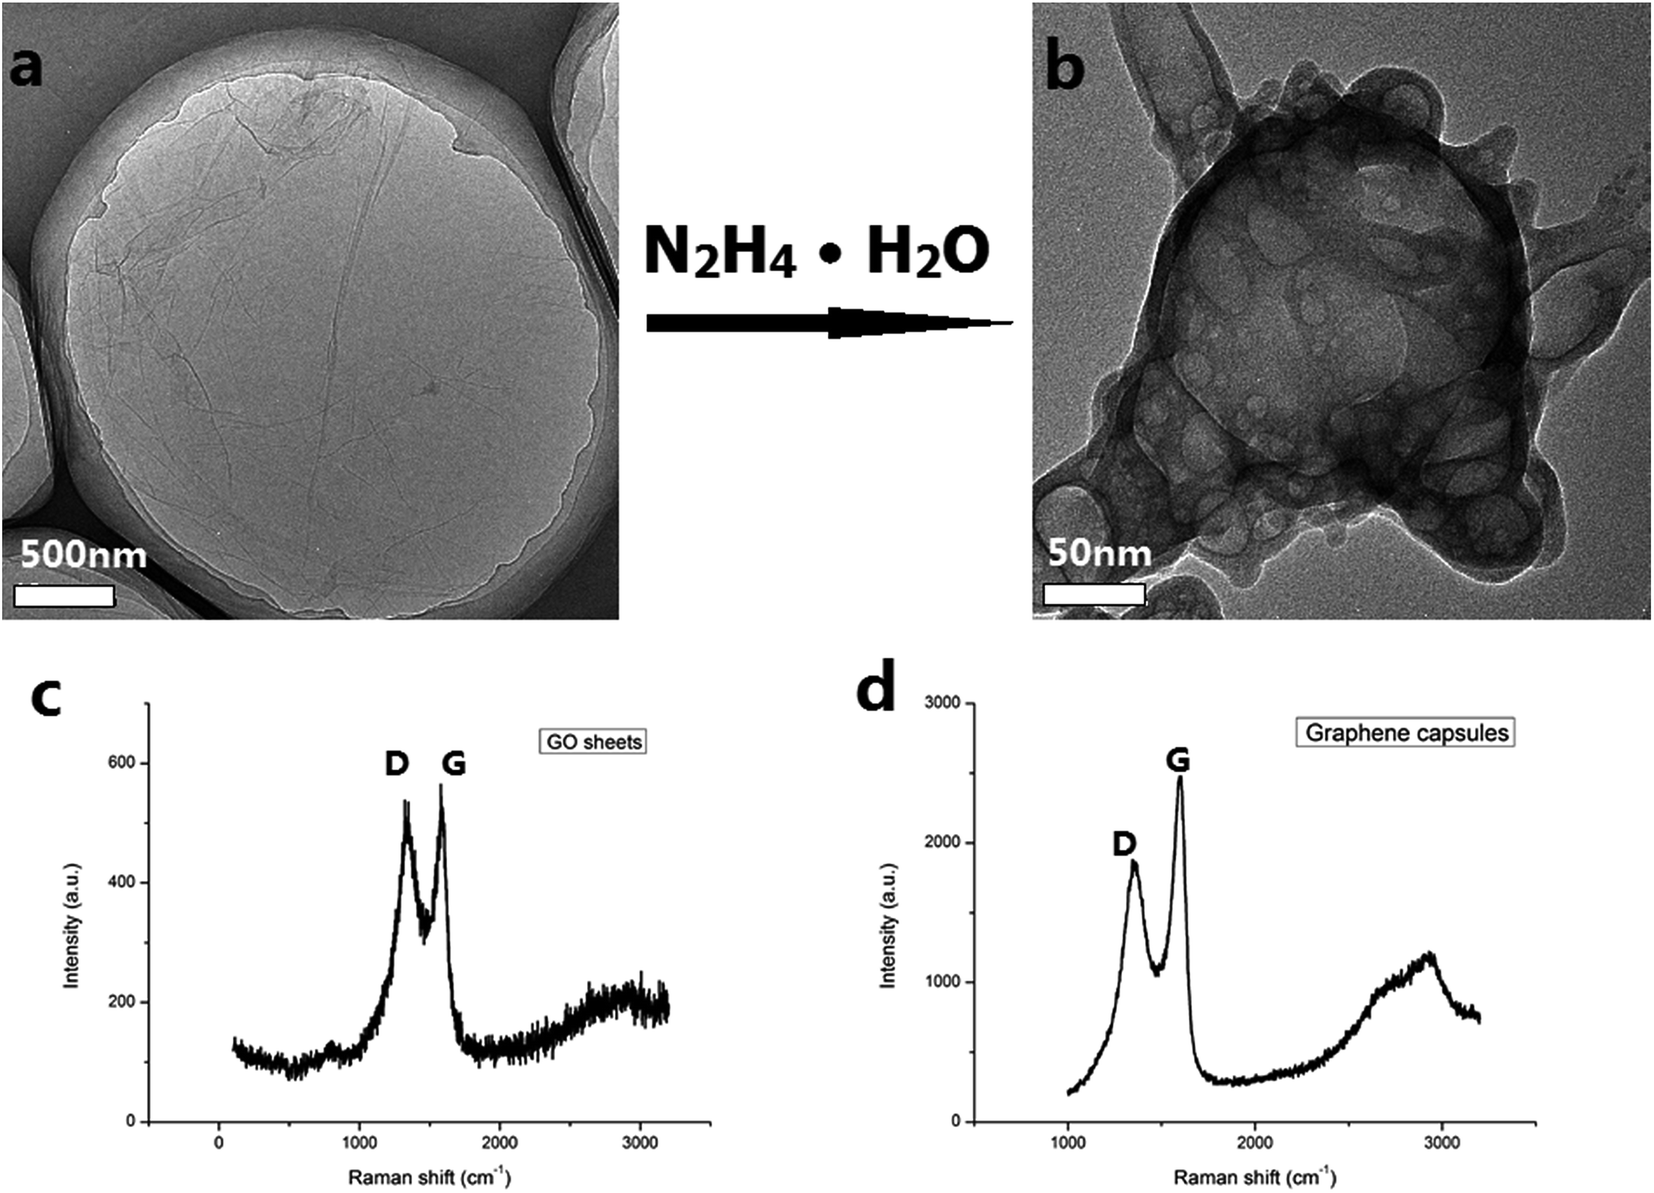 | ||
| Fig. 2 TEM images of the GO sheets (a) and the single graphene capsule (b) with the arrow between the two images indicating that the GO sheets were reduced with hydrazine hydrate to form the graphene capsule. Raman spectra of the GO sheets (c) and the graphene capsules (d). | ||
Porphyrin-based functional carbon materials have been extensively researched and the research indicates that porphyrins can be used to functionalize carbon nanotubes, graphene and nanohorns on the basis of π–π interactions between them. In the nanohybrids formed, the electron-transfer occurred from the porphyrin to the carbon nanotubes, graphene and nanohorns, respectively. So far, no study has been reported for the functionalization of GCs to build nanohybrids with porphyrins with GCs as the carbon nanomaterial.
3.2 Preparation of the GC–aminoporphyrins
The GC–aminoporphyrin nanohybrids were synthesized through a series of reactions as described in Scheme 1.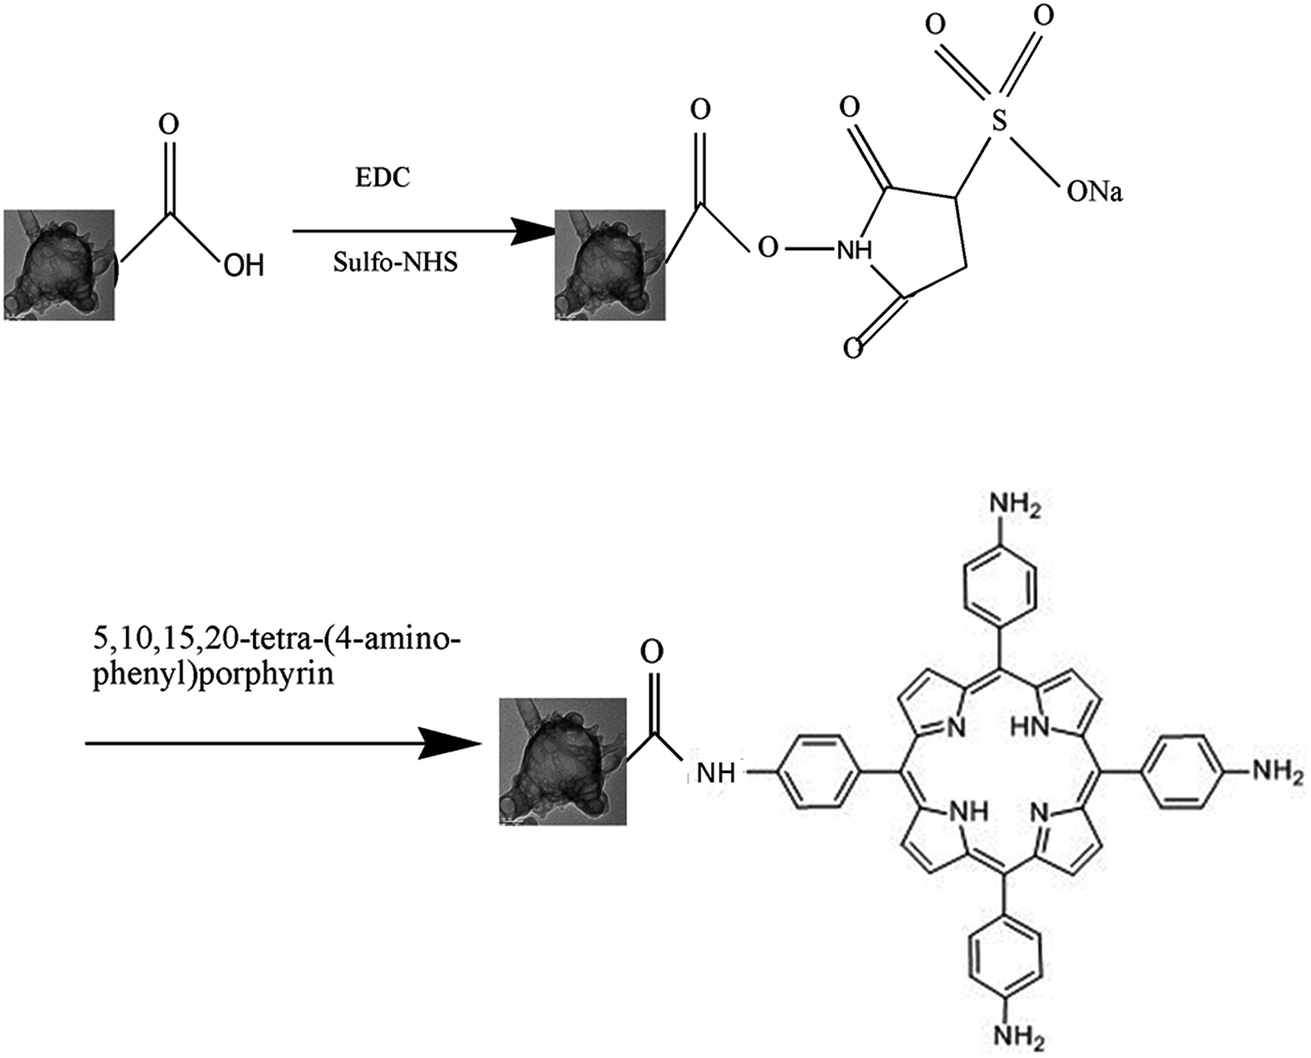 | ||
| Scheme 1 Synthesis reaction scheme of the conjugate of the graphene capsule and 5,10,15,20-tetra-(4-aminophenyl)porphyrin. | ||
To confirm the formation of the amide bond which linked the GCs and the aminoporphyrin, FT-IR spectroscopy was performed on the GCs, aminoporphyrin and GC–aminoporphyrin. In the FT-IR spectrum of the GCs (Fig. 3a), the absorption bands at 3000–3500 cm−1 are assigned to the stretching vibrations of –OH groups, and the absorption intensity of the C![[double bond, length as m-dash]](https://www.rsc.org/images/entities/char_e001.gif) C peak at 1549 cm−1 is stronger so that the CO absorption becomes a shoulder peak. In addition, the absorption peaks at 2923 cm−1 and 1071 cm−1 are attributed to C–H and –O–, respectively. For aminoporphyrin, a series of peaks found in the FT-IR spectra in the range of 700 to 1700 cm−1 were attributed to the typical modes of the pyridine cycles, including the sharp peaks at 1599 cm−1, 794 cm−1 and 720 cm−1, which are attributed to the CC and CN stretching vibrations, 4-monosubstituted ring C–H deformation vibrations and 4-monosubstituted ring deformation vibrations, respectively (Fig. 3b). Comparing the typical FT-IR spectra of the GC–aminoporphyrin and those of the GCs and aminoporphyrin as controls, it could be seen that a new peak appeared at 1640 cm−1, which is attributed to the amide bond. This indicated that the aminoporphyrin had been covalently attached to the surface of the GCs through the amide bond (Fig. 3c).
C peak at 1549 cm−1 is stronger so that the CO absorption becomes a shoulder peak. In addition, the absorption peaks at 2923 cm−1 and 1071 cm−1 are attributed to C–H and –O–, respectively. For aminoporphyrin, a series of peaks found in the FT-IR spectra in the range of 700 to 1700 cm−1 were attributed to the typical modes of the pyridine cycles, including the sharp peaks at 1599 cm−1, 794 cm−1 and 720 cm−1, which are attributed to the CC and CN stretching vibrations, 4-monosubstituted ring C–H deformation vibrations and 4-monosubstituted ring deformation vibrations, respectively (Fig. 3b). Comparing the typical FT-IR spectra of the GC–aminoporphyrin and those of the GCs and aminoporphyrin as controls, it could be seen that a new peak appeared at 1640 cm−1, which is attributed to the amide bond. This indicated that the aminoporphyrin had been covalently attached to the surface of the GCs through the amide bond (Fig. 3c).
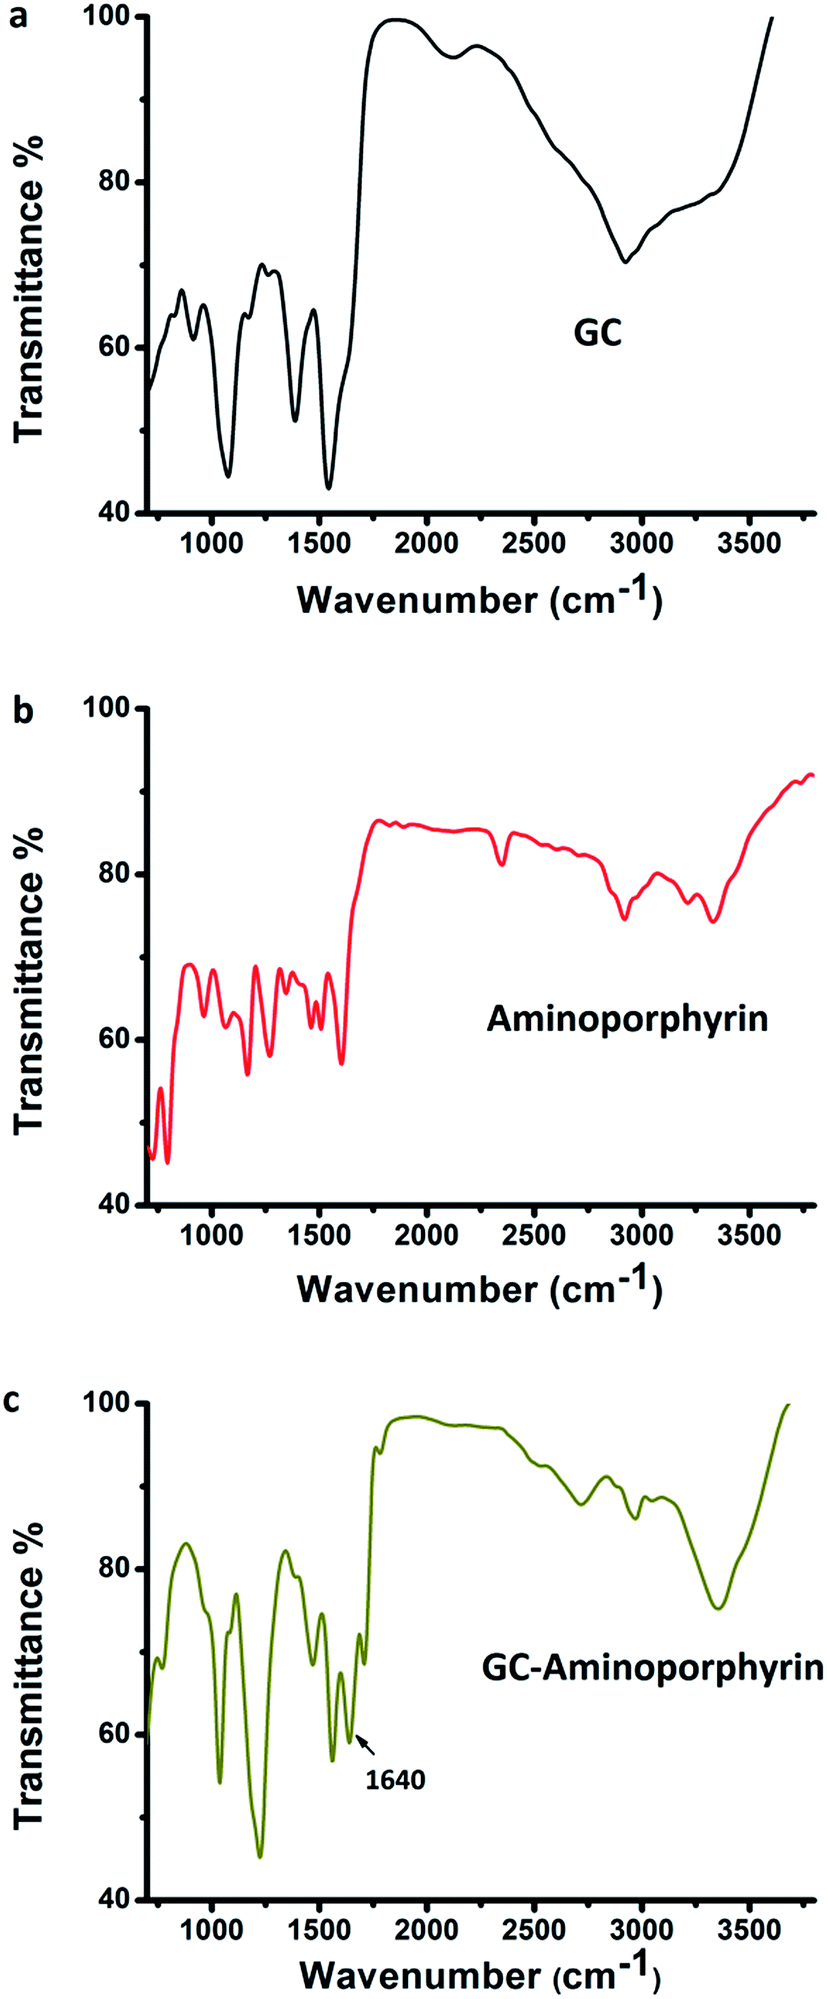 | ||
| Fig. 3 FT-IR spectra of the graphene capsules (a), 5,10,15,20-tetra-(4-aminophenyl)porphyrin (b) and the GC–aminoporphyrin (c). | ||
Appropriate concentrations of hydrazine hydrate (ranging from 0.5% to 0.8%) were used to reduce the GO sheets to form GCs. It is well known that some C atoms were functionalized with –OOH groups on the surfaces and edges of the GO sheets. When hydrazine hydrate was added to the dispersion of GO sheets it reduced some –COOH groups, but there were some excess –COOH groups on the surface of the GCs. This can be confirmed by the fact that the GCs are hydrophilic and can be evenly dispersed in water. When the concentration of hydrazine hydrate was over 0.8%, the GO sheets were fully reduced, resulting in the GCs becoming hydrophobic and a black precipitate falling to the bottom of the vials. In addition, in the FT-IR spectrum of the GCs, there are absorption bands at 3000–3500 cm−1 of –OH groups and the absorption shoulder peak of CO groups at about 1700 cm−1, which indicate that there are –COOH groups on the surface of the GCs. In the presence of EDC and sulfo-NHS, the reactivity between the –COOH groups on the surface of the GCs and the –NH2 groups of the aminoporphyrins is high and the aminoporphyrins are covalently linked to the graphene capsules by amidation.
The existence of aminoporphyrin in the GC–aminoporphyrin nanohybrid was confirmed by thermogravimetric analysis. The TG curves of the samples were determined directly by filling a GC–aminoporphyrin powder into a thermogravimetric analysis sample pan and then it was heated from 30 to 700 °C at 10 °C min−1 in a N2 atmosphere on a thermogravimetric analyzer to determine the mass loss of the sample. An obvious weight loss appears from 320 °C to 700 °C, which corresponds to the mass loss of the mixture containing aminoporphyrin, EDC and sulfo-NHS. XPS was carried out to evaluate the composition of the surface of the GC–aminoporphyrin nanohybrid. A wide scan XPS was obtained for the sample and is shown in Fig. 4a, displaying the characteristic C 1s, N 1s, and O 1s core-level photoemission peaks at 285, 399, and 532 eV, respectively. The carbon atom is dominant in the GC–aminoporphyrin nanohybrid with an atomic percent of 57.8%. The atomic percent of N is 20.6% which is higher than that of the GCs due to the existence of aminoporphyrin in the GC–aminoporphyrin nanohybrid (see ESI, Fig. S3†). The load of porphyrin in the nanohybrid was determined via absorption measurements and the value is 6.5%.
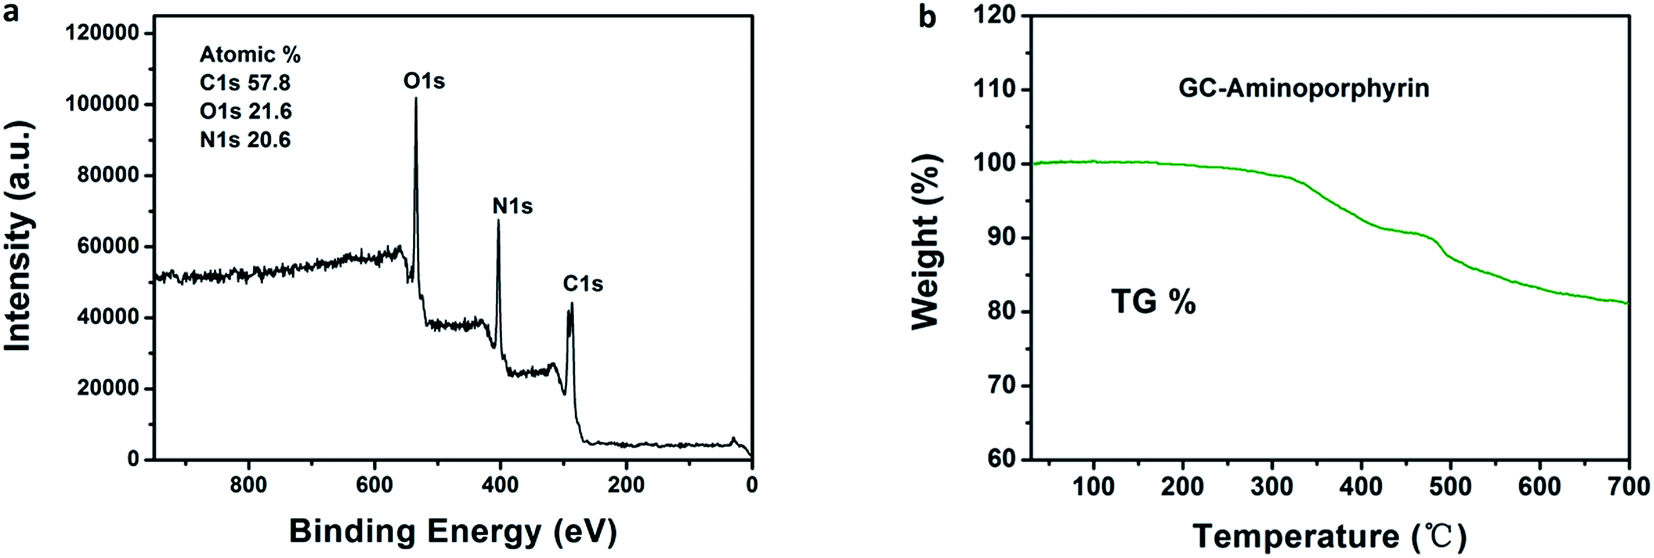 | ||
| Fig. 4 Wide scan XPS of the GC–aminoporphyrin (a); thermogravimetric analysis of the GC–aminoporphyrin powder (b). | ||
3.3 Singlet oxygen detection
Aminoporphyrin NRs were prepared using a reprecipitation method and their morphology and size were investigated using SEM (see ESI, Fig. S4†). The singlet oxygen generation of the GCs, aminoporphyrin NRs and GC–aminoporphyrins was evaluated with the standard SOSG probe. Upon the reaction between SOSG and 1O2, the intramolecular electron transfer within SOSG is prohibited, which recovers the quenched green fluorescence with high selectivity.36,37 As shown in Fig. 5, when the mixture of SOSG and GCs, aminoporphyrin NRs or GC–aminoporphyrins is irradiated with visible light, the fluorescence intensity of SOSG at 525 nm exhibits a time-dependent increase, indicating the gradual generation of 1O2. Under white light irradiation, the generation of 1O2 of GC–aminoporphyrins is highest among the three PSs (Fig. 5a–c). Fig. 5d illustrates the changes in SOSG’s fluorescence intensity when irradiating the mixtures of SOSG with GCs, aminoporphyrin NRs, and GC–aminoporphyrins, respectively. The lower 1O2 generation of the aminoporphyrin NPs may be due to aggregation quenching resulting from π–π stacking of the planar molecules. For the GC–aminoporphyrins, Förster Resonance Energy Transfer between the GCs and aminoporphyrins is probably the reason for the enhancement of 1O2 generation of GC–aminoporphyrins. These results demonstrate good potential for the application of GC–aminoporphyrins as PS agents.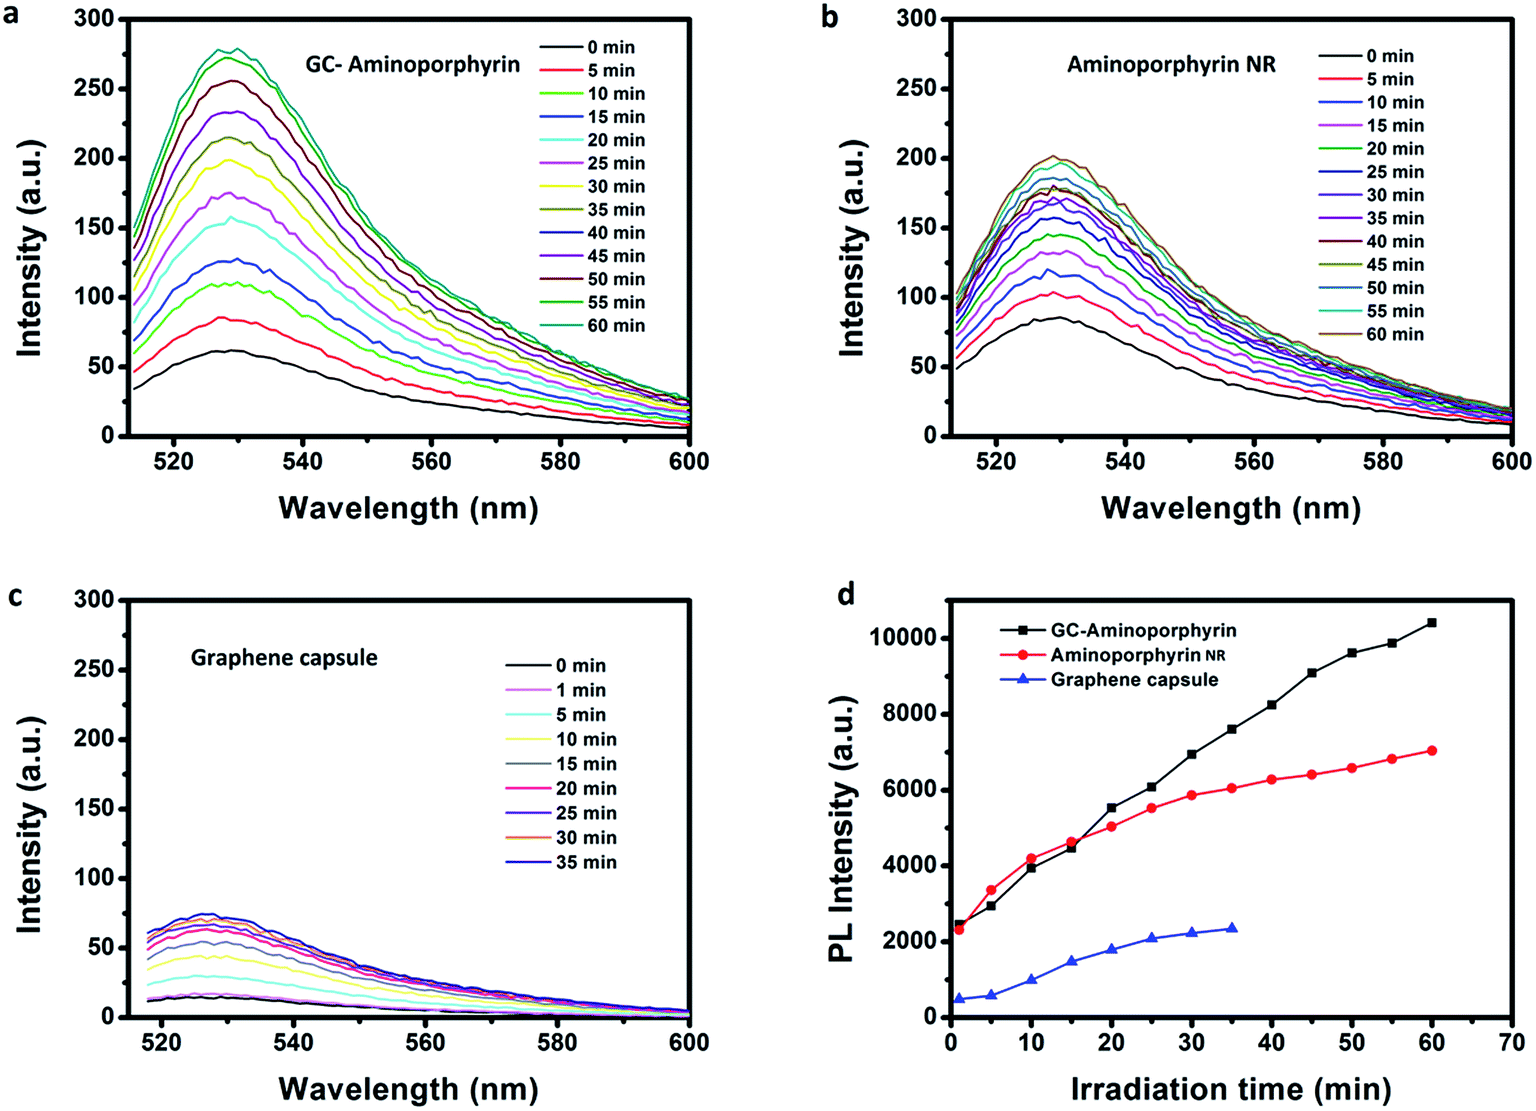 | ||
| Fig. 5 Fluorescence spectra of the SOSG solution incubated with GC–aminoporphyrins, aminoporphyrin NRs or GCs over increasing irradiation time (a–c). The evolution of the fluorescence intensity of SOSG at 525 nm over different irradiation times ((d), the fluorescence intensities are calculated by peak area). | ||
Fluorescence spectroscopy is a useful tool for assessing the degree of electronic communication in the excited states of the nanohybrids. Fig. 6b shows the PL spectra of the GCs, aminoporphyrins and GC–aminoporphyrins. For the GCs, the dominant fluorescence emission peak is at 503 nm upon 365 nm excitation. The aminoporphyrin sample exhibits a main fluorescence peak at 650 nm with the same excitation wavelength. The fluorescence emission of the photoexcited GCs at 490 nm is significantly quenched in the covalently associated GC–aminoporphyrins, confirming that the porphyrin moieties are in close proximity to the GCs in the nanohybrids. FRET between the GCs and aminoporphyrins occurred. Very interestingly, unlike other carbon materials including fullerenes, carbon nanotubes and graphene as electron acceptors, in our results, the GCs were found to be electron donors. Excitation and emission spectra of the aminoporphyrins (acceptor) and the GCs (donor) are shown in Fig. 6a.
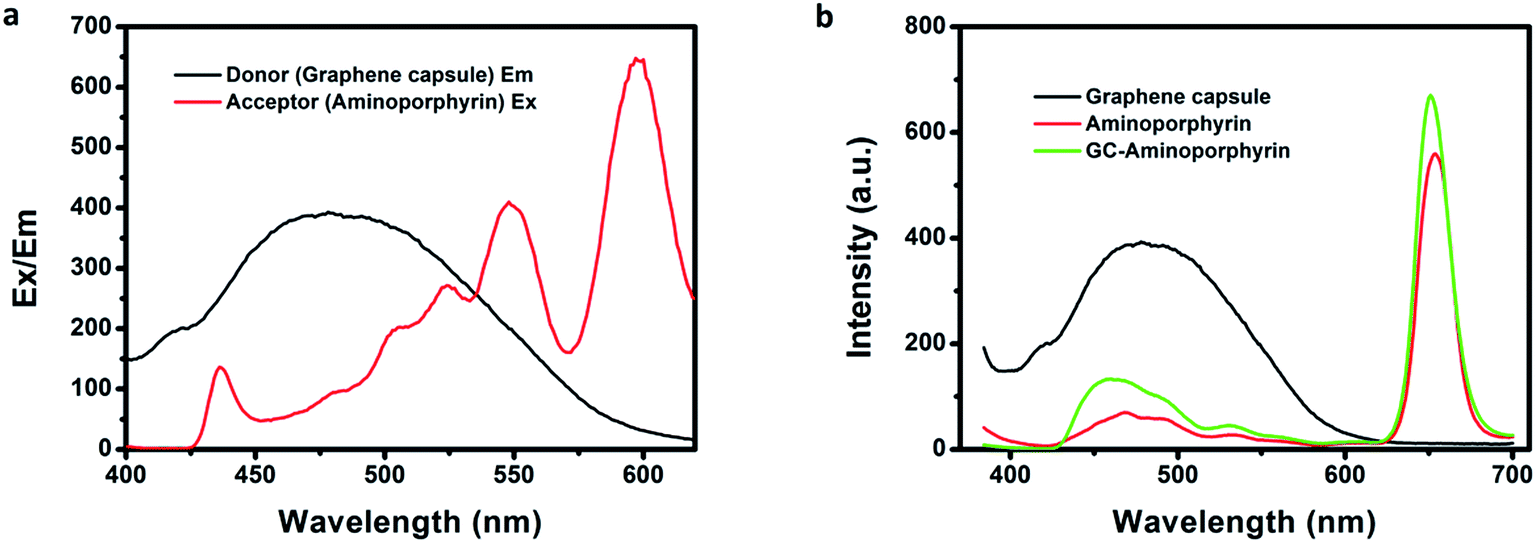 | ||
| Fig. 6 Excitation spectrum of aminoporphyrin and emission spectrum of the graphene capsules (a). PL spectra of the graphene capsules, aminoporphyrin and GC–aminoporphyrins under a 365 nm excitation wavelength (b) (aminoporphyrin in chloroform, 0.5 mg mL−1; graphene capsules in water, 5 mg mL−1; GC–aminoporphyrin in water, 5 mg mL−1). | ||
3.4 Cell cytotoxicity assay
To evaluate the PDT efficiency of the GC–aminoporphyrins, we measured the viability of treated Hela cell lines using a 3-(4,5-dimethylthiazol-2-yl)-2,5-diphenyltetrazolium bromide (MTT) assay. Hela cells were individually incubated for 24 h with the GCs, aminoporphyrin NRs and GC–aminoporphyrins (with or without irradiation). The control group corresponds to the cells with only irradiation but without any PSs or only PSs without irradiation. As presented in Fig. 7, the three PSs including the GCs, aminoporphyrin NRs and GC–aminoporphyrins with irradiation show dose-dependent toxicity while the control groups exhibit no toxicity. This suggests that the irradiation itself and the PSs in the dark exhibit no cytotoxicity. As shown in Fig. 7, when the doses of the PSs are 6.25, 12.5, 25, 50 and 100 μg mL−1, respectively, the cell viability induced by the GC–aminoporphyrins is lower than that induced by the aminoporphyrin NRs. On average, the former accounted for 77% of the latter. The GC–aminoporphyrins have the highest cytotoxic efficacy upon irradiation as a consequence of the higher generation of 1O2 from them, which leads to reactions between 1O2 and the tumor cells and to the subsequent killing of cancer cells by chemical oxidation.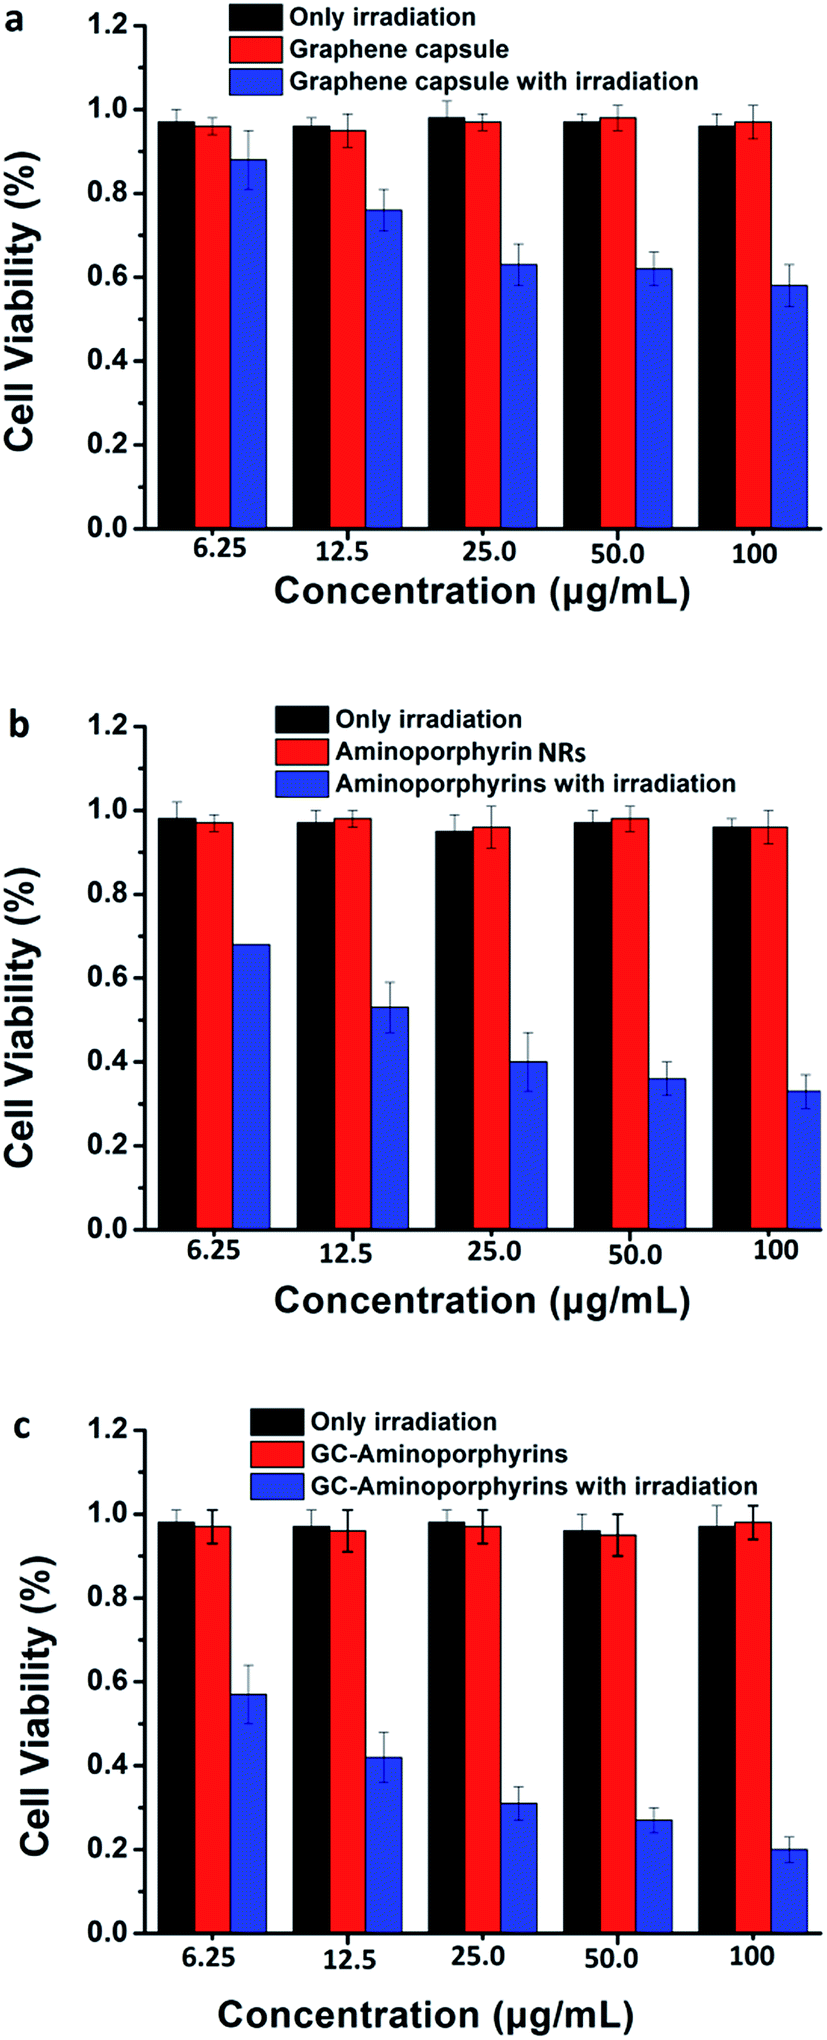 | ||
| Fig. 7 Hela cell viability at different concentrations of graphene capsules (a), aminoporphyrin NRs (b), and GC–aminoporphyrin (c). | ||
3.5 In vivo animal experiment and biosafety
Being aware of the high light-induced 1O2 generation capability, we finally carried out in vivo PDT treatment researches using female nude mice with melanoma A375 tumor pieces as xenografts. Seven days after inoculation, the average volume of tumors reached ∼100 mm3. A total of 30 tumor-bearing mice were randomly divided into 6 groups (n = 5 per group) as follows: (1) control group by PBS injection only; (2) control group by white light exposure only; (3) aminoporphyrin NR injection only without light exposure; (4) GC–aminoporphyrin injection only without light exposure; (5) aminoporphyrin NR injection plus white light exposure; (6) GC–aminoporphyrin injection plus white light exposure. At 2 h post-injection, the tumor regions were irradiated with white LED light. We then assessed the photodynamic effects of each group by monitoring the tumor volumes over a period of 14 days. At day 15, all test mice were sacrificed and the corresponding tumors were excised for further studies. The tumor volumes in mice receiving GC–aminoporphyrins with white light irradiation were significantly inhibited (Fig. 8c). In contrast, no significant differences in tumor volumes were found among the four control groups. These results confirm that the GC–aminoporphyrins are excellent PSs. Photographs of the sacrificed mice and the tumors from the sacrificed mice are shown in Fig. 8a and b. These results indicate that the present GC–aminoporphyrin dose has predominant tumor growth inhibitory efficacy. Usually, in PDT, absorption in the long wavelength region is desired, however, PSs with a short excitation wavelength can also be used as PDT reagents for the treatment of skin cancer or lesions. In our work, GC–aminoporphyrins as PSs against the human malignant melanoma A375 are highly efficient.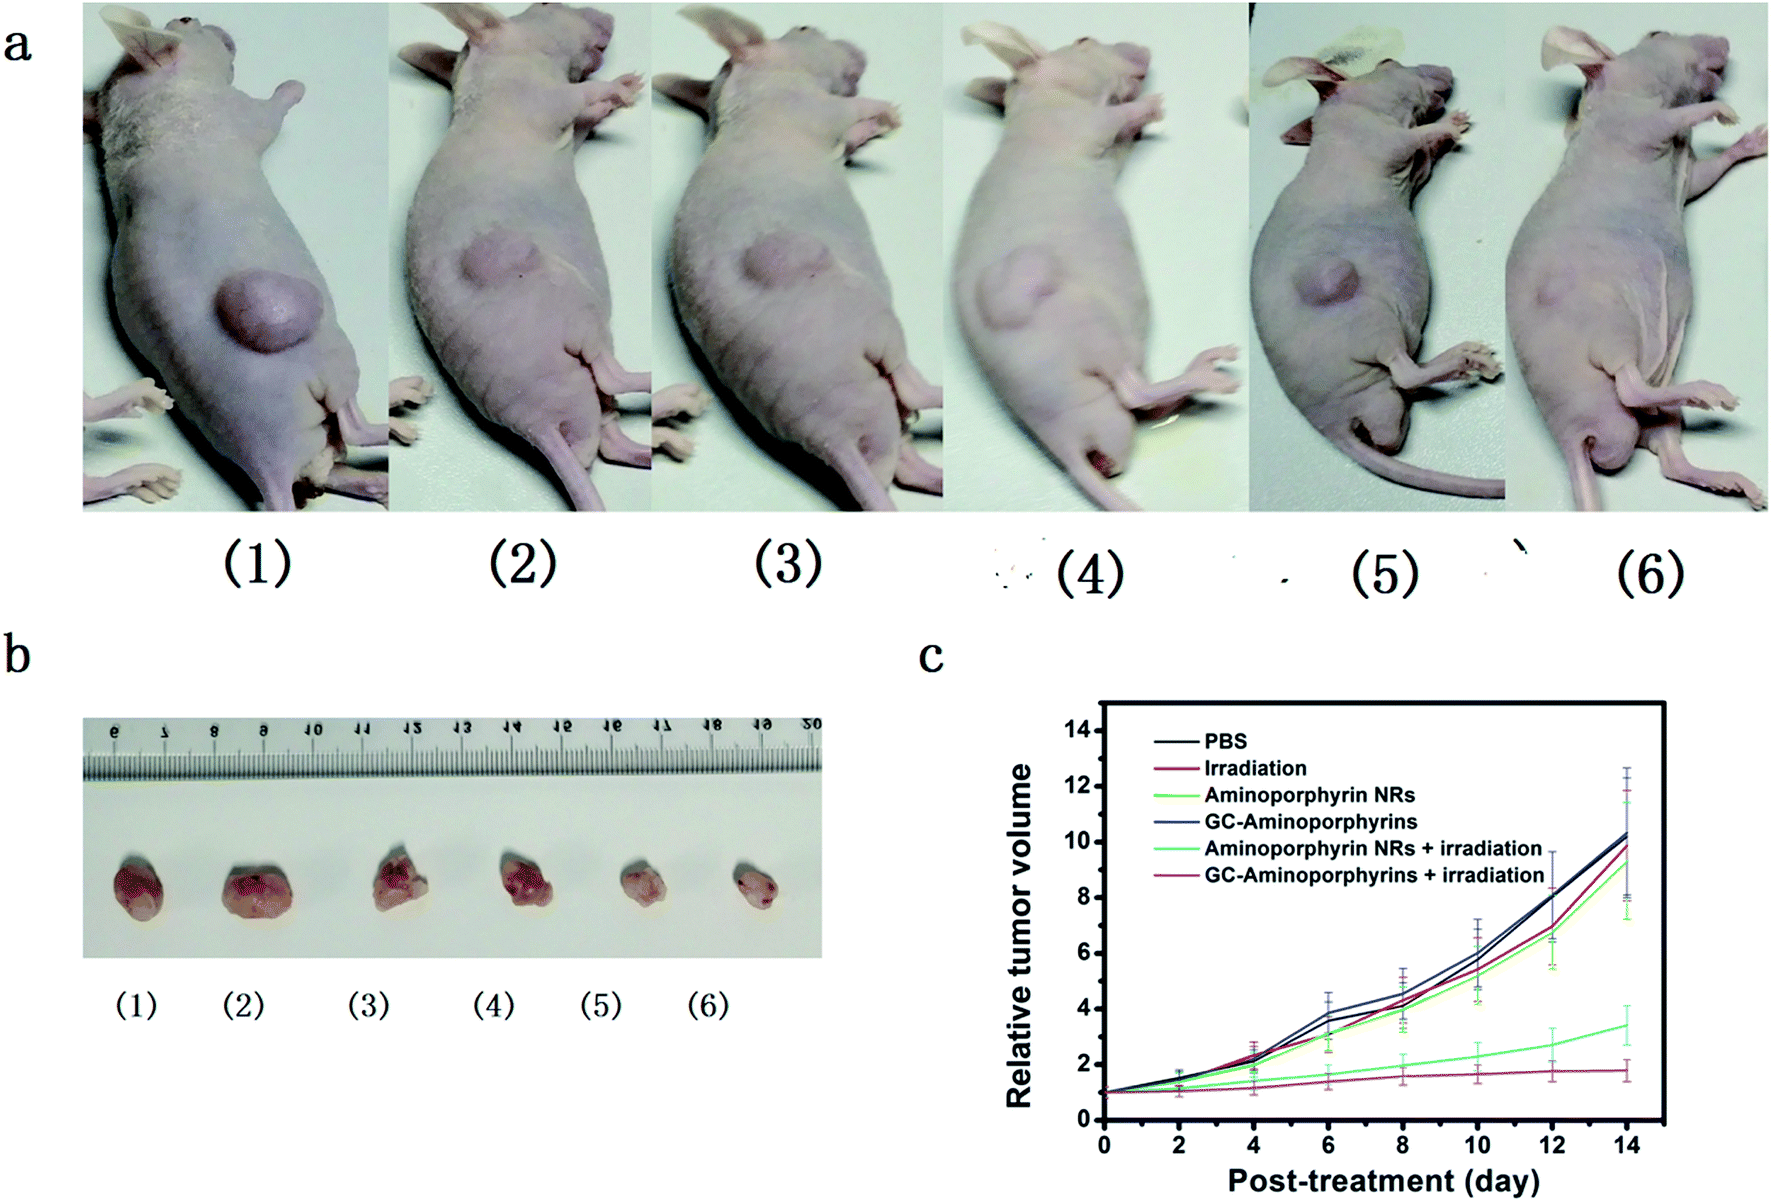 | ||
| Fig. 8 In vivo antitumor activity of the aminoporphyrin NRs and GC–aminoporphyrins: (a) photographs of mice after various treatments of the PBS injection (1), light exposure (2), aminoporphyrin NR injection (3), GC–aminoporphyrin injection (4), aminoporphyrin NR injection plus light exposure (5) and GC–aminoporphyrin injection plus light exposure (6); (b) corresponding images of excised tumors at the time of sacrifice from the nude tumor-bearing mice after 14 days of treatment; (c) time-dependent tumor growth curves after different treatments. | ||
H&E staining was performed on tissue sections of the malignant melanoma A375 tumors from each group after treatment as shown in Fig. 9. It is found that most tumor cells were severely damaged or destroyed in mice treated with the GC–aminoporphyrins and irradiated with a Xe lamp with a 400 nm filter. Compared to the four control groups, obvious cell apoptosis can also be observed for the tumor treated with aminoporphyrin NRs under Xe lamp illumination. In the other groups, there was no tumor cell death, suggesting the successful destruction of tumor cells by GC–aminoporphyrins and aminoporphyrin NRs with the irradiation of white light. This result indicates that the PDT effect of the GC–aminoporphyrins against the malignant melanoma A375 tumor is better than that of the aminoporphyrin NRs.
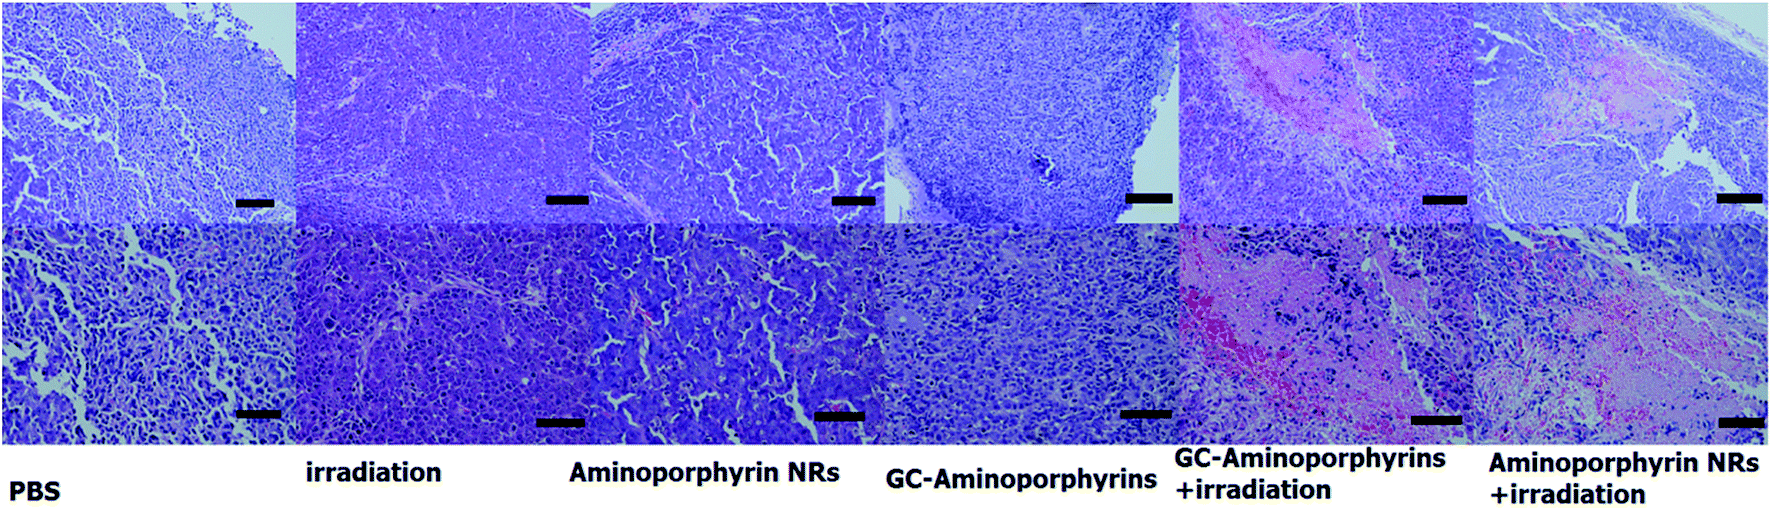 | ||
| Fig. 9 Qualitative histological analysis of tumors with representative hematoxylin- and eosin-stained histological sections (scale bar upper row 100 μm, lower row 50 μm). | ||
To evaluate the biosafety of the GC–aminoporphyrins as PSs in vivo, after 14 days of treatments with the GC–aminoporphyrins and the PBS buffer, healthy organs including lung, liver, spleen, kidney and heart were excised from the tumor-bearing mice. The hematoxylin and eosin (H&E) staining images of these organs from the tumor-bearing mice in different groups, respectively, are shown in Fig. 10. In the group of the GC–aminoporphyrin treatment, neither noticeable organ damage nor inflammation lesions were found as compared to the control groups, suggesting that there was no obvious lung, liver, spleen, kidney and heart dysfunction in mice that was induced by the GC–aminoporphyrin with white light irradiation.
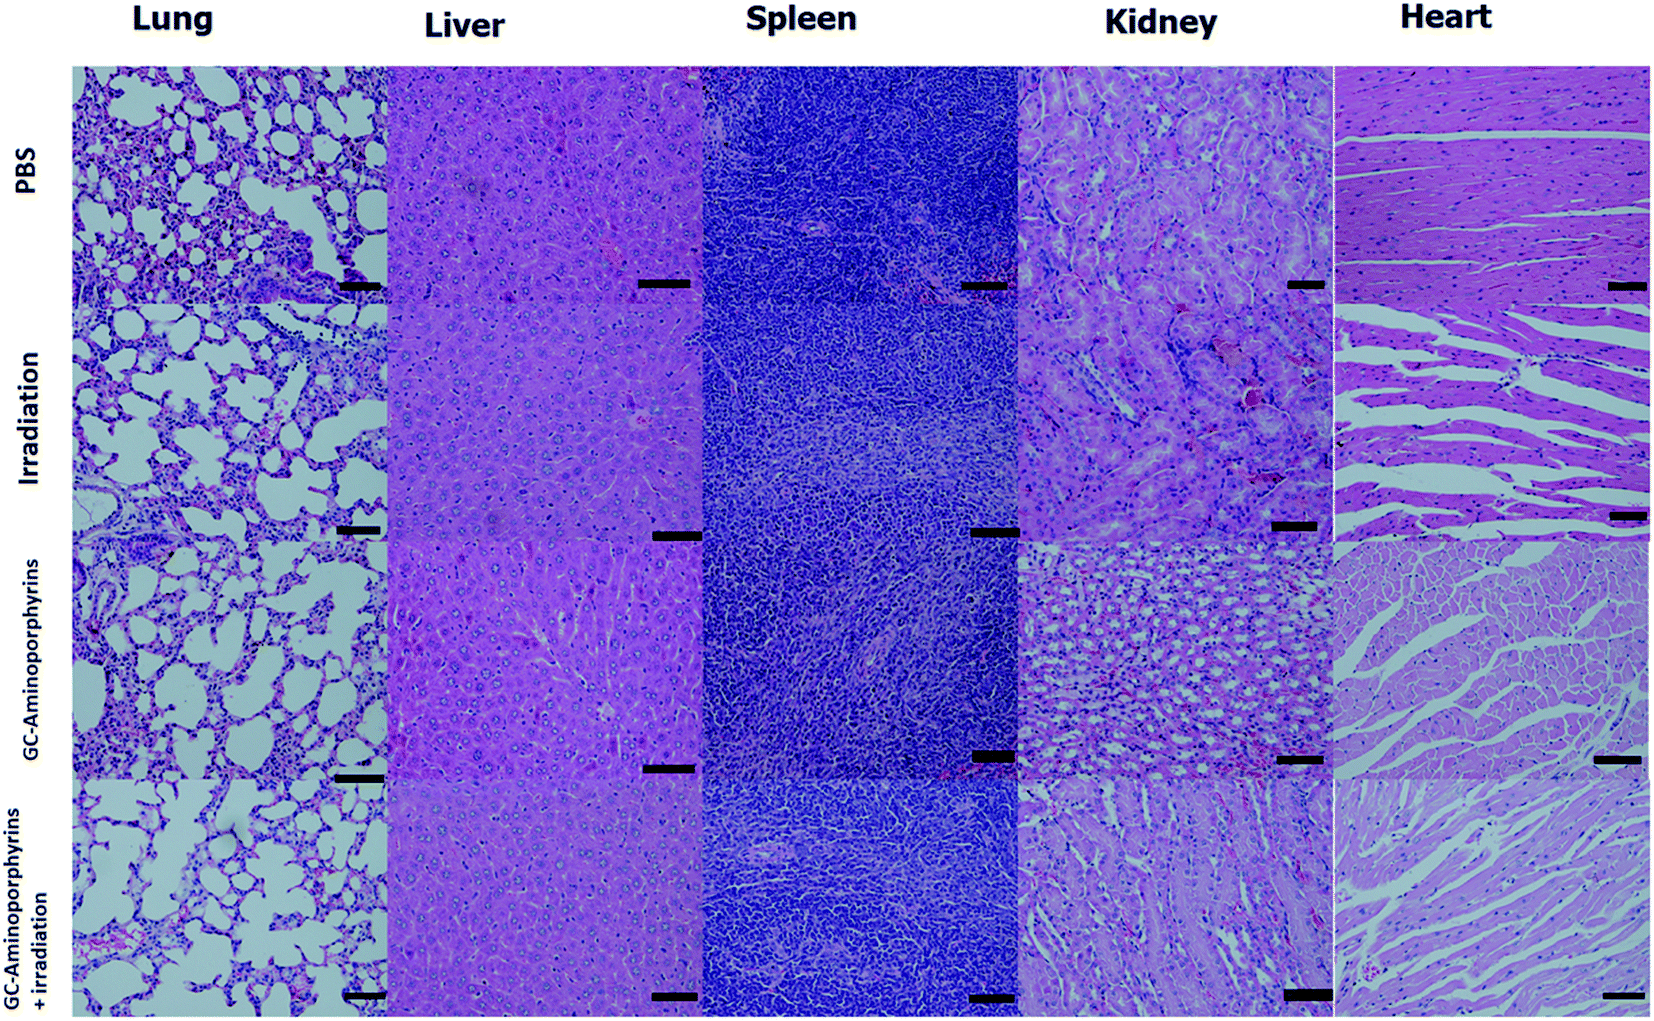 | ||
| Fig. 10 H&E staining images of major organs (lung, liver, spleen, kidney and heart) of the tumor-bearing mice in groups of the control and the GC–aminoporphyrins (scale bar 50 μm). | ||
4. Conclusions
In summary, we firstly developed a simple method to fabricate sealed GCs that were about 300 nm in size and had different shapes. GC–aminoporphyrins are formed by covalent combination between the GCs and 5,10,15,20-tetra-(4-aminophenyl)porphyrin. Based on the fluorescence quenching of the GCs by aminoporphyrin, the GCs are electron donors and electron transfer occurred from the GCs to the aminoporphyrin. The prepared GC–aminoporphyrins possess good biocompatibility and can efficiently generate singlet oxygen. Importantly, the as-prepared GC–aminoporphyrin nanohybrids as a novel PS with a short excitation wavelength can be used in PDT for the treatment of melanoma A375 with high efficiency.Conflicts of interest
There are no conflicts to declare.Acknowledgements
This work was supported by the Key Project of Tianjin Sci-Tech Support Program (No. 08ZCKFSH01400).References
- A. Qurashi, K. S. Subrahmanyam and P. Kumar, J. Mater. Chem. C, 2015, 3, 11959 RSC.
- K. P. Loh, S. W. Tong and J. S. Wu, J. Am. Chem. Soc., 2016, 138, 1095 CrossRef CAS PubMed.
- M. C. Hu, Z. H. Yao and X. Q. Wang, Ind. Eng. Chem. Res., 2017, 56, 3477 CrossRef CAS.
- V. Georgakilas, J. N. Tiwari, K. C. Kemp, J. A. Perman, A. B. Bourlinos, K. S. Kim and R. Zboril, Chem. Rev., 2016, 116, 5464 CrossRef CAS PubMed.
- Z. Mics, K.-J. Tielrooij, K. Parvez, S. A. Jensen, I. Ivanov, X. L. Feng, K. Müllen, M. Bonn and D. Turchinovich, Nat. Commun., 2015, 6, 7655 CrossRef CAS PubMed.
- A. Ambrosi, C. K. Chua, N. M. Latiff, A. H. Loo, C. H. A. Wong, A. Y. S. Eng, A. Bonanni and M. Pumera, Chem. Soc. Rev., 2016, 45, 2458 RSC.
- P. Surwade, S. N. Smirnov, I. V. Vlassiouk, R. R. Unocic, G. M. Veith, S. Dai and S. M. Mahurin, Nat. Nanotechnol., 2015, 10, 459 CrossRef PubMed.
- P. S. Fernández, M. Bissett and H. Ago, Chem. Soc. Rev., 2017, 46, 4572 RSC.
- H. C. Lee, W. W. Liu, S. P. Chai, A. R. Mohamed, A. Aziz, C. S. Khe, N. M. S. Hidayah and U. Hashim, RSC Adv., 2017, 7, 15644 RSC.
- J. C. Wang, S. Y. Kondrat, Y. Y. Wang, G. L. Brett, C. Giles, J. K. Bartley, L. Lu, Q. Liu, C. J. Kiely and G. J. Hutchings, ACS Catal., 2015, 5, 3575 CrossRef CAS.
- M. N. Samani, H. K. Kim, S. H. Park, H. C. Youn, D. Mhamane, S. W. Lee, M. S. Kim, J. H. Jeong, S. H. Shishavan, K. C. Roh, S. F. K. Bozorg and K. B. Kim, RSC Adv., 2016, 6, 50941 RSC.
- W. Zhang, T. Huynh, P. Xiu, Y. Zhou, C. Ye and B. Q. Luan, Carbon, 2015, 94, 859 Search PubMed.
- J. Hong, K. Char and B.-S. Kim, J. Phys. Chem. Lett., 2010, 1, 3442 CrossRef CAS.
- R. Kurapati and A. M. Raichur, Chem. Commun., 2012, 48, 6013 RSC.
- S. A. Odom, T. P. Tyler, M. M. Caruso, J. A. Ritchey, M. V. Schulmerich, S. J. Robinson, R. Bhargava, N. R. Sottos, S. R. White, M. C. Hersam and J. S. Moore, Appl. Phys. Lett., 2012, 101, 043106 CrossRef.
- Q. He, T. Yuan, S. Wei, N. Haldolaarachchige, Z. Luo, D. P. Young, A. Khasanov and Z. Guo, Angew. Chem., Int. Ed., 2012, 51, 8842 CrossRef CAS PubMed.
- Y. N. Singhbabu, K. K. Sahu, D. Dadhich, A. K. Pramanick, T. Mishra and R. K. Sahu, J. Mater. Chem. C, 2013, 1, 958 RSC.
- C. G. Hu, L. X. Lv, J. L. Xue, M. H. Ye and L. T. Qu, Chem. Mater., 2015, 27, 5253 CrossRef CAS.
- C. Seidl, J. Ungelenk, E. Zittel, T. Bergfeldt, J. P. Sleeman and U. Schepers, ACS Nano, 2016, 10, 3149 CrossRef CAS PubMed.
- L. Cheng, C. Wang, L. Feng, K. Yang and Z. Liu, Chem. Rev., 2014, 114, 10869 CrossRef CAS PubMed.
- K. Ishii, Coord. Chem. Rev., 2012, 3, 256 Search PubMed.
- C. Seidl, J. Ungelenk, E. Zittel, T. Bergfeldt, J. P. Sleeman, U. Schepers and C. Feldmann, ACS Nano, 2016, 10, 3149 CrossRef CAS PubMed.
- J. F. Lovell, T. W. B. Liu, J. Chen and G. Zheng, Chem. Rev., 2010, 110, 2839 CrossRef CAS PubMed.
- Z. Hu, Y. D. Huang, S. F. Sun, W. C. Guan, Y. H. Yao, P. Y. Tang and C. Y. Li, Carbon, 2012, 50, 994 CrossRef CAS.
- Z. Hu, J. Li, C. Y. Li, S. J. Zhao, N. Li, Y. F. Wang, F. Wei, L. Chen and Y. D. Huang, J. Mater. Chem. B, 2013, 1, 5003 RSC.
- Z. Hu, Y. D. Huang, C. H. Zhang, L. Liu, J. Li and Y. F. Wang, J. Mater. Chem. B, 2014, 2, 8587 RSC.
- Z. Hu, C. Wang, F. Zhao, X. R. Xu, S. H. Wang, L. Yu and D. Y. Zhang, Nanoscale, 2017, 9, 8825 RSC.
- Z. Hu, F. Zhao, Y. F. Wang, Y. D. Huang, L. Chen, N. Li, J. Li, Z. H. Li and G. X. Yi, Chem. Commun., 2014, 50, 10851 Search PubMed.
- Z. Hu, J. Li, Y. D. Huang, L. Chen and Z. H. Li, RSC Adv., 2015, 5, 654 RSC.
- Z. Wang, Z. Li, C. Zhang, G. Shen and P. Huang, Adv. Mater., 2012, 24, 5104 CrossRef PubMed.
- Z. M. Markovic, B. Z. Ristic, K. M. Arsikin, D. G. Klisic, L. M. H. Trajkovic and Z. Markovic, Biomaterials, 2012, 33, 7084 CrossRef CAS PubMed.
- Q. Lu, Y. J. Zhang and S. Q. Liu, J. Mater. Chem. A, 2015, 3, 8552 CAS.
- Y. F. Xu, Z. B. Liu, X. L. Zhang, Y. Wang, J. G. Tian, Y. Huang, Y. F. Ma, X. Y. Zhang and Y. S. Chen, Adv. Mater., 2009, 21, 1275 CrossRef CAS.
- R. Yamuna, S. Ramakrishnan, K. Dhara, R. Devi, N. K. Kothurkar, E. Kirubha and P. K. Palanisamy, J. Nanopart. Res., 2013, 15, 1399 CrossRef.
- F. Jia, L. Wu, J. Meng, M. Yang, H. Kong, T. J. Liu and H. Y. Xu, J. Mater. Chem., 2009, 19, 8950 RSC.
- R. Xavier, J. B. Ana, S. G. David, B. Xavier and N. Santi, Chem. Commun., 2009, 2920 Search PubMed.
- H. Y. Lin, Y. Shen, D. F. Chen, L. S. L. B. C. Wilson, B. H. Li and S. S. Xie, J. Fluoresc., 2013, 23, 41 CrossRef CAS PubMed.
Footnote |
| † Electronic supplementary information (ESI) available. See DOI: 10.1039/c7ra08308d |
| This journal is © The Royal Society of Chemistry 2017 |