DOI:
10.1039/C7RA08170G
(Paper)
RSC Adv., 2017,
7, 43014-43029
Inhibition of mild steel corrosion in hydrochloric acid using two novel pyridine Schiff base derivatives: a comparative study of experimental and theoretical results
Received
24th July 2017
, Accepted 23rd August 2017
First published on 5th September 2017
Abstract
Two novel pyridine Schiff base derivatives, namely 3-pyridinecarboxaldehyde-4-phenyl thiosemicarbazide (3-PCPTC) and 4-pyridinecarboxaldehyde-4-phenylthiosemicarbazide (4-PCPTC), were synthesized and their corrosion inhibition properties on mild steel in 1.0 M HCl were studied through experimental and theoretical measurements. Weight loss, electrochemical impedance spectroscopy and potentiodynamic polarization results indicate that both compounds exhibit a good inhibition effect and that 3-PCPTC shows better inhibition efficiency than 4-PCPTC. Meanwhile, the adsorption process obeys the Langmuir adsorption isotherm model, and thermodynamic parameters were calculated and discussed. Scanning electron microscopy and X-ray photoelectron spectroscopy analyses confirm the adsorption and protective abilities of the two studied inhibitors on mild steel in HCl. UV-vis spectroscopic studies show that the corrosion inhibitors interact with mild steel in HCl solution to form Fe-inhibitor complexes. Furthermore, quantum chemical calculations and molecular dynamics simulations were performed. According to the experimental and theoretical results, the inhibition mechanism was deduced.
1. Introduction
Acidic solutions are widely used in cleaning, descaling, pickling and other engineering applications to remove scale and rust from metal surfaces.1–3 However, excessive acid accelerates the rate of metal dissolution and results in acid loss.4,5 According to the requirements of the Cleaner Production Promotion Law of the People's Republic of China promulgated in 2002, industrial pollution control in acid wash processes should focus on source control and reducing the acid dosage from the source. A useful and easy method to mitigate metal corrosion and reduce acid dosage is the addition of suitable corrosion inhibitors.6–8 Generally, organic compounds containing oxygen, nitrogen or sulfur heteroatoms, particularly in the form of aromatic rings (pyridine, benzene, thiazole, etc.) and π-conjugated systems, can exhibit excellent inhibition efficiency.9–12
A survey of the literature revealed that Schiff base compounds, containing the –C![[double bond, length as m-dash]](https://www.rsc.org/images/entities/char_e001.gif) N– group, are an effective type of corrosion inhibitors for metals in acidic media.13–17 Due to the planar structure, the lone pair of electrons on the nitrogen atom and the π-bond, Schiff base inhibitors can easily adsorb onto metal surfaces to form coordinate-covalent bonds with metals. It should be noted that Schiff base compounds, formed from the condensation of amine and aldehyde, can be conveniently synthesized from relatively cheap commercially available chemicals.1 Furthermore, as conventional organic corrosion inhibitors, pyridine and its derivatives have attracted much attention for their inhibition properties in recent years.18–22 However, the most studied pyridine derivatives contain only one pyridine ring, and investigations involving compounds with two or more aromatic rings are rare.23–25 As is well known, the inhibition potential is influenced by many factors, such as electronic structure, steric hindrance effects and aromaticity.26,27 Hence, it is difficult to predict the corrosion inhibition ability of a novel organic compound with a Schiff base group and more than one aromatic ring. In the present work, two novel pyridine Schiff base derivatives, 3-pyridinecarboxaldehyde-4-phenylthiosemicarbazide (3-PCPTC) and 4-pyridinecarboxaldehyde-4-phenyl thiosemicarbazide (4-PCPTC), containing a Schiff base moiety, one pyridine ring and another benzene ring, were investigated.
N– group, are an effective type of corrosion inhibitors for metals in acidic media.13–17 Due to the planar structure, the lone pair of electrons on the nitrogen atom and the π-bond, Schiff base inhibitors can easily adsorb onto metal surfaces to form coordinate-covalent bonds with metals. It should be noted that Schiff base compounds, formed from the condensation of amine and aldehyde, can be conveniently synthesized from relatively cheap commercially available chemicals.1 Furthermore, as conventional organic corrosion inhibitors, pyridine and its derivatives have attracted much attention for their inhibition properties in recent years.18–22 However, the most studied pyridine derivatives contain only one pyridine ring, and investigations involving compounds with two or more aromatic rings are rare.23–25 As is well known, the inhibition potential is influenced by many factors, such as electronic structure, steric hindrance effects and aromaticity.26,27 Hence, it is difficult to predict the corrosion inhibition ability of a novel organic compound with a Schiff base group and more than one aromatic ring. In the present work, two novel pyridine Schiff base derivatives, 3-pyridinecarboxaldehyde-4-phenylthiosemicarbazide (3-PCPTC) and 4-pyridinecarboxaldehyde-4-phenyl thiosemicarbazide (4-PCPTC), containing a Schiff base moiety, one pyridine ring and another benzene ring, were investigated.
In recent decades, quantum chemical methods have proven to be useful computational approaches in investigating the molecular structure and elucidating the reactivity and electronic structure of inhibitors.23–25 Reviews on density functional theory (DFT) as a powerful tool in the design of corrosion inhibitors have been published by I. B. Obot, C. D. Taylor and G. Gece.28–30 In DFT studies, certain parameters, which can influence the electronic interaction between inhibitor molecules and metal surface atoms, have received extensive attention, such as the energy of the lowest unoccupied molecular orbital (ELUMO), energy of highest occupied molecular orbital (EHOMO), dipole moment (μ), chemical softness, hardness, molecular volume (MV) and so on. Meanwhile, molecular dynamics (MD) simulation, as an effective tool, can provide insights into the design of systems involving a relatively large number of molecules, allowing researchers to study adsorption processes at the molecular level.19–21
Our present study was aimed at examining the corrosion inhibition capability of 3-PCPTC and 4-PCPTC for mild steel in 1.0 M HCl solution, utilizing weight loss experiments, electrochemical observations and theoretical calculations. Then, scanning electron microscopy (SEM) and X-ray photoelectron spectroscopy (XPS) analyses were carried out. Ultraviolet-visible (UV-vis) spectroscopic studies were conducted to confirm the interaction between the metal and inhibitor. Finally, an attempt was made to deduce the inhibition mechanism.
2. Experimental
2.1 Synthesis of inhibitors
The two novel pyridine Schiff base corrosion inhibitors (shown in Fig. 1), namely 3-PCPTC and 4-PCPTC, were synthesized in the laboratory according to the published method.31 All the chemicals used in our research were of analytical grade and were used without any purification. 3-Pyridine formaldehyde (3 mmol) or 4-pyridine formaldehyde (3 mmol) was dissolved in ethanol (10 mL), and the solution was then added dropwise into a mixed aqueous solution of thiosemicarbazide (3 mmol) and acetic acid (catalytic, a few drops). The mixed solution was heated to 373.15 K and was refluxed for 3 hours with continuous stirring. After cooling to room temperature, the obtained precipitate was filtered and recrystallized using ethanol. The molecular structures of the two compounds were characterized using 1H NMR and FTIR spectroscopy. For 3-PCPTC: 1H NMR (DMSO-d6, 500 M Hz): δ 11.95 (s, 1H, NH), 10.20 (s, 1H, NH), 9.03 (s, 1H, ArH), 8.59–8.58 (d, 1H, ArH), 8.39–8.36 (d, 1H, ArH), 8.19 (s, 1H, CH), 7.58–7.56 (d, 2H, ArH), 7.47–7.36 (m, 3H, ArH), 7.24–7.19 (m, 1H, ArH). FTIR (KBr) ν: 3435, 3307, 3130, 1594, 1553, 1198, 1085, 913, 693 cm−1. For 4-PCPTC: 1H NMR (DMSO-d6, 500 MHz): δ 12.06 (s, 1H, NH), 10.27 (s, 1H, NH), 8.63–8.62 (d, 2H, ArH), 8.12 (s, 1H, CH), 7.89–7.88 (d, 2H, ArH), 7.57–7.54 (d, 2H, ArH), 7.41–7.37 (m, 2H, ArH), 7.26–7.21 (m, 1H, ArH). FTIR (KBr) ν: 3434, 3313, 3132, 1595, 1530, 1190, 1103, 911, 691 cm−1. The peaks at 1594 cm−1 (3-PCPTC) and 1595 cm−1 (4-PCPTC), correspond to the Schiff base group, confirming the formation of the two novel pyridine Schiff base compounds.
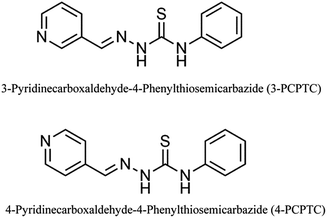 |
| | Fig. 1 Molecular structures of the studied compounds. | |
2.2 Material
In this work, an aggressive solution, 1.0 M HCl, was prepared using analytical grade 37% HCl and double distilled water. The concentration of the two novel pyridine Schiff base inhibitors ranged from 0.10 mM to 1.0 mM, and a solution without inhibitors was prepared for comparison. For weight loss and electrochemical tests, mild steel sheets containing 0.17 wt% C, 0.20 wt% Si, 0.37 wt% Mn, 0.03 wt% S, 0.01 wt% P, and balance iron were used. Rectangular coupons with dimensions of 5.0 cm × 2.5 cm × 0.2 cm were used for the weight loss tests. A columned steel coupon, embedded in epoxy resin with an exposed area of 0.785 cm2 to the electrolyte, was used as the working electrode for the electrochemical measurements.
2.3 Weight loss experiments
Weight loss experiments were performed according to the ASTM G31-72 standard procedure.32 The coupons were immersed in 1.0 M HCl solution with and without different concentrations of inhibitor for 8 h at 30, 35, 40 and 50 °C without stirring. After that, the coupons were taken out, carefully washed in double distilled water and ethanol, and then dried at room temperature after the corrosion tests. The loss in weight was determined using an analytical balance and triplicate parallel experiments were performed. Furthermore, the mean value was used in calculations.
2.4 Electrochemical measurements
The electrochemical measurements were performed with a Gamry Reference 3000 electrochemical workstation. A standard three-electrode cell system was utilized, consisting of a platinum electrode as the counter electrode (CE) and a saturated calomel electrode (SCE) coupled to a fine Luggin capillary as the reference electrode. All potential values in this paper refer to the SCE. The Luggin capillary was kept close to the working electrode (WE) in order to reduce the ohmic contribution in the electrochemical measurements. Prior to each electrochemical measurement, the WE surface was abraded with different emery papers (500, 1000, 1500 and 2000 grade), washed with ethanol and finally dried at room temperature. All electrochemical tests were performed in naturally aerated hydrochloric acid solution under non-stirring conditions, and the temperature was maintained using a thermostatic water bath. For the purpose of reaching a steady open circuit potential, the WE was immersed in the corrosive solution for 0.5 h before each electrochemical test. This period is considered sufficient for open circuit potential stabilization for an electrochemical system.33–35 The polarization curves were recorded from −750 mV to −250 mV (versus SCE) at a constant sweep rate of 1.0 mV s−1. The electrochemical impedance spectroscopy (EIS) measurements were performed over the frequency range of 100 mHz to 100 kHz with a sinusoidal alternating current (AC) signal of 5 mV (peak to peak) at the open circuit potential. In order to achieve good reproducibility, each electrochemical measurement was performed in triplicate, and the mean values of the experiments are reported in this manuscript.
2.5 Scanning electron microscopy (SEM) studies
To observe the effects of 3-PCPTC or 4-PCPTC on the surface morphology of the corroded mild steel coupons, SEM investigations were conducted using a Quanta 200 scanning electronic microscope under high vacuum and at 20.0 kV EHT. Before the SEM analysis, the coupons were first immersed in 1.0 M HCl with and without 3-PCPTC or 4-PCPTC for 8 h at 30 °C. Thereafter, the coupons were taken out of the test solutions, cleaned with double distilled water and ethanol, dried with cool air and analyzed using SEM.
2.6 X-ray photoelectron spectroscopy (XPS) studies
XPS experiments were carried out on an ESCALAB™ 250Xi spectrometer (Thermo Scientific™) with monochromatized Al Kα X-ray radiation (hv = 1486.4 eV) and an X-ray beam of around 100 mm. The mild steel coupons were pre-treated using the same procedure described before and were immersed in 1.0 M HCl with 3-PCPTC or 4-PCPTC for 8 h at 30 °C. Afterwards, XPS peak software was employed to fit the experimental data.
2.7 UV-vis spectroscopic studies
Information about the formation of inhibitor-metal complexes on the metal surface in corrosion inhibition studies can be obtained using UV-vis spectroscopy.36,37 In order to confirm the possible formation of Fe-inhibitor complexes, UV-vis absorption spectra of 1.0 M HCl with 3-PTPTC or 4-PTPTC were investigated before and after 8 h of mild steel immersion.
2.8 Computational details
2.8.1 Quantum chemical calculations. Quantum chemical calculations were carried out for both gas and aqueous phases using DFT methods, employing the popular Becke's three-parameter hybrid functional (B3LYP) level of theory with the 6-31 G basis set by the Gaussian 03 series of programs. The relevant quantum chemical parameters were calculated and considered.
2.8.2 Molecular dynamics (MD) simulations. The interaction between the inhibitor and iron surface was elucidated using MD simulations with the software Material Studio, Forcite module. The Fe (110) plane, which is a densely-packed surface and has the highest stability compared with other Fe surfaces, was chosen to simulate the adsorption process. The MD simulations were carried out in a three-dimensional simulation box with periodic boundary conditions to model a representative part of the interface devoid of any arbitrary boundary effects. For the case of the gas phase, a vacuum slab with 30 Å thickness was built above the Fe (110) plane, and the inhibitor moved to the interface freely. For the case of aqueous solution, a single inhibitor along with 250 water molecules was built using the amorphous cell module, and the whole system was allowed to freely interact with the Fe plane. The COMPASS force field was used to optimize the structures of all components of the system. Then, the MD simulations were performed at 303 K under NVT ensemble with a time step of 0.1 fs and simulation time of 50 ps. The dynamic process was performed until the entire system reached equilibrium, when both the temperature and the energy of the system became balanced. The interaction energy (Eint) between Fe and the inhibitor molecules in a vacuum was calculated as follows:24,25| | |
Eint = Etotal − (Esurf + Einh)
| (1) |
where Etotal is the total energy of the iron surface with adsorbed inhibitor molecules, Esurf and Einh are the energy of the iron surface and that of the free corrosion inhibitor molecule, respectively. In addition, in aqueous solution, the Eint between Fe and the inhibitor molecules was calculated according to the following equation:| | |
Eint = Etotal − (Esurf+sol + Einh+sol − Esol)
| (2) |
where Etotal is the total energy of the simulation system, Esurf+sol and Einh+sol are the total energy of the system containing only the iron surface with water molecules and that containing only the inhibitor with water molecules, respectively. Esol is the interaction energy of the water molecules.
3. Results and discussion
3.1 Weight loss measurements
3.1.1 Effect of concentration. The corrosion inhibition efficiency (η) and corrosion rate (ν) obtained from the weight loss experiments with and without different concentrations of 3-PCPTC and 4-PCPTC for mild steel in 1.0 M HCl are presented in Tables 1 and 2. The corrosion inhibition efficiency was determined by the following equation at different temperatures:| |
 | (3) |
where ν0 and ν are the corrosion rates without and with inhibitors, respectively. According to ASTM G31-72 standard, the corrosion rate was determined using eqn (4).| |
ν = 87![[thin space (1/6-em)]](https://www.rsc.org/images/entities/char_2009.gif) 600W/STD 600W/STD
| (4) |
where W is the coupon weight loss in g, S is the surface area in cm2, T is the immersion time in h, and D is the density of mild steel in g cm−3 (7.86 ± 0.1).
Table 1 Weight loss results of mild steel in 1.0 M HCl with different concentrations of 3-PTPTC at different temperatures
| Temp. (°C) |
C (mM) |
ν (mm y−1) |
η (%) |
| 30 |
Blank |
8.192 ± 0.167 |
— |
| 0.10 |
0.513 ± 0.033 |
94 |
| 0.25 |
0.435 ± 0.011 |
95 |
| 0.50 |
0.424 ± 0.011 |
95 |
| 1.00 |
0.334 ± 0.022 |
96 |
| 35 |
Blank |
11.814 ± 0.145 |
— |
| 0.10 |
0.992 ± 0.045 |
92 |
| 0.25 |
0.602 ± 0.011 |
95 |
| 0.50 |
0.524 ± 0.056 |
95 |
| 1.00 |
0.424 ± 0.022 |
96 |
| 40 |
Blank |
15.937 ± 0.067 |
— |
| 0.10 |
1.772 ± 0.033 |
89 |
| 0.25 |
0.769 ± 0.011 |
95 |
| 0.50 |
0.702 ± 0.067 |
95 |
| 1.00 |
0.546 ± 0.033 |
96 |
| 50 |
Blank |
31.462 ± 0.033 |
— |
| 0.10 |
4.179 ± 0.301 |
87 |
| 0.25 |
1.794 ± 0.033 |
94 |
| 0.50 |
1.159 ± 0.045 |
96 |
| 1.00 |
0.858 ± 0.067 |
97 |
Table 2 Weight loss results of mild steel in 1.0 M HCl with different concentrations of 4-PTPTC at different temperatures
| Temp. (°C) |
C (mM) |
ν (mm y−1) |
η (%) |
| 30 |
Blank |
8.192 ± 0.167 |
— |
| 0.10 |
0.691 ± 0.011 |
91 |
| 0.25 |
0.535 ± 0.022 |
93 |
| 0.50 |
0.524 ± 0.011 |
94 |
| 1.00 |
0.568 ± 0.022 |
93 |
| 35 |
Blank |
11.814 ± 0.145 |
— |
| 0.10 |
0.958 ± 0.011 |
92 |
| 0.25 |
0.747 ± 0.011 |
94 |
| 0.50 |
0.713 ± 0.056 |
94 |
| 1.00 |
0.758 ± 0.011 |
94 |
| 40 |
Blank |
15.937 ± 0.067 |
— |
| 0.10 |
1.772 ± 0.067 |
89 |
| 0.25 |
0.970 ± 0.011 |
94 |
| 0.50 |
0.936 ± 0.011 |
94 |
| 1.00 |
0.958 ± 0.022 |
94 |
| 50 |
Blank |
31.462 ± 0.033 |
— |
| 0.10 |
2.441 ± 0.033 |
92 |
| 0.25 |
1.794 ± 0.045 |
94 |
| 0.50 |
1.638 ± 0.067 |
95 |
| 1.00 |
1.604 ± 0.033 |
95 |
From Tables 1 and 2, it is clear that the corrosion rate of mild steel decreased dramatically and the corrosion inhibition efficiency increased with the increase in inhibitor concentration of 3-PCPTC and 4-PCPTC. The increase in efficiency can be ascribed to the increase in surface coverage due to the adsorption of the inhibitors on the mild steel surface.27 Then, the adsorption film may block the active sites and isolate the metal surface from the aggressive solution. The corrosion inhibition efficiency of the two compounds was found to follow the order: 3-PCPTC > 4-PCPTC. Compared with the earlier studied Schiff base corrosion inhibitors in Table 3, 3-PCPTC and 4-PCPTC exhibited better corrosion inhibition behavior. This phenomenon is related to the steric hindrance effect and the number of heteroatoms in the structure.
Table 3 Comparison of the inhibition efficiency of 3-PCPTC and 4-PCPTC with the literature data as corrosion inhibitors for mild steel in HCl solution
| Inhibitor |
Cinh (mM) |
η (%) |
Ref. |
| 3-PCPTC |
1.0 |
96 |
This paper |
| 4-PCPTC |
1.0 |
93 |
This paper |
| 4-(((4-(Bis(pyridin-2-ylmethyl)-amino)-phenyl)-imino)-methyl)-N,N-diethylaniline |
1.0 |
91.9 |
25 |
| 2-Amino-6-(2-hydroxybenzelideneamino)-hexanoic acid |
≈1.0 |
89.1 |
38 |
| 2-Amino-6-(4-methoxybenzelideneamino)-hexanoic acid |
≈1.0 |
90.4 |
38 |
| 2-Amino-6-((4-dimethylamino)benzylideneamino)-hexanoic acid |
≈1.0 |
92.1 |
38 |
| 4-(N,N-Dimethylamino)-benzaldehyde nicotinic acid hydrazone |
1.0 |
88.25 |
39 |
| 3-(5-Methoxy-2-hydroxybenzylideneamino)-2(5-methoxy-2-hydroxyphenyl)-2,3-dihydroquinazoline-4(1H)-one |
1.0 |
92 |
40 |
| 3-(5-Nitro-2-hydroxybenzylideneamino)-2(5-nitro-2-hydroxyphenyl)-2,3-dihydroquinazoline-4(1H)-one |
1.0 |
88 |
40 |
| (E)-4-((Naphthalen-2-ylimino)-methyl)-phenol |
≈1.0 |
90 |
41 |
| 4-(((4-Ethylphenyl)-imino)-methyl)-phenol |
≈1.0 |
90 |
41 |
| N,N′-Bis(4-formylphenol)-1,2-diaminocyclohexane |
1.0 |
57 |
42 |
| 2-((Thiazole-2-ylimino)-methyl)-phenol |
1.0 |
88 |
43 |
| (3-Bromo-4-fluoro-benzylidene)-[1,2,4]triazol-4-yl-amine |
1.6 |
81.2 |
44 |
| 4-Trifluoromethyl-benzylidene-[1,2,4]triazol-4-yl-amine |
1.6 |
78.9 |
44 |
| (2-Fluoro-4-nitro-benzylidene)-[1,2,4]triazol-4-yl-amine |
1.6 |
75.2 |
44 |
| 1-{(Z)-[(4,6-Dimethylpyridin-2-yl)imino]methyl}-naphthalen-2-ol |
1.0 |
91.6 |
45 |
3.1.2 Effect of temperature. In general, the effect of temperature on the inhibited acid–metal reaction was highly complex, because many changes occurred on the metal surface, such as rapid etching and desorption of inhibitors. Furthermore, the inhibitor itself may undergo decomposition, rearrangement, or some chemical changes to improve the adsorption efficiency.3,46,47 In order to investigate the effect of temperature on the inhibition efficiency of the two studied 3-PCPTC and 4-PCPTC inhibitors, weight loss experiments were performed at different temperatures (30–50 °C) as detailed in the obtained data in Tables 1 and 2. It is apparent that the rise in temperature accelerated the corrosion reaction, resulting in an increased corrosion rate. However, the inhibition efficiency was almost unchanged, which can be attributed to some chemical changes occurring in the 3-PCPTC or 4-PCPTC inhibitors. Meanwhile, it can be found that 3-PCPTC exhibited better inhibition behavior than 4-PCPTC at different temperatures.
3.1.3 Adsorption isotherm. The corrosion inhibition by organic inhibitors results from the adsorption of inhibitor molecules on the metal surface. In addition, the adsorption can be considered as a quasi-substitution process between organic inhibitors in the aqueous phase [Inh(sol)] and water molecules associated with the metal surface [H2O(ads)], as shown by the following reversible process:48,49| | |
Inh(sol) + xH2O(ads) ↔ Inh(ads) + xH2O(sol)
| (5) |
where x is the number of water molecules replaced by one organic inhibitor molecule. Therefore, studying the adsorption isotherms is crucial to understanding the inhibition mechanism. In order to evaluate the most suitable adsorption isotherm of 3-PCPTC and 4-PCPTC on a mild steel surface, many adsorption isotherms were employed to fit the experimental data, such as Langmuir, Temkin, and Freundlich adsorption isotherms. The surface coverage values (θ) corresponding to different concentrations of the inhibitor in 1.0 M HCl at different temperatures were used to determine the adsorption isotherms. They were obtained from weight loss measurements and calculated using the following expression:3,35| |
 | (6) |
where ν0 and ν are the corrosion rates without and with inhibitors, respectively. The plots of C/θ versus C yielded straight lines with slopes close to 1 and linear correlation coefficients also close to 1 (Fig. 2), proving that the adsorption of 3-PCPTC and 4-PCPTC on the mild steel surface was well fitted to the Langmuir adsorption isotherm:48–51| |
 | (7) |
where C is the inhibitor concentration, Kads is the adsorption equilibrium constant and θ is the surface coverage. The Kads value, determined from the intercepts of the straight lines, relates to the standard free energy of adsorption (ΔG0ads), according to the following relation:| |
 | (8) |
where R (J mol−1 K−1) is the universal gas constant, 55.5 (mol dm−3) is the molar concentration of water in solution and T (K) is the temperature. The values of Kads and ΔG0ads for 3-PCPTC and 4-PCPTC were calculated and are reported in Table 4. It is well established that a high value of Kads implies a strong adsorption of inhibitor molecules on a metal surface.26,39,49
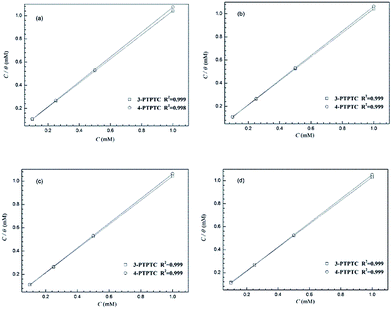 |
| | Fig. 2 Langmuir adsorption plots for mild steel in 1.0 M HCl with 3-PCPTC and 4-PCPTC at 30 °C (a), 35 °C (b), 40 °C (c) and 50 °C (d). | |
Table 4 Equilibrium constant and standard free energy of adsorption of mild steel in 1.0 M HCl with 3-PCPTC or 4-PCPTC at different temperatures
| Inhibitor |
Temp (°C) |
Kads × 105 M−1 |
ΔG0ads (kJ mol−1) |
| 3-PCPTC |
30 |
2.65 × 10⁵ |
−41.6 |
| 35 |
1.93 × 10⁵ |
−41.5 |
| 40 |
1.35 × 10⁵ |
−41.2 |
| 50 |
8.23 × 10⁴ |
−41.2 |
| 4-PCPTC |
30 |
4.51 × 10⁶ |
−48.7 |
| 35 |
7.09 × 10⁵ |
−44.8 |
| 40 |
2.75 × 10⁵ |
−43.1 |
| 50 |
2.96 × 10⁵ |
−44.6 |
The adsorption process was favorable and was accompanied by the displacement of water molecules from the metal surface. Meanwhile, the negative values of ΔG0ads suggest a spontaneous adsorption process. It can be inferred from the range of ΔG0ads values (<−40 kJ mol−1) that the 3-PCPTC and 4-PCPTC molecules on the metal surface at the four tested temperatures were adsorbed mainly via charge sharing (chemisorption).
3.1.4 Activation thermodynamic parameters. The Arrhenius formula and transition state equation were used to calculate activation parameters, such as the activation energy (Ea), enthalpy of activation (Ha) and the entropy of activation (Sa), of mild steel corrosion in the absence and presence of 1.0 mM 3-PCPTC and 4-PCPTC at different temperatures. The Arrhenius equation is given by:| |
 | (9) |
As seen from Table 5 and Fig. 3a, it is apparent that the corrosion rate was markedly enhanced with the increase in temperature. In addition, the data well fitted the Arrhenius plots in Fig. 3a with all regression coefficients close to 1. A close inspection of Table 5 shows that the values of Ea in the presence of 1.0 mM 3-PCPTC or 4-PCPTC are lower than that of the uninhibited solution. Because of the heterogeneity, the mild steel surface exhibited active centers with high energy and low energy, respectively. If the inhibitor molecule blocked an active center of low energy, the corrosion process would proceed at an active center of high energy, thus the value of Ea for the inhibited corrosion process was higher than that of the uninhibited one. The reverse also holds true.51–53 The changes in the enthalpy of activation (ΔHa) and the entropy of activation (ΔSa) for the corrosion process were calculated using the transition state equation:
| |
 | (10) |
where
h is the Planck constant and
NA is Avogadro's number. Plots of ln(
v T−1)
vs. T−1 in
Fig. 3b give straight lines with all the regression coefficients close to 1, indicating the good accuracy of fit. The values of Δ
Ha and Δ
Sa were obtained by calculating the slopes and intercepts of the curves and are also shown in
Table 5. Inspection of
Table 5 reveals that the values of Δ
Ha are all positive, which is related to the endothermic nature of the mild steel dissolution process. This phenomenon means that the higher temperature accelerated the corrosion of mild steel, which is proved by the data in
Tables 1 and
2. Furthermore, chloride ions played an active role in the process of iron corrosion, as follows:
| | |
Fe + Cl− ↔ (FeCl)ads + e−
| (11) |
| | |
(FeCl)ads ↔ (FeCl)+ + e−
| (12) |
| | |
(FeCl)+ ↔ Fe2+ + Cl−
| (13) |
Table 5 Thermodynamic data of mild steel corrosion in 1.0 M hydrochloric acid solution without and with 3-PCPTC and 4-PCPTC
| Inhibitor |
Ea (kJ mol−1) |
ΔHa (kJ mol−1) |
ΔSa (J mol−1 K−1) |
| Blank |
54.5 |
51.9 |
−76.7 |
| 3-PCPTC |
38.6 |
35.9 |
−155.8 |
| 4-PCPTC |
42.0 |
39.4 |
−140.0 |
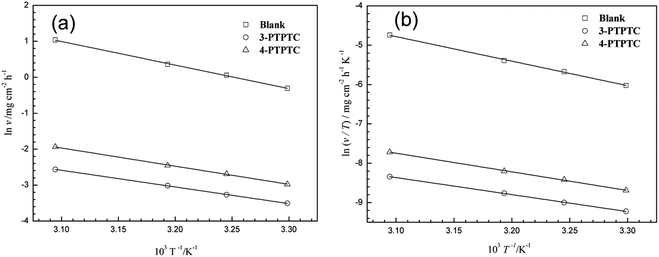 |
| | Fig. 3 Arrhenius plots (a) and transition state plots (b) for mild steel in 1.0 M HCl solution in the absence and presence of 3-PCPTC and 4-PCPTC. | |
(FeCl)ads and (FeCl)+ were all able to combine with inhibitors to form activated complexes.11,49 The change in ΔSa indicated a decrease in the degree of ordering in the system during the transformation from reactants to activated complexes.54,55
3.2 Potentiodynamic polarization measurements
Information about the kinetics of anodic and cathodic reactions can be obtained through potentiodynamic polarization experiments.1,56 Fig. 4 shows the polarization curves of mild steel in 1.0 M HCl with and without various concentrations of 3-PCPTC and 4-PCPTC at 30 °C. For 3-PCPTC and 4-PCPTC, the polarization curves show a prominent decrease in the corrosion rate, shifting both the anodic and cathodic Tafel curves to lower current density regions. This indicates that both anodic and cathodic reactions were suppressed, and the corrosion inhibition of these reactions was more pronounced with the increase in the concentration. Because the polarization experiments were performed in aerated acidic solution, the cathodic reactions include both oxygen reduction (i.e. 4H+ + O2 + 4e− → 2H2O) and hydrogen gas evolution (i.e. 2H+ + 2e− → H2). However, it has been reported that the effect of dissolved oxygen reduction on iron corrosion is only significant at pH values of more than 4.26,57 Therefore, in this study, the cathodic hydrogen evolution reaction was the key point. The suppression of the corrosion process is related to the covering of absorbed 3-PCPTC or 4-PCPTC inhibitor molecules on the mild steel surface. Meanwhile, the parallel cathodic Tafel curves indicate that the hydrogen evolution mechanism was not modified upon the addition of 3-PCPTC or 4-PCPTC and the reduction of hydrogen ions took place mainly through a charge transfer mechanism. The corresponding electrochemical parameters, such as corrosion potential (Ecorr), cathodic and anodic Tafel slope (bc and ba), corrosion current density (Icorr) and inhibition efficiency (η), are listed in Table 6. The corrosion inhibition efficiency was determined using the following equation:| |
 | (14) |
where I0corr and Icorr are the corrosion current densities of mild steel without and with inhibitors, respectively. The polarization curves exhibit some shifts in potential towards more anodic or cathodic regions relative to the blank acid. Furthermore, the variation in Ecorr is slight, with a maximum shift of about 20 mV (vs. SCE). This observation indicates that the two inhibitors are classified as mixed type inhibitors and the addition of the inhibitors weakly perturbs the electrode surface by geometric blocking of the active sites.58,59
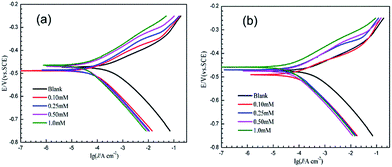 |
| | Fig. 4 Potentiodynamic polarization curves of mild steel in 1.0 M HCl with and without various concentrations of 3-PCPTC (a) and 4-PCPTC (b) at 30 °C. | |
Table 6 Potentiodynamic polarization parameters of mild steel in 1.0 M HCl with and without various concentrations of 3-PCPTC and 4-PCPTC at 30 °C
| Inhibitor |
Conc. (mM) |
Ecorr (mV vs. SCE) |
Icorr (mA cm−2) |
bc (mV dec−1) |
ba (mV dec−1) |
η% |
| Blank |
0.00 |
−467.0 ± 6.0 |
0.439 ± 0.037 |
130.3 ± 6.3 |
87.9 ± 4.9 |
|
| 3-PCPTC |
0.10 |
−488.0 ± 0.5 |
0.063 ± 0.003 |
93.5 ± 1.4 |
58.6 ± 0.8 |
86 |
| 0.25 |
−485.5 ± 0.5 |
0.057 ± 0.003 |
99.7 ± 9.1 |
64.0 ± 0.4 |
87 |
| 0.50 |
−470.5 ± 2.5 |
0.050 ± 0.006 |
137.7 ± 12.5 |
65.6 ± 0.9 |
89 |
| 1.00 |
−464.5 ± 0.5 |
0.044 ± 0.008 |
121.3 ± 3.4 |
66.0 ± 1.3 |
90 |
| 4-PCPTC |
0.10 |
−489.0 ± 2.0 |
0.070 ± 0.015 |
87.8 ± 3.9 |
55.3 ± 6.5 |
84 |
| 0.25 |
−476.5 ± 6.5 |
0.053 ± 0.001 |
77.6 ± 7.1 |
57.2 ± 2.0 |
88 |
| 0.50 |
−474.5 ± 0.5 |
0.049 ± 0.001 |
85.6 ± 1.6 |
60.7 ± 0.7 |
89 |
| 1.00 |
−460.5 ± 1.5 |
0.048 ± 0.004 |
116.3 ± 11.0 |
65.2 ± 2.0 |
89 |
Inspection of Table 6 reveals that the corrosion current density decreased sharply with the increase in the concentration, leading to the increase in the inhibition efficiency. This phenomenon was ascribed to the increase in the number of molecules adsorbed on the active sites on the mild steel surface, and consequently, an increase in surface coverage. η% reached a steady value when the concentration was 0.50 mM and further increases in the concentration did not show any significant effect on η%. From Table 6, it can be found that η% followed the order: 3-PCPTC > 4-PCPTC. However, the difference in η% between the two inhibitors was slight, which can be attributed to the similar structures of the two molecules.
3.3 Electrochemical impedance spectroscopy
Nyquist and Bode plots of mild steel in 1.0 M HCl with and without various concentrations of 3-PCPTC and 4-PCPTC at 30 °C are given in Fig. 5 and 6. From Fig. 5, it can be observed that the Nyquist plots in the presence of 3-PCPTC or 4-PCPTC are similar to the blank one, indicating that the inhibitors took control of the activation of the electrochemical reaction without changing the reaction mechanism to prevent the corrosion behavior of iron.23–25,60 Meanwhile, all impedance spectra display slightly depressed semicircles unlike perfect semicircles and the centers of them are under the real axis, indicating that a non-ideal electrochemical behavior occurred on the solid/liquid interface. This phenomenon is known as the “dispersing effect”, resulting from the roughness/in-homogeneity of the solid surfaces and adsorption of inhibitors.49,61 Furthermore, the diameters of the depressed capacitive loops in the inhibited solutions are bigger than that in the uninhibited solution and increase sharply as the concentration of the inhibitors rises. From the Bode and phase angle plots in Fig. 6, we found that only one time-constant exists for 3-PCPTC or 4-PCPTC, due to the fact that only one phase peak close to −90° at the middle frequency range can be observed. At low frequency, the increase in absolute impedance confirms the higher protection with increasing concentration of the two inhibitors, which was ascribed to the adsorption of the inhibitor molecules on the mild steel surface. Meanwhile, the more negative value of the phase angle indicates superior inhibitive behavior due to more inhibitor molecules adsorbed at higher concentration.
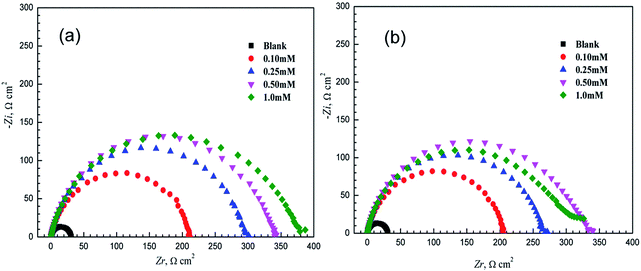 |
| | Fig. 5 Nyquist diagrams of mild steel in 1.0 M HCl with and without various concentrations of 3-PCPTC (a) and 4-PCPTC (b) at 30 °C. | |
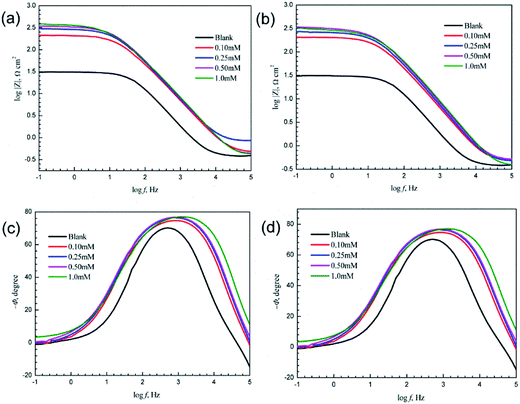 |
| | Fig. 6 Bode and phase angle diagrams of mild steel in 1.0 M HCl with and without various concentrations of 3-PCPTC (a and c) and 4-PCPTC (b and d) at 30 °C. | |
The impedance parameters were calculated by utilizing the application circuit model shown in Fig. 7, in which Rs represents the electrolyte resistance, Rp is the polarization resistance containing charge transfer resistance, diffuse layer resistance, accumulation resistance and film resistance, etc., and CPE represents the constant phase element to replace a double layer capacitance (Cdl) with a more accurate fit. The impedance of CPE was determined using the following equation:
where
Y is a proportionality factor,
ω is the angular frequency and
n, a deviation parameter, represents the phase shift. A value of
n = 0 represents pure resistance,
n = 1 means pure capacitance and
n = −1 represents pure inductance. The impedance parameters derived from the equivalent circuit are listed in
Table 7. The values of the double layer capacitance and corrosion inhibition efficiency were calculated using the following equations:
| |
 | (16) |
| |
 | (17) |
where

is the angular frequency at the maximum value of the imaginary part of the impedance spectrum.
Rp0 and
Rp represent the polarization resistance of mild steel without and with inhibitors, respectively. The representative simulations of both the Nyquist and Bode plots for 3-PCPTC and 4-PCPTC at 0.1 mM are given in
Fig. 8. As shown in
Table 7, the values of
Rp increase prominently with the increase in the inhibitor concentrations for both 3-PCPTC and 4-PCPTC, while the values of
Cdl decrease.
Cdl of electrochemical impedance is defined by the Helmholtz model:
| |
 | (18) |
where
d is the thickness of the protective layer,
A is the effective electrode surface area,
ε0 and
ε are the dielectric constants of a vacuum and the local environment, respectively. Hence, the decrease in
Cdl indicates a decrease in the local dielectric constant or an increase in the thickness of the electrical double layer.
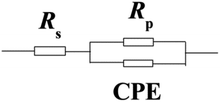 |
| | Fig. 7 Equivalent circuit model used to fit the EIS experiment data. | |
Table 7 Electrochemical impedance spectroscopy data of mild steel in 1.0 M HCl with and without various concentrations of 3-PCPTC and 4-PCPTC at 30 °C
| Inhibitor |
Conc. (mM) |
Rs (Ω cm2) |
Rp (Ω cm2) |
n |
Cdl (μF cm−2) |
η (%) |
| Blank |
0.00 |
0.52 ± 0.04 |
30.8 ± 0.08 |
0.91 ± 0.003 |
117.6 ± 0.05 |
|
| 3-PCPTC |
0.10 |
0.53 ± 0.07 |
206.3 ± 1.81 |
0.87 ± 0.002 |
39.1 ± 1.34 |
85 |
| 0.25 |
0.69 ± 0.13 |
295.0 ± 3.18 |
0.88 ± 0.002 |
37.5 ± 0.82 |
90 |
| 0.50 |
0.57 ± 0.16 |
336.2 ± 4.71 |
0.88 ± 0.005 |
34.2 ± 0.97 |
91 |
| 1.0 |
0.48 ± 0.02 |
381.8 ± 6.62 |
0.87 ± 0.001 |
36.3 ± 0.09 |
92 |
| 4-PCPTC |
0.10 |
0.43 ± 0.04 |
195.9 ± 5.94 |
0.89 ± 0.009 |
42.3 ± 3.19 |
84 |
| 0.25 |
0.45 ± 0.02 |
257.6 ± 7.40 |
0.90 ± 0.003 |
34.5 ± 0.64 |
88 |
| 0.50 |
0.40 ± 0.08 |
315.7 ± 0.16 |
0.90 ± 0.005 |
30.7 ± 0.52 |
90 |
| 1.0 |
0.35 ± 0.01 |
287.7 ± 6.20 |
0.89 ± 0.003 |
30.5 ± 0.83 |
89 |
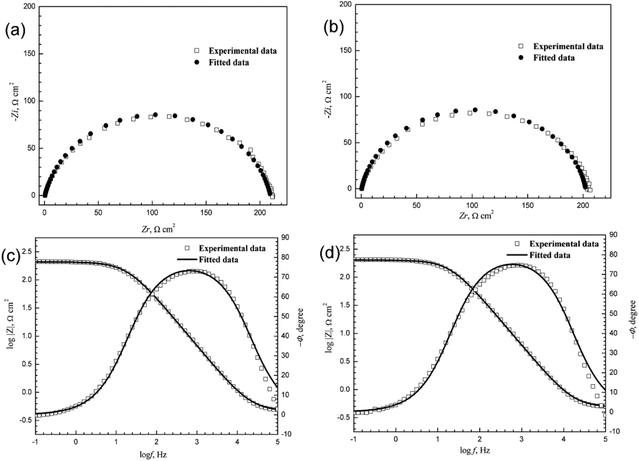 |
| | Fig. 8 The representative simulations of Nyquist and Bode diagrams for 3-PCPTC (a and c) and 4-PCPTC (b and d) at 0.10 mM. | |
According to the results, we can infer that the addition of 3-PCPTC or 4-PCPTC became adsorbed on the electrode surface by replacing the water molecules. In addition, we found that the value of n, indicative of the degree of heterogeneity, was slightly lower for the inhibited 3-PCPTC or 4-PCPTC system compared with the blank system, indicating that the steel surface was relatively more heterogeneous. This is due to the non-uniform adsorption of the inhibitors onto the metal surface.26 At the same concentration of the inhibitors, the values of Rp follow the order of 3-PCPTC > 4-PCPTC, leading to the inhibition efficiency order of: 3-PCPTC > 4-PCPTC, and the maximum η% reaches up to 92% and 90% for 3-PCPTC and 4-PCPTC, respectively. These results confirm that both 3-PCPTC and 4-PCPTC show good inhibition properties for mild steel in hydrochloric acid solution. Moreover, the corrosion inhibition efficiency calculated from electrochemical impedance spectroscopy measurements display a similar trend to that calculated from the weight loss measurements and potentiodynamic polarization measurements.
3.4 Surface analysis
SEM images of mild steel specimens immersed in 1.0 M HCl for 8 h in the absence and presence of 3-PCPTC or 4-PCPTC are shown in Fig. 9. It can be clearly observed from Fig. 9a that the mild steel surface processed without the inhibitors is severely corroded and a number of pits are distributed over the metal surface. In sharp contrast, in Fig. 9b and c the damage on the mild steel surface is apparently reduced and the surface is smoother and contains fewer pits. This observation demonstrates the good protective potential of 3-PCPTC and 4-PCPTC to behave as good inhibitors for mild steel in acidic media. Furthermore, a close examination of Fig. 9b and c reveals that the specimen immersed in the acidic medium containing 3-PCPTC is in better condition than that of 4-PCPTC.
 |
| | Fig. 9 SEM images of mild steel samples after immersion in 1.0 M HCl for 8 h at 30 °C (a) without inhibitors, (b) with 1.0 mM 3-PCPTC, and (c) with 1.0 mM 4-PCPTC. | |
XPS is a powerful tool for probing the adsorption of inhibitors on metal surfaces.62,63 Thus, we carried out XPS tests on the mild steel immersed in 1.0 M HCl with 3-PCPTC or 4-PCPTC. High resolution XPS spectra are illustrated in Fig. 10. The C1s spectra in Fig. 10a and b were fitted to three binding energy peaks. The peak at 284.7 eV was attributed to the C–C, C![[double bond, length as m-dash]](https://www.rsc.org/images/entities/char_e001.gif) C and C–H aromatic bonds in benzene or pyridine. The peak at 285.2 eV was ascribed to C–N or C
C and C–H aromatic bonds in benzene or pyridine. The peak at 285.2 eV was ascribed to C–N or C![[double bond, length as m-dash]](https://www.rsc.org/images/entities/char_e001.gif) N bonds in the molecule. The peak at around 288.2 eV was assigned to the carbon atom bonded to sulfur in the C
N bonds in the molecule. The peak at around 288.2 eV was assigned to the carbon atom bonded to sulfur in the C![[double bond, length as m-dash]](https://www.rsc.org/images/entities/char_e001.gif) S structure. The deconvoluted O1s spectra were fitted into two main peaks (Fig. 10c and d). The first peak (530.0 eV) was assigned to O2−, and was mainly associated with ferric oxides Fe2O3/Fe3O4. The second peak (531.6 eV) was ascribed to OH− of hydrous iron oxides FeOOH/Fe(OH)3. This was possibly due to the fact that a small amount of water molecules was present on the surface of mild steel when the sample was immersed in the solution. The deconvoluted N1s spectra (Fig. 10e and f) show two peaks. The peak located at around 399.3 eV was assigned to the molecular structure of nitrogen (
S structure. The deconvoluted O1s spectra were fitted into two main peaks (Fig. 10c and d). The first peak (530.0 eV) was assigned to O2−, and was mainly associated with ferric oxides Fe2O3/Fe3O4. The second peak (531.6 eV) was ascribed to OH− of hydrous iron oxides FeOOH/Fe(OH)3. This was possibly due to the fact that a small amount of water molecules was present on the surface of mild steel when the sample was immersed in the solution. The deconvoluted N1s spectra (Fig. 10e and f) show two peaks. The peak located at around 399.3 eV was assigned to the molecular structure of nitrogen (![[double bond, length as m-dash]](https://www.rsc.org/images/entities/char_e001.gif) N–, –NH–) and the other peak at around 400.1 eV was assigned to coordination bonds (N–Fe) between the lone pair of electrons on nitrogen atoms and Fe. From the above observations, the XPS results confirmed the adsorption of 3-PCPTC or 4-PCPTC on the mild steel surface.
N–, –NH–) and the other peak at around 400.1 eV was assigned to coordination bonds (N–Fe) between the lone pair of electrons on nitrogen atoms and Fe. From the above observations, the XPS results confirmed the adsorption of 3-PCPTC or 4-PCPTC on the mild steel surface.
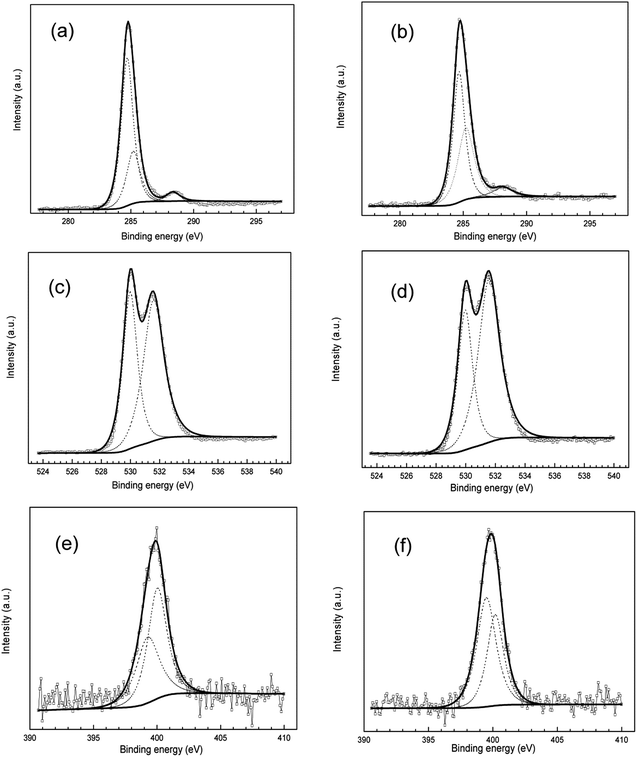 |
| | Fig. 10 High resolution XPS of C1s (a, b), O1s (c, d) and N1s (e, f) for mild steel after being immersed in 1.0 M HCl with 3-PCPTC (a, c, e) or 4-PCPTC (b, d, f). | |
3.5 UV-vis spectroscopic analysis
UV-vis spectroscopic measurements were carried out in the solutions containing 3-PCPTC or 4-PCPTC before and after mild steel immersion for 8 h and the spectra are presented in Fig. 11. It is clear that there are three absorption bands at 205 nm, 253–258 nm and 340–350 nm in the UV-vis spectra of 3-PCPTC or 4-PCPTC before mild steel immersion, which are due to the n → π* transition, π → π* transition and intramolecular charge transfers, respectively.26 The major differences in the UV-vis spectra of the solutions with 3-PCPTC and 4-PCPTC after mild steel immersion are that the absorbance is increased, the band at 205 nm is red-shifted to 209 nm and the band at 340–350 nm has disappeared. In addition, for 3-PCPTC, the band at 258 nm is blue-shifted to 253 nm after mild steel immersion. The changes in the UV-vis spectral features were attributed to the interactions between Fe and the inhibitors, resulting in the possible formation of Fe-PCPTC complexes.
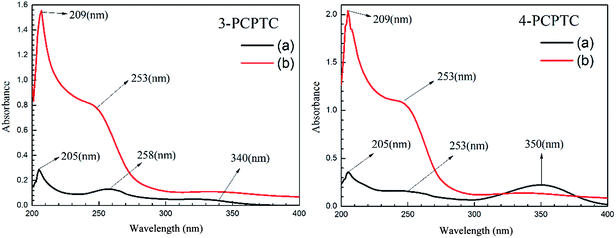 |
| | Fig. 11 UV-vis spectra of HCl solution with studied inhibitors (a) before, and (b) after mild steel immersion. | |
3.6 Quantum chemical calculations
The corrosion inhibition effectiveness is influenced by the structural and electronic properties of the material. In the acidic medium, the two studied inhibitors may exist in their protonated forms (3-PCPTCH and 4-PCPTCH) in equilibrium with the corresponding non-protonated molecular form (3-PCPTC and 4-PCPTC). In this regard, the Frontier molecular orbital (FMO) density distributions of protonated and non-protonated 3-PCPTC and 4-PCPTC were investigated in both gas phase and aqueous phase, as shown in Fig. 12 and 13. All the quantum chemical parameters are listed in Tables 8 and 9.
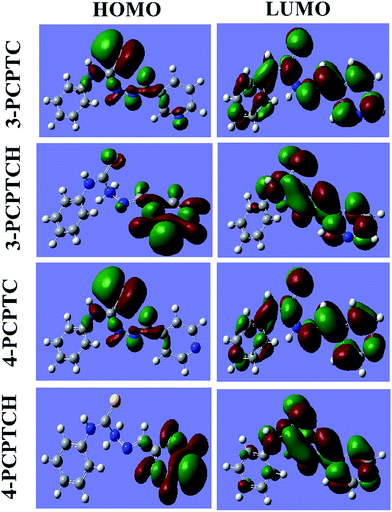 |
| | Fig. 12 FMO density distribution of the protonated and non-protonated inhibitors in gas phase. | |
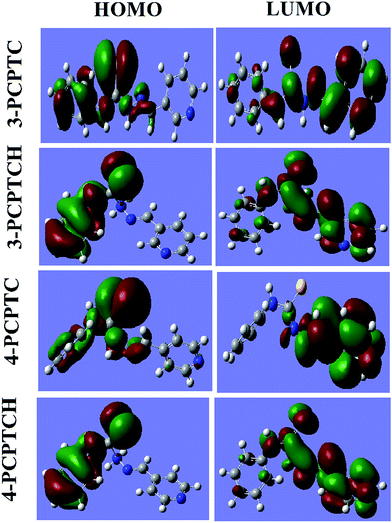 |
| | Fig. 13 FMO density distribution of the protonated and non-protonated inhibitors in aqueous phase. | |
Table 8 Quantum chemical parameters for protonated and non-protonated inhibitors in gas phase
| Inhibitor |
EHOMO (eV) |
ELUMO (eV) |
μ (D) |
ΔN110 (e) |
| 3-PCPTC |
−5.86 |
−1.72 |
3.63 |
0.25 |
| 3-PCPTCH |
−10.13 |
−5.94 |
4.08 |
−0.77 |
| 4-PCPTC |
−5.96 |
−1.89 |
6.04 |
0.22 |
| 4-PCPTCH |
−10.01 |
−6.16 |
6.04 |
−0.85 |
Table 9 Quantum chemical parameters for protonated and non-protonated inhibitors in aqueous phase
| Inhibitor |
EHOMO (eV) |
ELUMO (eV) |
μ (D) |
ΔN110 (e) |
| 3-PCPTC |
−5.86 |
−1.79 |
8.07 |
0.25 |
| 3-PCPTCH |
−6.92 |
−2.60 |
7.99 |
0.01 |
| 4-PCPTC |
−9.13 |
1.88 |
10.13 |
0.11 |
| 4-PCPTCH |
−6.91 |
−2.76 |
8.98 |
−0.01 |
According to FMO theory, molecular reactivity can be studied via analysis of the density distributions of HOMO and LUMO. EHOMO describes the electron donating ability of a molecule, whereas ELUMO denotes the electron accepting ability of a molecule.64–66 From Fig. 12, it can be seen that the HOMO is spread principally on the heteroatoms and Schiff base structure in the non-protonated molecules, while the LUMO is mainly distributed over the whole structure. Thus, the heteroatoms and Schiff base segment are the main adsorption centers and act as the main sites for donating electrons to the unoccupied d-orbital of the iron atom to form coordinate bonds. Also, the whole molecule can accept electrons from the iron atoms with its anti-bonding orbital to form a feedback bond. For the protonated molecules, the pyridine ring is the main adsorption center and the Schiff base segment can accept electrons. In Table 8, the calculated values of EHOMO and ELUMO show that 3-PCPTC has higher EHOMO and ELUMO than 4-PCPTC. It is widely accepted that a better inhibitor should have a higher EHOMO and a lower ELUMO.64–66 Therefore, the trend obtained for ELUMO is not compatible with the order of the experimental inhibition efficiency data (η3-PCPTC > η4-PCPTC), which suggests the complex nature of the interactions involved in the corrosion inhibition process. Meanwhile, the EHOMO and ELUMO of the protonated molecules are lower than those of the non-protonated molecules. Thus, protonation reduces the ability of the inhibitors to donate electrons to the metal surface but enhances the ability to accept electrons. The dipole moment (μ) is another important electronic parameter considered in corrosion studies. The values of μ follow the order: 4-PCPTC > 3-PCPTC and 4-PCPTCH > 3-PCPTCH, which may be attributed to a lower value of μ favoring a greater accumulation of inhibitor molecules on the metal surface.24,66 With the help of the finite difference method,67 the absolute electronegativity (χ) and global hardness (γ) can be approximated based on the ionization potential (I) and electron affinity (A) of chemical species. According to Koopman's theorem,68 the quantities of I and A are defined as I = −EHOMO and A = −ELUMO, respectively. Therefore, χ and γ can be written as:
| | |
χ = (−EHOMO − ELUMO)/2
| (19) |
| | |
γ = (−EHOMO + ELUMO)/2
| (20) |
During the interaction between the inhibitor and the bulk metal, electron transfer continues until their electronegativity values become equalized. A perusal of the literature23,66 revealed that the work function (Φ) of the metal surface is an appropriate measure of its electronegativity and the fraction of electrons (ΔN) can be calculated as follows:
| | |
ΔN = (Φ − χinh)/[2(γFe + γinh)]
| (21) |
where
χinh,
γFe and
γinh represent the electronegativity of the inhibitor, and the hardness of iron and the inhibitor molecule, respectively. In
eqn (21),
γFe ≈ 0 eV and
Φ obtained from DFT calculations was 4.82 eV for the Fe (110) plane. The values of Δ
N are tabulated in
Table 8. If Δ
N > 0, the electrons transfer from the inhibitor to the metal and
vice versa if Δ
N < 0. In this study, it was clear that the values of Δ
N were positive for the interaction between the non-protonated molecules and Fe (110), but were negative for the interaction between the protonated molecules and Fe (110). Accordingly, 4-PCPTC and 3-PCPTC operate as electron donators while 4-PCPTCH and 3-PCPTCH act as electron acceptors, favoring the formation of an adsorption film on the metal surface.
It can be seen from Fig. 13 that the solvent effect obviously changes the FMO density distributions of the non-protonated and protonated inhibitors. The HOMO is spread principally on the benzene ring and Schiff base structure, while the LUMO is mainly distributed on the pyridine ring and heteroatoms. In Table 9, it is clear that 3-PCPTC has a higher EHOMO, and a lower ELUMO and μ than 4-PCPTC. This trend is compatible with η3-PCPTC > η4-PCPTC. Meanwhile, the protonation decreases the values of ΔN, which indicates that protonation improves the ability of the two inhibitors to accept electrons.
3.7 Molecular dynamics simulations
In order to gain more information about the adsorption behavior of 3-PCPTC and 4-PCPTC on the mild steel surface, MD simulations were performed. As can be seen from Fig. 14 and 15, protonated and non-protonated 3-PCPTC and 4-PCPTC adsorbed almost parallel to the Fe (110) surface both under vacuum and in aqueous solution, providing the largest blocking area for Fe against the aggressive solution. The difference in adsorption mode between 3-PCPTC and 4-PCPTC is related to the different substituent site of the Schiff base chain on the pyridine ring, indicating that the steric effect played an important role in the adsorption mode. Furthermore, the values of Eint listed in Table 10 are negative for the protonated and non-protonated 3-PCPTC and 4-PCPTC inhibitors in both vacuum and aqueous solution, implying that the adsorption process was spontaneous.63 According to previous literature, a more negative Eint value indicates that inhibitors adsorb on the Fe easier and have a higher inhibition efficiency.69 Thus, the conclusion can be drawn that 3-PCPTC exhibits a higher inhibition efficiency than 4-PCPTC in both vacuum and aqueous solution. The theoretical speculation is in good agreement with the results from the experimental measurements.
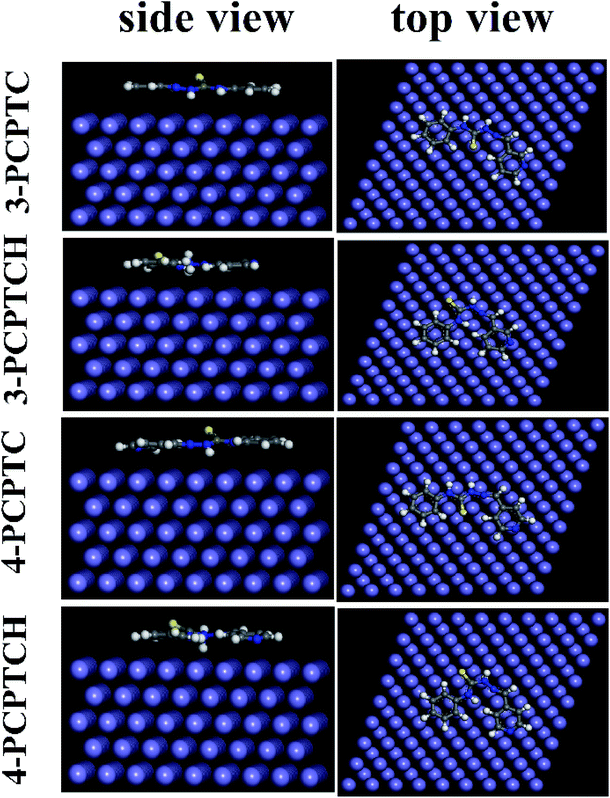 |
| | Fig. 14 Equilibrium adsorption configurations of the protonated and non-protonated inhibitors on the Fe (110) surface obtained under vacuum. | |
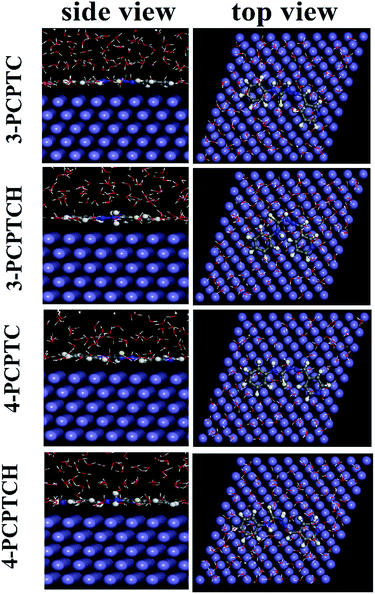 |
| | Fig. 15 Equilibrium adsorption configurations of the protonated and non-protonated inhibitors on the Fe (110) surface obtained in aqueous solution. | |
Table 10 The interaction energies between Fe (110) and the protonated and non-protonated inhibitors in both vacuum and aqueous solution
| Systems |
Eint (kcal mol−1) |
| In vacuum |
In aqueous solution |
| Fe (110) + 3-PCPTC |
−130.5 |
−132.1 |
| Fe (110) + 3-PCPTCH |
−132.5 |
−134.4 |
| Fe (110) + 4-PCPTC |
−129.6 |
−130.1 |
| Fe (110) + 4-PCPTCH |
−129.7 |
−134.3 |
3.8 Mechanism of inhibition
The corrosion inhibition of the organic inhibitor molecules hinges on the chemical structure of the inhibitor and the nature or the carried charge on the metal surface. According to the literature, we found that the inhibitors adsorb on the metal surface in acidic medium through the following interactions:18–27 (a) electrostatic inhibition between the positively-charged inhibitor and the already adsorbed chloride ions on the metal surface (physisorption process); (b) interaction between the lone-pair electrons on the heteroatoms (N, S, O, P) and the vacant orbitals on the metal surface (chemisorption process); and (c) donor–acceptor interactions between the π-electron in the aromatic ring or double/triple bond structure and the vacant orbitals on the metal surface (chemisorption process).
Thus, it is reasonable to assume that hydrated chloride ions present in the vicinity of the mild steel surface facilitate the adsorption of the protonated 3-PTPTC or 4-PTPTC molecules. Furthermore, the interaction of the lone-pair electrons and the vacant d-orbitals on the Fe surface or the donor–acceptor interaction between the π-electron (pyridine and benzene, Schiff base bond) and vacant d-orbital of Fe strengthens the adsorption of the 3-PTPTC or 4-PTPTC molecules. In aqueous phase, the benzene ring and Schiff base moieties act as the main sites to donate electrons to the unoccupied d-orbital of the iron atom to form coordinate bonds. Meanwhile, the pyridine ring and heteroatoms can accept electrons from the iron atoms with their anti-bonding orbital to form a feedback bond. In addition, the inhibitor molecules may combine with iron ions to form Fe-PCPTC complexes and adsorb on the metal surface due to the van der Waals force. In summary, the adsorption of 3-PTPTC or 4-PTPTC on the mild steel surface is comprehensive, and includes both physisorption and chemisorption. From the experimental and theoretical investigations, the observed inhibition efficiency order was 3-PTPTC > 4-PTPTC, which may be due to the different steric hindrance effect caused by the different substituent site of the Schiff base chain on the pyridine ring.
4. Conclusions
Two novel pyridine Schiff base inhibitors, 3-PCPTC and 4-PCPTC, were synthesized and studied for their corrosion inhibition performance on mild steel in 1.0 M HCl. From the obtained experimental and theoretical results, the following conclusions were drawn:
(1) Both 3-PCPTC and 4-PCPTC show good inhibition properties for mild steel in 1.0 M HCl solution and the observed inhibition efficiency follows the order 3-PTPTC > 4-PTPTC at same concentration.
(2) The corrosion inhibition efficiency of the two inhibitors increases sharply with increasing concentration and stays almost unchanged at different temperatures.
(3) The adsorption model of 3-PCPTC and 4-PCPTC obeys the Langmuir adsorption model.
(4) The potentiodynamic polarization measurements demonstrate that 3-PCPTC and 4-PCPTC behave as mixed type inhibitors, suppressing both anodic metal dissolution and cathodic hydrogen evolution reactions.
(5) UV-vis spectra suggest inhibitor-Fe interactions, while SEM and XPS experiments confirm that 3-PCPTC and 4-PCPTC adsorb on the mild steel surface and protect the substrate against acid attack.
(6) Molecular dynamics simulation results reveal that the protonated and non-protonated 3-PCPTC and 4-PCPTC adsorb nearly parallel to the Fe (110) surface in both vacuum and aqueous solution.
(7) The inhibition ability of the two novel pyridine Schiff base inhibitors follows the order: 3-PCPTC > 4-PCPTC, which has been confirmed by the experimental measurements and theoretical calculation measurements.
Conflicts of interest
There are no conflicts to declare.
Acknowledgements
Financial support from the National Science & Technology Pillar Program during the Twelfth Five-year Plan Period for Seawater Desalination Technology (2015BAB08B00), Jiangsu Province College Students Innovation and Entrepreneurship Training Program (201510291010Z), Natural Science Foundation for Young Scholars of Jiangsu Province, China (Grant No. BK20170111 and No. BK20160983), National Natural Science Foundation of China (Grant No. 21605084) and Special basic research service for the central level public welfare research institute (GYZX170302) is highly appreciated.
References
- N. K. Gupta, M. A. Quraishi, C. Verma and A. K. Mukherjee, RSC Adv., 2016, 6, 102076–102087 RSC.
- S. John and A. Joseph, RSC Adv., 2012, 2, 9944–9951 RSC.
- B. Xu, W. Yang, Y. Liu, X. Yin, W. Gong and Y. Chen, Corros. Sci., 2014, 78, 260–268 CrossRef CAS.
- K. Wan, P. Feng, B. Hou and Y. Li, RSC Adv., 2016, 6, 77515–77524 RSC.
- A. Khamis, M. M. Saleh and M. I. Awad, Corros. Sci., 2013, 66, 343–349 CrossRef CAS.
- M. Bobina, A. Kellenberger, J.-P. Millet, C. Muntean and N. Vaszilcsin, Corros. Sci., 2013, 69, 389–395 CrossRef CAS.
- R. Yıldız, A. Döner, T. Doğan and İ. Dehri, Corros. Sci., 2014, 82, 125–132 CrossRef.
- M. Yadav, R. R. Sinha, S. Kumar and T. K. Sarkar, RSC Adv., 2015, 5, 70832–70848 RSC.
- K. R. Ansari and M. A. Quraishi, J. Taiwan Inst. Chem. Eng., 2015, 54, 145–154 CrossRef CAS.
- X. Li, S. Deng and X. Xie, J. Taiwan Inst. Chem. Eng., 2014, 45, 1865–1875 CrossRef CAS.
- K. Zhang, W. Yang, B. Xu, Y. Liu, X. Yin and Y. Chen, J. Taiwan Inst. Chem. Eng., 2015, 57, 167–174 CrossRef CAS.
- O. Benali, L. Larabi, M. Traisnel, L. Gengembre and Y. Harek, Appl. Surf. Sci., 2007, 253, 6130–6139 CrossRef CAS.
- A. A. Farag and M. A. Hegazy, Corros. Sci., 2013, 74, 168–177 CrossRef CAS.
- A. Aytaç, Ü. Özmen and M. Kabasakaloğlu, Mater. Chem. Phys., 2005, 89, 176–181 CrossRef.
- S. Issaadi, T. Douadi, A. Zouaoui, S. Chafaa, M. A. Khan and G. Bouet, Corros. Sci., 2011, 53, 1484–1488 CrossRef CAS.
- B. Ramaganthan, M. Gopiraman, L. O. Olasunkanmi, M. M. Kabanda, S. Yesudass, I. Bahadur, A. S. Adekunle, I. B. Obot and E. E. Ebenso, RSC Adv., 2015, 5, 76675–76688 RSC.
- T. K. Chaitra, K. N. S. Mohana and H. C. Tandon, J. Mol. Liq., 2015, 211, 1026–1038 CrossRef CAS.
- Sudheer and M. A. Quraishi, Ind. Eng. Chem. Res., 2014, 53, 2851–2859 CrossRef CAS.
- Y. Tang, X. Yang, W. Yang, R. Wan, Y. Chen and X. Yin, Corros. Sci., 2010, 52, 1801–1808 CrossRef CAS.
- F. Zhang, Y. Tang, Z. Cao, W. Jing, Z. Wu and Y. Chen, Corros. Sci., 2012, 61, 1–9 CrossRef CAS.
- A. Kosari, M. H. Moayed, A. Davoodi, R. Parvizi, M. Momeni, H. Eshghi and H. Moradi, Corros. Sci., 2014, 78, 138–150 CrossRef CAS.
- A. Khadiri, R. Saddik, K. Bekkouche, A. Aouniti, B. Hammouti, N. Benchat, M. Bouachrine and R. Solmaz, J. Taiwan Inst. Chem.
Eng., 2016, 58, 552–564 CAS.
- B. Xu, Y. Ji, X. Zhang, X. Jin, W. Yang and Y. Chen, RSC Adv., 2015, 5, 56049–56059 RSC.
- B. Xu, Y. Ji, X. Zhang, X. Jin, W. Yang and Y. Chen, J. Taiwan Inst. Chem. Eng., 2016, 59, 526–535 CrossRef CAS.
- Y. Ji, B. Xu, W. Gong, X. Zhang, X. Jin, W. Ning, Y. Meng, W. Yang and Y. Chen, J. Taiwan Inst. Chem. Eng., 2016, 66, 301–312 CrossRef CAS.
- L. O. Olasunkanmi, I. B. Obot and E. E. Ebenso, RSC Adv., 2016, 6, 86782–86797 RSC.
- S. M. Shaban, RSC Adv., 2016, 6, 39784–39800 RSC.
- C. D. Taylor, Corros. Eng., Sci. Technol., 2015, 50, 490–508 CrossRef.
- I. B. Obot, D. D. Macdonald and Z. M. Gasem, Corros. Sci., 2015, 99, 1–30 CrossRef CAS.
- G. Gece, Corros. Sci., 2008, 50, 2981–2992 CrossRef CAS.
- D. D. Feitoza and A. J. Alves, Quim. Nova, 2012, 35, 694–698 CrossRef CAS.
- ASTM, Standard Practices for Laboratory Immersion Corrosion Testing of Metals, American society for testing and materials G31-72, ASTM International, 2004.
- L. O. Olasunkanmi, I. B. Obot, M. M. Kabanda and E. E. Ebenso, J. Phys. Chem. C, 2015, 119, 16004–16019 CAS.
- N. Soltani, M. Behpour, E. E. Oguzie, M. Mahluji and M. A. Ghasemzadeh, RSC Adv., 2015, 5, 11145–11162 RSC.
- H. Elmsellem, T. Harit, A. Aouniti, F. Malek, A. Riahi, A. Chetouani and B. Hammouti, Prot. Met. Phys. Chem. Surf., 2015, 51, 873–884 CrossRef CAS.
- J. Asegbeloyin, P. Ejikeme, L. Olasunkanmi, A. Adekunle and E. Ebenso, Materials, 2015, 8, 2918–2934 CrossRef.
- Y. Sasikumar, A. S. Adekunle, L. O. Olasunkanmi, I. Bahadur, R. Baskar, M. M. Kabanda, I. B. Obot and E. E. Ebenso, J. Mol. Liq., 2015, 211, 105–118 CrossRef CAS.
- N. K. Gupta, C. Verma, M. A. Quraishi and A. K. Mukherjee, J. Mol. Liq., 2016, 215, 47–57 CrossRef CAS.
- D. K. Sing, S. Kumar, G. Udayabhanu and R. P. John, J. Mol. Liq., 2016, 216, 738–746 CrossRef.
- G. Khan, W. F. Basirun, S. N. Kazi, P. Ahmed, L. Magaji, S. M. Ahmed, G. M. Khan and M. A. Rehman, J. Colloid Interface Sci., 2017, 502, 134–145 CrossRef CAS PubMed.
- E. E. Elemike, H. U. Nwankwo, D. C. Onwudiwe and E. C. Hosten, J. Mol. Liq., 2017, 1147, 252–265 CAS.
- H. Jafari, F. Mohsenifar and K. Sayin, J. Taiwan Inst. Chem. Eng., 2016, 64, 314–324 CrossRef CAS.
- N. Yilmaz, A. Fitoz, Ü. Ergun and K. C. Emregül, Corros. Sci., 2016, 111, 110–120 CrossRef CAS.
- T. K. Chaitra, K. N. S. Mohana and H. C. Tandon, J. Mol. Liq., 2015, 211, 1026–1038 CrossRef CAS.
- H. M. A. El-Lateef, A. M. Abu-Dief and M. A. A. Mohamed, J. Mol. Liq., 2017, 1130, 522–542 Search PubMed.
- A. M. Fekry and R. R. Mohamed, Electrochim. Acta, 2010, 55, 1933–1939 CrossRef CAS.
- B. Xu, Y. Liu, X. Yin, W. Yang and Y. Chen, Corros. Sci., 2013, 74, 206–213 CrossRef CAS.
- D. Özkır, K. Kayakırılmaz, E. Bayol, A. A. Gürten and F. Kandemirli, Corros. Sci., 2012, 56, 143–152 CrossRef.
- K. Zhang, B. Xu, W. Yang, X. Yin, Y. Liu and Y. Chen, Corros. Sci., 2015, 90, 284–295 CrossRef CAS.
- X. Q. Cao, B. Q. Yan, Q. Wang, Y. P. Wang, J. Qiu, Y. Q. Huang, L. Li, Y. Zhang, S. G. Hu, L. Kang and X. J. Lü, Chem. Res. Chin. Univ., 2017, 38, 173–181 CAS.
- A. K. Singh and M. A. Quraishi, Corros. Sci., 2011, 53, 1288–1297 CrossRef CAS.
- D. K. Yadav, M. A. Quraishi and B. Maiti, Corros. Sci., 2012, 55, 254–266 CrossRef CAS.
- M. Nordsveen, S. Nešić, R. Nyborg and A. Stangeland, Corrosion, 2003, 59, 443–456 CrossRef CAS.
- S. A. Umoren, I. B. Obot, A. Madhankumar and Z. M. Gasem, J. Adhes. Sci. Technol., 2015, 29, 271–295 CrossRef CAS.
- S. A. Umoren, Z. M. Gasem and I. B. Obot, Ind. Eng. Chem. Res., 2013, 52, 14855–14865 CrossRef CAS.
- M. ElBelghiti, Y. Karzazi, A. Dafali, B. Hammouti, F. Bentiss, I. B. Obot, I. Bahadur and E. E. Ebenso, J. Mol. Liq., 2016, 218, 281–293 CrossRef CAS.
- E. E. Stansbury and R. A. Buchanan, Fundamentals of Electrochemical Corrosion, ASM International, Ohio, 2000 Search PubMed.
- E. S. Ferreira, C. Giacomelli, F. C. Giacomelli and A. Spinelli, Mater. Chem. Phys., 2004, 83, 129–134 CrossRef CAS.
- I. Aiad, M. M. El-Sukkary, E. A. Soliman, M. Y. El-Awady and S. M. Shaban, J. Ind. Eng. Chem., 2014, 20, 3524–3535 CrossRef CAS.
- S. A. Umoren, Y. Li and F. H. Wang, Corros. Sci., 2010, 52, 1777–1786 CrossRef CAS.
- H. Cang, Z. Fei, W. Shi and Q. Xu, Int. J. Electrochem. Sci., 2012, 7, 10121–10131 CAS.
- T. Gu, Z. Chen, X. Jiang, L. Zhou, Y. Liao, M. Duan, H. Wang and Q. Pu, Corros. Sci., 2015, 90, 118–132 CrossRef CAS.
- A. Adewuyi, A. Göpfert and T. Wolff, Ind. Crops Prod., 2014, 52, 439–449 CrossRef CAS.
- M. Shahraki, M. Dehdab and S. Elmi, J. Taiwan Inst. Chem. Eng., 2016, 62, 313–321 CrossRef CAS.
- S. Kaya, L. Guo, C. Kaya, B. Tüzün, I. B. Obot, R. Touir and N. Islam, J. Taiwan Inst. Chem. Eng., 2016, 65, 522–529 CrossRef CAS.
- L. H. Madkour, S. Kaya, C. Kaya and L. Guo, J. Taiwan Inst. Chem. Eng., 2016, 68, 461–480 CrossRef CAS.
- R. G. Parr and W. Yang, Density Functional Theory of Atoms and Molecules, Oxford, Oxford University Press, 1989 Search PubMed.
- T. Koopmans, Physica, 1933, 1, 104–113 CrossRef CAS.
- B. Xu, W. Z. Yang, Y. Liu, X. S. Yin, W. N. Gong and Y. Z. Chen, Corros. Sci., 2014, 78, 260–268 CrossRef CAS.
Footnote |
| † These authors have contributed equally. |
|
| This journal is © The Royal Society of Chemistry 2017 |
Click here to see how this site uses Cookies. View our privacy policy here.  Open Access Article
 *a,
Kegui Zhanga,
Yun Chena,
Lihua Lia,
Xi Liua,
Jinhong Zhenga and
Yimin Zhangb
![[double bond, length as m-dash]](https://www.rsc.org/images/entities/char_e001.gif) N– group, are an effective type of corrosion inhibitors for metals in acidic media.13–17 Due to the planar structure, the lone pair of electrons on the nitrogen atom and the π-bond, Schiff base inhibitors can easily adsorb onto metal surfaces to form coordinate-covalent bonds with metals. It should be noted that Schiff base compounds, formed from the condensation of amine and aldehyde, can be conveniently synthesized from relatively cheap commercially available chemicals.1 Furthermore, as conventional organic corrosion inhibitors, pyridine and its derivatives have attracted much attention for their inhibition properties in recent years.18–22 However, the most studied pyridine derivatives contain only one pyridine ring, and investigations involving compounds with two or more aromatic rings are rare.23–25 As is well known, the inhibition potential is influenced by many factors, such as electronic structure, steric hindrance effects and aromaticity.26,27 Hence, it is difficult to predict the corrosion inhibition ability of a novel organic compound with a Schiff base group and more than one aromatic ring. In the present work, two novel pyridine Schiff base derivatives, 3-pyridinecarboxaldehyde-4-phenylthiosemicarbazide (3-PCPTC) and 4-pyridinecarboxaldehyde-4-phenyl thiosemicarbazide (4-PCPTC), containing a Schiff base moiety, one pyridine ring and another benzene ring, were investigated.
N– group, are an effective type of corrosion inhibitors for metals in acidic media.13–17 Due to the planar structure, the lone pair of electrons on the nitrogen atom and the π-bond, Schiff base inhibitors can easily adsorb onto metal surfaces to form coordinate-covalent bonds with metals. It should be noted that Schiff base compounds, formed from the condensation of amine and aldehyde, can be conveniently synthesized from relatively cheap commercially available chemicals.1 Furthermore, as conventional organic corrosion inhibitors, pyridine and its derivatives have attracted much attention for their inhibition properties in recent years.18–22 However, the most studied pyridine derivatives contain only one pyridine ring, and investigations involving compounds with two or more aromatic rings are rare.23–25 As is well known, the inhibition potential is influenced by many factors, such as electronic structure, steric hindrance effects and aromaticity.26,27 Hence, it is difficult to predict the corrosion inhibition ability of a novel organic compound with a Schiff base group and more than one aromatic ring. In the present work, two novel pyridine Schiff base derivatives, 3-pyridinecarboxaldehyde-4-phenylthiosemicarbazide (3-PCPTC) and 4-pyridinecarboxaldehyde-4-phenyl thiosemicarbazide (4-PCPTC), containing a Schiff base moiety, one pyridine ring and another benzene ring, were investigated.
![[thin space (1/6-em)]](https://www.rsc.org/images/entities/char_2009.gif) 600W/STD
600W/STD


 is the angular frequency at the maximum value of the imaginary part of the impedance spectrum. Rp0 and Rp represent the polarization resistance of mild steel without and with inhibitors, respectively. The representative simulations of both the Nyquist and Bode plots for 3-PCPTC and 4-PCPTC at 0.1 mM are given in Fig. 8. As shown in Table 7, the values of Rp increase prominently with the increase in the inhibitor concentrations for both 3-PCPTC and 4-PCPTC, while the values of Cdl decrease. Cdl of electrochemical impedance is defined by the Helmholtz model:


![[double bond, length as m-dash]](https://www.rsc.org/images/entities/char_e001.gif) C and C–H aromatic bonds in benzene or pyridine. The peak at 285.2 eV was ascribed to C–N or C
C and C–H aromatic bonds in benzene or pyridine. The peak at 285.2 eV was ascribed to C–N or C![[double bond, length as m-dash]](https://www.rsc.org/images/entities/char_e001.gif) N bonds in the molecule. The peak at around 288.2 eV was assigned to the carbon atom bonded to sulfur in the C
N bonds in the molecule. The peak at around 288.2 eV was assigned to the carbon atom bonded to sulfur in the C![[double bond, length as m-dash]](https://www.rsc.org/images/entities/char_e001.gif) S structure. The deconvoluted O1s spectra were fitted into two main peaks (Fig. 10c and d). The first peak (530.0 eV) was assigned to O2−, and was mainly associated with ferric oxides Fe2O3/Fe3O4. The second peak (531.6 eV) was ascribed to OH− of hydrous iron oxides FeOOH/Fe(OH)3. This was possibly due to the fact that a small amount of water molecules was present on the surface of mild steel when the sample was immersed in the solution. The deconvoluted N1s spectra (Fig. 10e and f) show two peaks. The peak located at around 399.3 eV was assigned to the molecular structure of nitrogen (
S structure. The deconvoluted O1s spectra were fitted into two main peaks (Fig. 10c and d). The first peak (530.0 eV) was assigned to O2−, and was mainly associated with ferric oxides Fe2O3/Fe3O4. The second peak (531.6 eV) was ascribed to OH− of hydrous iron oxides FeOOH/Fe(OH)3. This was possibly due to the fact that a small amount of water molecules was present on the surface of mild steel when the sample was immersed in the solution. The deconvoluted N1s spectra (Fig. 10e and f) show two peaks. The peak located at around 399.3 eV was assigned to the molecular structure of nitrogen (![[double bond, length as m-dash]](https://www.rsc.org/images/entities/char_e001.gif) N–, –NH–) and the other peak at around 400.1 eV was assigned to coordination bonds (N–Fe) between the lone pair of electrons on nitrogen atoms and Fe. From the above observations, the XPS results confirmed the adsorption of 3-PCPTC or 4-PCPTC on the mild steel surface.
N–, –NH–) and the other peak at around 400.1 eV was assigned to coordination bonds (N–Fe) between the lone pair of electrons on nitrogen atoms and Fe. From the above observations, the XPS results confirmed the adsorption of 3-PCPTC or 4-PCPTC on the mild steel surface.


