 Open Access Article
Creative Commons Attribution 3.0 Unported Licence
A new two-mode fluorescence signal amplification strategy for protease activity assay based on graphene oxide
Fangfang Wanga,
Jie Gaoa,
Jianwei Zhaoa,
Wenyue Zhanga,
Jie Baib,
Hongxia Jia *a and
Yucong Wang*a
aKey Laboratory of Medicinal Chemistry and Molecular Diagnosis of Ministry of Education, Key Laboratory of Analytical Science and Technology of Hebei Province, College of Chemistry and Environment Science, Hebei University, Baoding, 071002, P. R. China. E-mail: wangyucong@hbu.edu.cn; jhx@hbu.edu.cn; Fax: + 86 312 5079403; Tel: + 86 312 5079403
bMedical Comprehensive Experimental Center, Hebei University, Baoding, 071000, P. R. China
First published on 12th October 2017
Abstract
A graphene oxide (GO)-based two-mode fluorescence signal amplification assay of protease activity has been established. GO can adsorb the FITC-labeled substrate peptide and quench the fluorescence of FITC. In the presence of the target protein, carboxypeptidase Y (CPY), the FITC-labeled substrate peptide is hydrolyzed by CPY, leading to the turn-on of fluorescence. The fluorescence intensity increases significantly after the hydrolysis. More interestingly, it is even much higher than the fluorescence intensity of the added FITC-labeled substrate peptides. It is deduced that the extraordinary growing of fluorescence intensity is attributed to the hydrolysis also. The strong quenching efficiency of GO significantly improved the signal-to-noise ratio (SNR) of the proposed method for protease analysis. By combining the GO-based fluorescence turn-on with the fluorescence signal amplification induced by hydrolysis, the proposed method obtained higher sensitivity and specificity for CPY activity detection. The detection limit for CPY activity assay is estimated to be 1.0 × 10⁻⁵ U μL−1. The other proteins, proteases and a complicated matrix cannot disturb the assay of CPY activity.
Introduction
Proteases, one of the most important groups of physiological enzymes, can regulate the physiological functions of many proteins through catalyzing the breaking of specific peptide bonds in proteins.1 Recently, many studies have indicated that there is a close connection between the aberrant activities of proteases and major human diseases, including cancer, and cardiovascular, neurodegenerative and infection diseases.2 Sensitive and convenient detection of protease activity is imperative for better understanding of the proteases' physiological functions and has great potential for early diagnosis of human diseases as well as finding new therapeutic approaches and drugs based on the protease-target inhibitor for human diseases.The immunoassay has been widely used in the detection of proteases due to its high sensitivity and specificity.3 However, the immunoassay for protease suffers from the disadvantages of requiring some very complicated and time-consuming processes such as expression and purification of proteins, antibody immobilization, fluorophore labeling and washing again and again. In recent years, peptide-based protease biosensors have attracted more and more attention in the assay of proteases.4 The protease biosensors are constructed based on hydrolysis of the substrate peptide by the target protease. Some materials such as nanoparticles, electrochemical materials, fluorescent dyes and so on are chosen as signal markers to conjugate to the substrate peptide firstly.5 The target protease can accurately and efficiently hydrolyze its corresponding substrate peptide sequence and the hydrolysis information can be converted into measurable signal through the status change of signal marker. Up to now, fluorescence resonance energy transfer (FRET)-based fluorescence protease sensors is one of the most popular approaches for protease activity monitoring.6 In the FRET-based system, donor–acceptor pair is usually attached at the opposite ends of substrate peptide. In presence of target protease, the substrate peptide is hydrolyzed and the fluorescent molecule is released, generating an increase of fluorescence intensity. However, these FRET-based sensors often need double labels, such as fluorescence group and quenching group, which increases the testing cost. Furthermore, the detection sensitivity are particularly affected by the quenching efficiency.
Graphene oxide (GO) is water-soluble derivative of graphene and has been applied as an energy acceptor in the FRET-based protease activity assay due to its super quenching efficiency.7 GO is usually fixed on one of terminals of peptide by specific interaction between biotin and streptavidin (STV) or covalent conjugation. The formation of linkage requires complicated and time-consuming modification, activation and conversion processes.8 It's worth mentioning that GO has another unique property that is super adsorption capacity.9 Compared with the complexed connection, the adsorption is more simpler, faster and time saving. Many fluorescence analysis protocols based on the super adsorption property of GO have been widely applied for the detection of various biomolecules.10
Carboxypeptidase Y (CPY) is a kind of exopeptidase with nonspecifically hydrolyzing polypeptide chains at the C-terminal (carboxyl-terminal) of the peptide or protein. CPY is a metal ion-independent enzyme and thus it is not inactivated by chelating agents such as EDTA. Moreover, it is highly stable to heat, pH, and denaturing agents.11 Due to these unique properties, CPY has been readily available for use in C-terminal sequencing of protein12 and hydrolyzing peptide for the kinase assays.13 Determination of CPY activity is imperative for gaining a better understanding of the functions of these biomolecules. Herein, we take CPY as the model protease and develop a two-mode fluorescence signal amplification strategy for detection of protease activity based on GO.
In this work, fluorophore-labeled substrate peptide is adsorbed onto the surface of GO by electrostatic and π–π interaction.14 The FRET from fluorophore to GO leads to fluorescence quenching. In the presence of CPY, the substrate peptide is hydrolyzed by CPY and thus the fluorescence resonance energy can not transfer from fluorophore to GO, resulting in the turn-on of fluorescence. Meanwhile, we find a very interesting phenomenon that the fluorescence intensity grows dramatically after hydrolysis as the increase of CPY concentration, and even with excess fluorophore-labeled substrate peptides. We deduce that the hydrolysis makes the fluorophores pull away from the influence of amino acid residues of substrate peptides. Therefore, the fluorescent efficiency of fluorophore increases after the hydrolysis and the fluorescence intensity grows dramatically, simultaneously. By integrating the GO-based fluorescence turn-on mode and the surprising fluorescence growth induced by peptide hydrolysis, a two-mode fluorescence signal amplification strategy for sensitive detection of target protease activity is proposed.
Results and discussion
The principle of the proposed assay for protein activity assay
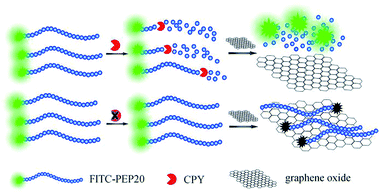
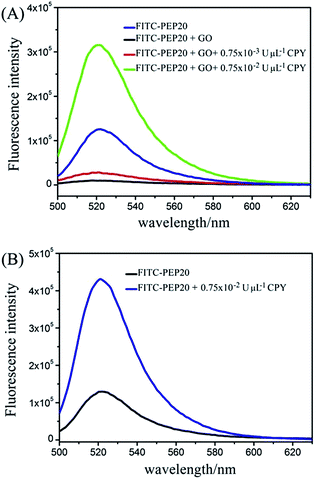
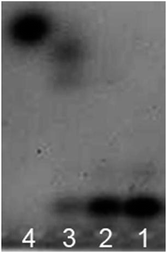
The assay strategy of GO-based two-mode fluorescence signal amplification assay for CPY activity is illustrated in Fig. 1. A fluorescein-labeled peptide (FITC-TTYADFIASGRTGRRNAIHD, FITC-PEP20) is used as the special substrate peptide for CPY. As shown in the Fig. 1, in the absence of CPY, the FITC-PEP20 is adsorbed onto the surface of GO by the electrostatic and π–π stacking interaction. The adsorption makes FITC molecule and GO close enough to cause FRET from FITC molecule to GO and further efficient fluorescence quenching. In contrast, in the presence of CPY, the FITC-PEP20 is hydrolyzed by CPY from the C-terminal, generating many free amino acid residues. Therefore, the FITC molecule gets away from the GO after hydrolysis due to the weak binding between them. The FITC molecules are released to solution, inducing the fluorescence recovery. The GO-based fluorescence turn-on mode induced by CPY is formed. As shown in the Fig. 2A, the FITC-PEP20 exhibits a higher fluorescence signal (Fig. 2A, blue line). It is almost completely quenched upon the addition of GO (Fig. 2A, black line). When the added FITC-PEP20 is pre-treated with a lower concentration of CPY and then mixed with GO, the fluorescence signal gets partial restoration (Fig. 2A, red line). More intriguingly, when a larger concentration of CPY is used (Fig. 2A, green line), much higher fluorescence signal is observed in comparison to the added FITC-PEP20 alone. To confirm the root cause of the extraordinary fluorescence growth, the experiments in contrast without GO are carried out. In the absence of GO, the enhancement of fluorescence induced by CPY can be also observed (Fig. 2B). It is speculated that the fluorescent efficiency of FITC is very sensitive to changes of surrounding environment. When FITC is labeled to the peptide, its fluorescent efficiency is repressed due to the influence of amino acid residues of peptide. After the hydrolysis of FITC-PEP20 by CPY, the surrounding environment which the FITC molecule is in, such as the charge distribution and so on, is changed. The hydrolysis makes the FITC molecule free from the influence of amino acid residues of peptide, and therefore the fluorescent efficiency of FITC molecule increases and the fluorescence signal intensity shows very prominent growth after the hydrolysis. The extraordinary fluorescence growth induced by hydrolysis of peptide forms the fluorescence signal amplification mode. Notably, the strong quenching efficiency of GO significantly improved the signal-to-noise ratio (SNR) of the proposed method for protease assay. With and without GO (Fig. 2A and B), the SNRs of fluorescence in presence of 0.75 × 10⁻² U μL−1 CPY are 30 and 4, respectively. The elevated SNR contributes to the higher detection sensitivity. By the combined action of the increase of fluorescence signal induced by hydrolysis and GO-based fluorescence turn-on mode, a two-mode fluorescence signal amplification strategy for the determination of CPY is established.The electrophoresis results of hydrolyzed of FITC-PEP20 by CPY also powerfully demonstrate our inferences. The isoelectric point of PEP20 is 8.34 which is very close with the pH of the electrophoresis buffer (pH = 8.0). So, the FITC-PEP20 carries very little negative charges in the electrophoresis buffer. As the Fig. 3 shown, in the blank solution without CPY, the FITC-PEP20 moves slowly toward the cathode (line 1). In the presence of CPY, the added FITC-PEP20 are hydrolyzed. As the increasing of concentration of CPY, the amount of FITC-PEP20 decreases gradually and the amount of free FITC molecule increases obviously. The corresponding phenomena can be observed in the Fig. 3. The fluorescence bands of the FITC-PEP20 gradually become weaker, and even disappeared, while the free FITC molecules enhance progressively as the increasing of CPY dosage from line 1 to line 4. After the hydrolysis reaction, the free FITC molecules migrate faster to cathode. Furthermore, with the relatively high concentration of CPY, the added FITC-PEP20 is hydrolyzed completely and its fluorescence band is disappeared. Instead, a very distinct fluorescence band occurs near the anode (line 4), which is derived from the free FITC molecules. Notably, the fluorescence of free FITC molecules is stronger than that in the added FITC-PEP20 (line 1). It is a very obvious evidence that the fluorescence signal amplification caused by hydrolysis. All of the results displayed above well support our proposed fluorescence amplification mechanism induced by hydrolysis of substrate peptide by CPY.
Optimization of the experimental condition for the CPY activity assay
To obtain the optimal experimental parameters for the detection of CPY activity, the influences of the hydrolysis time of FITC-PEP20 by CPY, the concentration of GO and the quenching time of GO to FITC-PEP20 in this assay are investigated.To investigate the influence of the concentration of GO on the fluorescence quenching process, various concentrations of GO (0.5–15 μg mL−1) are incubated with 100 nM FITC-PEP20, and then the fluorescence spectra of mixtures are recorded. As Fig. 4 shown, the fluorescence intensities decrease quickly as the increasing of concentration of GO. The fluorescence is quenched completely at 5.0 μg mL−1 GO. So, 5.0 μg mL−1 GO is selected for the detection of CPY in this study.
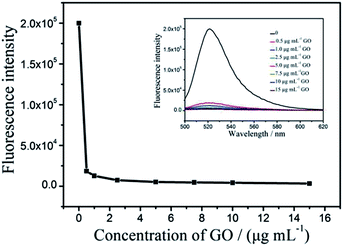 | ||
| Fig. 4 The influence of the concentration of GO on the fluorescence quenching process. The concentration of FITC-PEP20 is 100 nM. | ||
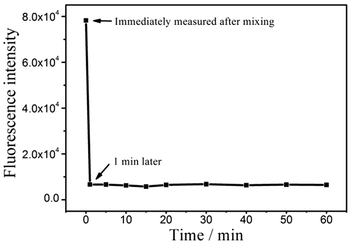
The kinetics curve of quenching time of GO to FITC-PEP20 is also drawn. As shown as Fig. 5, GO can interact with FITC-PEP20 and quench its fluorescence with 1 min. Extended time does not change the fluorescence intensities. Therefore, the FITC-PEP20 and GO are co-incubated for 1 min prior to the measurement.
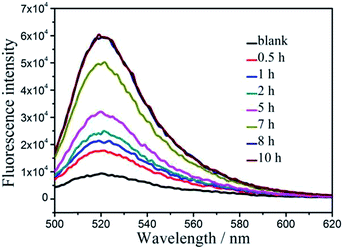
In addition, the influence of hydrolysis time of CPY to FITC-PEP20 is investigated in a period of 10 h after mixing the FITC-PEP20 and CPY in Tris–HCl buffer solution. The fluorescence measurements are carried out after incubation of the mixtures and GO for 1 min. As Fig. 6 shows that the blank is composed of FITC-PEP20 and GO, without CPY, generating fluorescence quenching. In the presence of CPY, fluorescence signals are recovered gradually as the increasing of the hydrolysis time and reach its peak level at 8 h. So, 8 h is selected as hydrolysis time of CPY to FITC-PEP20 for the further experiments.
The CPY activity assay
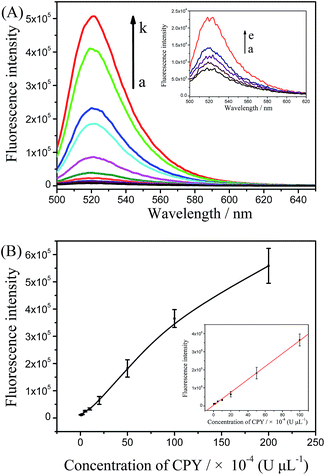
Under the optimum conditions, the target protease, CPY, is detected quantitatively by using the proposed protease assay. As Fig. 7 shows that the fluorescence signals gradually increase as the CPY dosage vary from 5.0 × 10⁻⁵ to 2.0 × 10⁻² U μL−1. The fluorescence intensities at 517 nm are linearly dependent on the concentration of CPY in a range of 5.0 × 10⁻⁵–1.0 × 10⁻² U μL−1. The correlation equation is IF = 3872.87 + 3582.53 CCPY (×10−4 U μL−1) with the correlation coefficient of 0.9974. The detection limit of the target protease, CPY, is evaluated to be 1.0 × 10⁻⁵ U μL−1 (3σ, n = 11). The proposed strategy with GO is further compared with that without GO. As shown in the Fig. 8, the lowest detected concentration without GO is 2.0 × 10⁻⁴ U μL−1. The detection sensitivity of the proposed GO-based assay is one order of magnitude higher than that without GO. This detection limit is comparable or better than some other FRET-based methods for protease activity detection (shown in Table 1).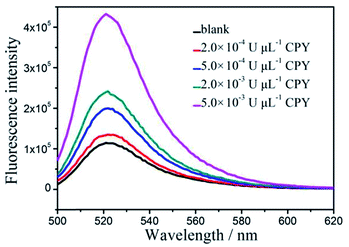 | ||
| Fig. 8 Fluorescence spectra of the CPY assay system without GO in the presence of different concentrations of CPY. FITC-PEP20 is 100 nM. The blank is without CPY. | ||
The selectivity of the CPY activity assay
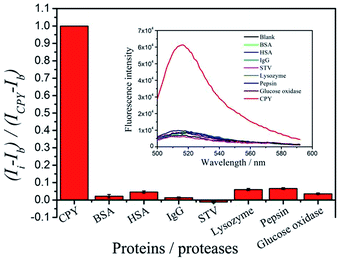
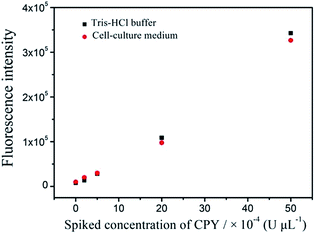
To evaluate the specificity of the proposed protease assay, the interference of other seven proteins and proteases, including BSA, HSA, IgG, STV, lysozyme, pepsin and glucose oxidase is investigated. Under the optimum conditions, the fluorescence signal produced by CPY can be separated completely from those generated from by the other proteins and proteases. As shown in Fig. 9, only CPY can induce the significant fluorescence recovery. In presence of the interference proteins or proteases, the fluorescence curves are similar with that produced by the blank. The interferences for the detection of CPY by the signals produced by other proteins and proteases are estimated to be below 7%. And the spiked the complex sample with the addition of CPY has been tested. The complex sample contains 1 × 10⁻³ U μL−1 BSA, HSA, IgG, STV, lysozyme, pepsin, glucose oxidase and CPY. 2 × 10⁻³ and 4 × 10⁻³ U μL−1 CPY are added to the complex samples, respectively. The average concentrations of CPY determined for three repetitive measurements are 2.72 × 10⁻³ and 5.29 × 10⁻³ U μL−1, respectively. The analytical recoveries are 87.5% and 108%. All these results clearly certify that the proposed assay to detect target protease allowed the excellent specificity.To validate whether our proposed method could be applied to the real samples with the complicated matrix, the cell-culture medium is used as complicated matrix to do the spiking test. The fluorescence signals produced by the same concentrations of CPY in the complicated systems coincide with that in the Tris–HCl buffer system (Fig. 10). The results show that the proposed method is undisturbed by complicated matrix.
Conclusions
In summary, we have demonstrated that hydrolysis of peptide can improve the fluorescence efficiency of fluorescein labeled on peptide, inducing the significant increasing of fluorescence intensity. Via the super fluorescence quenching capacity of GO, the proposed protein assay obtained a good SNR. By integrating GO-based fluorescence turn-on and signal amplification induced by hydrolysis of substrate peptide, a new two-mode fluorescence signal amplification strategy is proposed for the sensitive detection of target protease. The detection limit for protein assay is as low as 1.0 × 10⁻⁵ U μL−1. The protease assay also exhibits a great dynamic range of over 3 orders of magnitude and high specificity to be undisturbed by other proteins, proteases and complicated matrix. This detection strategy is simple, cost-effective and with high selectivity. It can contribute significantly to the applications in the detection of complex biological samples.Experimental section
Materials and apparatus
Carboxypeptidase Y (CPY) and trihydroxy methyl amino methane (Tris) are obtained from Sigma-Aldrich (Shanghai) Trading Co. Ltd. (China). Graphite powder is purchased from Alfa Aesar (Tianjin) Chemical Co. Ltd. (China). The FITC-labeled substrate peptide (FITC-TTYADFIASGRTGRRNAIHD, FITC-PEP20) is customized synthesis by GL Biochem (Shanghai) Co. Ltd. All other reagents are analytical reagent grade. Double-distilled water is used throughout.The hydrolysis of peptide by CPY is performed on a CHB-100 isothermal metal bath (Hangzhou Bioer Technology Co. Ltd., China). The fluorescence curves are measured on a Fluorolog 3-211 fluorescence spectrophotometer (Horiba Jobin-Yvon, France).
Synthesis and characterization of graphene oxide
Graphene Oxide (GO) is prepared according to a modified Hummer's method.16 Briefly, 20 mL of concentrated H2SO4 is added slowly into a 500 mL of three necked flask and mixed with 0.5 g of graphite powder. The mixture is stirred for 2 h at room temperature. Afterwards, 2.5 g of KMnO4 is added progressively with stirring and the temperature is kept below 20 °C. And then the mixture is stirred at 35 °C for 2 h. Successively, keep the temperature of mixture below 50 °C and 45 mL double-distilled water is added and the mixture is stirred at room temperature for 3 h. Next, the reaction is terminated by the addition of 112.5 mL double-distilled water and 5.0 mL H2O2 (30%) under stirring for 15 min. Following that, the mixture is washed with 1![[thin space (1/6-em)]](https://www.rsc.org/images/entities/char_2009.gif) :
:![[thin space (1/6-em)]](https://www.rsc.org/images/entities/char_2009.gif) 10 HCl aqueous solution, and then distilled water for several times. Exfoliation is carried out by sonicate dispersion of GO for 2 h. Finally, the mixture is centrifuged at 6600 rpm for 10 min, and the supernatant is removed and used for further experiments as homogeneous solution of GO.
10 HCl aqueous solution, and then distilled water for several times. Exfoliation is carried out by sonicate dispersion of GO for 2 h. Finally, the mixture is centrifuged at 6600 rpm for 10 min, and the supernatant is removed and used for further experiments as homogeneous solution of GO.
Procedures for CPY detection based on GO
To hydrolyze substrate peptide, various concentrations of CPY and 100 nM substrate peptide (FITC-PEP20) are mixed and incubated for 8.0 h at room temperature in 200 μL of Tris–HCl buffer (50 mM, pH 7.5). Afterwards, GO (final concentration of ∼5 μg mL−1) is added to the mixture and incubated for 1 min. Then the fluorescence spectra are measured on an Fluorolog 3-211 fluorescence spectrometer. The excitation wavelength is 480 nm, the emission wavelength is 500–650 nm. The width of excitation and emission slits are both 5 nm.Procedures for CPY detection without GO
100 nM of FITC-PEP20 is incubated with different concentrations of CPY in Tris–HCl (50 mM Tris–HCl, pH 7.5) buffer for 8 h. Then, fluorescence spectra are recorded by Fluorolog 3-211 fluorescence spectrometer.Procedures for CPY detection in cell-culture medium
A certain concentration of CPY, 100 nM substrate peptide (FITC-PEP20) and 1 μL DMEM medium containing 20% fetal bovine serum are mixed in 200 μL of Tris–HCl buffer (50 mM, pH 7.5). The mixture is incubated for 8.0 h at room temperature in the isothermal metal bath for hydrolysis. Afterwards, GO (final concentration of ∼5 μg mL−1) is added to the mixture and incubated for 1 min. Then, fluorescence spectra are recorded by Fluorolog 3-211 fluorescence spectrometer.Conflicts of interest
There are no conflicts of interest to declare.Acknowledgements
The project is supported by the National Natural Science Foundation of China (21405032, 21605035); and the Natural Science Foundation of Hebei Province (B2016201052, B2015201130).Notes and references
- X. S. Puente, L. M. Sánchez, C. M. Overall and C. López-Otín, Nat. Rev. Genet., 2003, 4, 544 CrossRef CAS PubMed.
- (a) S. P. M. Lutgens, K. B. J. M. Cleutigens, M. J. A. P. Daemen and S. Heeneman, FASEB J., 2007, 21, 3029 CrossRef CAS PubMed; (b) W. B. Luo, Y. F. Wang and G. Reiser, Brain Res. Rev., 2007, 56, 331 CrossRef CAS PubMed; (c) U. H. Iloeje, Y. yuan, G. L. Italien, J. Mauskopf, S. D. Holmberg, A. C. Moorman, K. C. Wood and R. D. Moore, HIV Med., 2005, 6, 37 CrossRef CAS PubMed; (d) S. Lee, E. J. Cha, K. Park, S. Y. Lee, J. K. Hong, I. C. Sun, S. Y. Kim, K. Choi, I. C. Kwon, K. Kim and C. H. Ahn, Angew. Chem., Int. Ed., 2008, 47, 2804 CrossRef CAS PubMed.
- (a) E. P. Diamandis, G. M. Yousef, A. R. Soosaipillai, L. Grass, A. Porter, S. Little and G. Sotiropoulou, Clin. Biochem., 2000, 33, 369 CrossRef CAS PubMed; (b) H. K. Yoon and T. H. Yoo, Analyst, 2013, 138, 7164 RSC.
- Q. T. Liu, J. F. Wang and B. J. Boyd, Talanta, 2015, 136, 114 CrossRef CAS PubMed.
- (a) J. M. Ellard, T. Zollitsch, W. J. Cummins, A. L. Hamilton and M. Bradley, Angew. Chem., Int. Ed., 2002, 41, 3233 CrossRef; (b) J. H. Choi, H. S. Kim, J. W. Choi, J. W. Hong, Y. K. Kim and B. K. Oh, Biosens. Bioelectron., 2013, 49, 415 CrossRef CAS PubMed; (c) N. Zhao, Y. Q. He, X. Mao, Y. H. Sun, X. B. Zhang, C. Z. Li, Y. H. Lin and G. D. Liu, Electrochem. Commun., 2010, 12, 471 CrossRef CAS; (d) J. Adjémian, A. Anne, G. Cauet and C. Demaille, Langmuir, 2010, 26, 10347 CrossRef PubMed; (e) W. Pham, Y. Choi, R. Weissleder and C. H. Tung, Bioconjugate Chem., 2004, 15, 1403 CrossRef CAS PubMed.
- (a) H. P. Kapprell, A. Maurer, F. Kramer, B. Heinrich, C. Buenning, A. Narvaez, H. Kalbacher and T. Flad, Assay Drug Dev. Technol., 2011, 9, 549 CrossRef CAS PubMed; (b) R. Fudala, A. P. Ranjan, A. Mukerjee, J. K. Vishwanatha, Z. Gryczynski, J. Borejdo, P. Sarkar and I. Gryczynski, Curr. Pharm. Biotechnol., 2011, 12, 834 CrossRef CAS PubMed; (c) W. E. Kaman, A. G. Hulst, P. T. W. van Alphen, S. Roffel, M. J. van der Schans, T. Merkel, A. van Belkum and F. J. Bikker, Anal. Chem., 2011, 83, 2511 CrossRef CAS PubMed.
- (a) B. Y. Feng, L. J. Guo, L. H. Wang, F. Li, J. X. Lu, J. M. Gao, C. H. Fan and Q. Huang, Anal. Chem., 2013, 85, 7732 CrossRef CAS PubMed; (b) C. H. Lu, J. Li, X. J. Qi, X. R. Song, H. H. Yang, X. Chen and G. N. Chen, J. Mater. Chem., 2011, 21, 10915 RSC; (c) S. Kim, S. R. Ryoo, H. K. Na, Y. K. Kim, B. S. Choi, Y. Lee, D. E. Kim and D. H. Min, Chem. Commun., 2013, 49, 8241 RSC; (d) V. Kotikam, M. Fernmandes and V. A. Kumar, Phys. Chem. Chem. Phys., 2012, 14, 15003 RSC.
- (a) H. B. Wang, Q. Zhang, X. Chu, T. T. Chen, J. Ge and R. Q. Yu, Angew. Chem., Int. Ed., 2011, 50, 7065 CrossRef CAS PubMed; (b) J. Li, C. H. Lu, Q. H. Yao, X. L. Zhang, J. J. Liu, H. H. Yang and G. N. Chen, Biosens. Bioelectron., 2011, 26, 3894 CrossRef CAS PubMed; (c) E. Q. Song, D. Cheng, Y. Song, M. D. jiang, J. F. Yu and Y. Y. Wang, Biosens. Bioelectron., 2013, 47, 445 CrossRef CAS PubMed.
- (a) C. H. Lu, H. H. Yang, C. L. Zhu, X. Chen and G. N. Chen, Angew. Chem., Int. Ed., 2009, 48, 4785 CrossRef CAS PubMed; (b) H. X. Chang, L. H. Tang, Y. Wang, J. H. Jiang and J. H. Li, Anal. Chem., 2010, 82, 2341 CrossRef CAS PubMed; (c) Y. Wang, Z. H. Li, D. H. Hu, C. T. Lin, J. H. Li and Y. H. Lin, J. Am. Chem. Soc., 2010, 132, 9274 CrossRef CAS PubMed.
- (a) S. J. He, B. Song, D. Li, C. F. Zhu, W. P. Qi, Y. Q. Wen, L. H. Wang, S. P. Song, H. P. Fang and C. H. Fan, Adv. Funct. Mater., 2010, 20, 453 CrossRef CAS; (b) H. J. Jang, Y. K. Kim, H. M. Kwon, W. S. Yeo, D. E. Kim and D. H. Min, Angew. Chem., Int. Ed., 2010, 49, 5703 CrossRef CAS PubMed; (c) X. G. Liu, X. J. Xing, B. Li, Y. M. Guo, Y. Z. Zhang, Y. Yang and L. F. Zhang, Biosens. Bioelectron., 2016, 81, 460 CrossRef CAS PubMed; (d) M. Zhang, B. C. Yin, X. F. Wang and B. C. Ye, Chem. Commun., 2011, 47, 2399 RSC; (e) D. B. Zhu, L. Zhang, W. G. Ma, S. Q. Lu and X. B. Xing, Biosens. Bioelectron., 2015, 65, 152 CrossRef CAS PubMed.
- (a) R. Hayashi, Y. Bai and T. Hata, J. Biol. Chem., 1975, 250, 5221 CAS; (b) R. W. Kuhn, K. A. Walsh and H. Neurath, Biochemistry, 1974, 13, 3871 CrossRef CAS PubMed.
- D. H. Patterson, G. E. Tarr, F. E. Regnier and S. A. Martin, Anal. Chem., 1995, 67, 3971 CrossRef CAS PubMed.
- (a) J. Zhou, X. H. Xu, W. Liu, X. Liu, Z. Nie, M. Qing, L. H. Nie and S. Z. Yao, Anal. Chem., 2013, 85, 5746 CrossRef CAS PubMed; (b) H. S. Yin, X. X. Wang, Y. L. Guo, Y. L. Zhou and S. Y. Ai, Biosens. Bioelectron., 2015, 66, 77 CrossRef CAS PubMed.
- (a) C. Rajesh, C. Majumder, H. Mizuseki and Y. Kawazoe, J. Chem. Phys., 2009, 130, 124911 CrossRef PubMed; (b) G. F. Chen, H. Shi, F. F. Ban, Y. Y. Zhang and L. Z. Sun, Microchim. Acta, 2015, 182, 2469 CrossRef CAS.
- (a) P. M. Shih, T. K. Liu and K. T. Tan, Chem. Commun., 2013, 49, 6212 RSC; (b) H. J. Kang, J. H. Kim and S. J. Chung, Biosens. Bioelectron., 2015, 67, 413 CrossRef CAS PubMed; (c) M. Wu, E. Petryayeva and W. R. Algar, Anal. Chem., 2014, 86, 11181 CrossRef CAS PubMed; (d) D. L. Liao, Y. X. Li, J. Chen and C. Yu, Anal. Chim. Acta, 2013, 784, 72 CrossRef CAS PubMed.
- (a) W. S. Hummers and R. E. Offeman, J. Am. Chem. Soc., 1958, 80, 1339 CrossRef CAS; (b) C. H. Liu, Z. Wang, H. X. Jia and Z. P. Li, Chem. Commun., 2011, 47, 4661 RSC.
| This journal is © The Royal Society of Chemistry 2017 |

