
 Open Access Article
 This Open Access Article is licensed under a Creative Commons Attribution-Non Commercial 3.0 Unported Licence
Ionic liquids as efficient pretreatment solvents for lignocellulosic biomass
Fu-Ling Wang a,
Shuang Lia,
Yi-Xin Suna,
Hui-Ying Hana,
Bi-Xian Zhangb,
Bao-Zhong Hu*c,
Yun-Fei Gaob and
Xiao-Mei Hu*a
a,
Shuang Lia,
Yi-Xin Suna,
Hui-Ying Hana,
Bi-Xian Zhangb,
Bao-Zhong Hu*c,
Yun-Fei Gaob and
Xiao-Mei Hu*a
aCollege of Life Science, Northeast Agricultural University, Harbin, 150030, China. E-mail: huxiaomei1982@163.com
bHeilongjiang Academy of Agricultural Sciences, Harbin, 150086, China
cHarbin University, Harbin, 150086, China. E-mail: bzhu@neau.edu.cn
First published on 12th October 2017
Abstract
Ionic liquid (IL)-assisted pretreatment of lignocellulosic biomass has been extensively studied. Cellulose and hemicelluloses are rich resources of sugars for biofuels. Lignin is a valuable feedstock for aromatic-based platform chemicals. In this study, a series of ionic liquids (ILs) were prepared with one-step synthesis and were investigated for their activity to pretreat lignocelluloses. High yields of lignin (61.0% and 60.4%) were achieved through [Hpy]Cl and [Hmim]Cl pretreatment of poplar. Lignin yields of 51.7% and 50.3% were obtained with a [Hpy]Cl and [Hnmp]Cl pretreatment of bamboo. Improving enzymatic hydrolysis was observed from the regenerated poplar with [Hpy]Cl pretreatment and the regenerated bamboo with [Hmim]Cl pretreatment. The isolated fractions were characterized by FTIR (Fourier transform infrared) spectroscopy. SEM (Scanning electron microscopy) and XRD (X-ray diffractometry) were employed to examine the cellulose-rich materials. A 2D 1H–13C heteronuclear single quantum coherence (HSQC) nuclear magnetic resonance (NMR) spectroscopy was employed to analyze lignin fraction. These ionic liquids were particularly effective to extract lignin from lignocelluloses to obtain cellulose-rich materials for biofuels.
1. Introduction
Lignocelluloses are potentially valuable resources due to their capability of being transformed into biofuels and bioproducts. The main constituents of lignocelluloses include cellulose, hemicelluloses, and lignin. Cellulose and its derivatives are extensively used in industries such as textiles, plastics, wood and paper products, cosmetics and pharmaceuticals. There have been a number of biorefinery studies focusing on the conversion of the cellulose fraction of the biomass as a source for fuels or higher value products.1 Additionally, the lignin fraction can be a valuable feedstock for the production of aromatic platform chemicals. Lignin sulfonates are used in various applications such as phenol-formaldehyde plastics, binders, adsorbents, and adhesives.2 Lignin is also used to produce various polymers such as polyesters and polyurethanes. Lignin is a potential renewable source for “value-added” chemicals, such as benzene, phenol, guaiacol, vanillic acid, and methanol.However, due to the recalcitrant structure of lignocelluloses, the pretreatment of lignocelluloses are necessary. A variety of ionic liquids (ILs), such as imidazolium-, pyridinium-, ammonium-, and phosphonium-based cations, along with alkyl or allyl side chains coupled to various anions, such as chloride, acetate, and phosphonate, have been used in the pretreatment of lignocellulosic biomass.3–5
Ionic liquids are environmentally compatible solvents. They have high thermal stabilities and negligible vapor pressures; they do not release toxic or explosive gases when utilized.6 Previous studies on ILs have focused on lignin removal from lignocellulosic biomasses to improve the saccharification efficiency of lignocelluloses. Fu and Mazza reported 29% total lignin removal from triticale straw using 1-ethyl-3-methylimidazolium acetate ([Emim]Cl) as a pretreated solvent at 150 °C for 1.5 h.7 Wei et al. investigated 1-butyl-3-methylimidazolium chloride ([Bmim]Cl) as an IL solvent for the pretreatment of legume straw at 150 °C for 2 h; the authors observed 30% lignin removal.8 Currently, more studies have been conducted regarding the lignin yield as lignin is a potential renewable source for valuable products. The pretreatment of corn stalks with [Emim]Ac at 125 °C for 1 h resulted in a 44% lignin yield.9 The fractionation of bagasse was performed at 110 °C for 16 h with choline acetate, and 20% of the lignin was fractionated as lignin-rich material.10
Ionic liquids, such as [Emim]Cl, [Bmim]Cl and [Emim]Ac have been widely reported for the pretreatment of lignocelluloses, however, high pretreatment temperatures and long processing times are always required.11 A ball mill was also used for 72 h before IL pretreatment.12 However, lignin regeneration is not very efficient using ILs such as [Bmim]Cl and [Emim]Ac.13,14 In this study, a series of ionic liquids were synthesized and investigated for their activity on the pretreatment of poplar and bamboo flours.
2. Experimental
2.1 Materials
All chemicals were purchased from Aladdin Company (ShangHai, China) and used as received. Poplar flour and bamboo flour were purchased from Xingtang Xinlei Mineral Powder Factory (ShiJiaZhuang, China). The poplar flour and bamboo flour were ground to an average particle size of less than 40-mesh (400μ) and stored in an air-tight container at room temperature until used.2.2 Composition of poplar and bamboo
The samples (300 mg) were hydrolyzed with 3 mL of 72% sulfuric acid and incubated for 1 h at 30 °C with stirring every 10 min. The solution was then diluted to 4% sulfuric acid by adding 84 mL of deionized water. The mixture was autoclaved for 1 h at 121 °C. After the autoclave treatment, the solution was cooled and the suspended solids were removed by filtration. The filtrate was used to determine the carbohydrate content using high-performance liquid chromatography (HPLC, Agilent 1100, America). The cellulose and xylan contents were calculated from glucose and xylose contents multiplied by conversion factors of 0.90 and 0.88, respectively.15 The filtrate of the acid-soluble lignin content from poplar was estimated by measuring the absorbance at 240 nm using UV-mini-1240 spectrometer (SHIMADZU). The filtered solids were dried at 105 °C until constant weight. Then the sample was burnt at 575 °C to determine the inorganic ash content. This ash is subtracted from 105 °C dried solids weight to obtain the acid insoluble lignin.153. Methods
3.1 Synthesis of ionic liquids
Pyridine (0.3 mol) and hydrochloric acid (0.3 mol) were added into a 100 mL round bottom flask and stirred under mechanical agitation at room temperature for 24 h. The resulting mixture was washed with diethyl ether (20 mL ×3). Solvent residue was then evaporated using a rotary evaporator at 50 °C for 30 min. The resulting product was further vacuum-dried at 60 °C for 24 h to give [Hpy]Cl. The synthesis of 1-H-3-methy-limidazolium chloride ([Hmim]Cl) and N-methyl-2-pyrrolidonium chloride ([Hnmp]Cl) followed protocols similar to those used for [Hpy]Cl.163.2 Pretreatment of lignocellulose
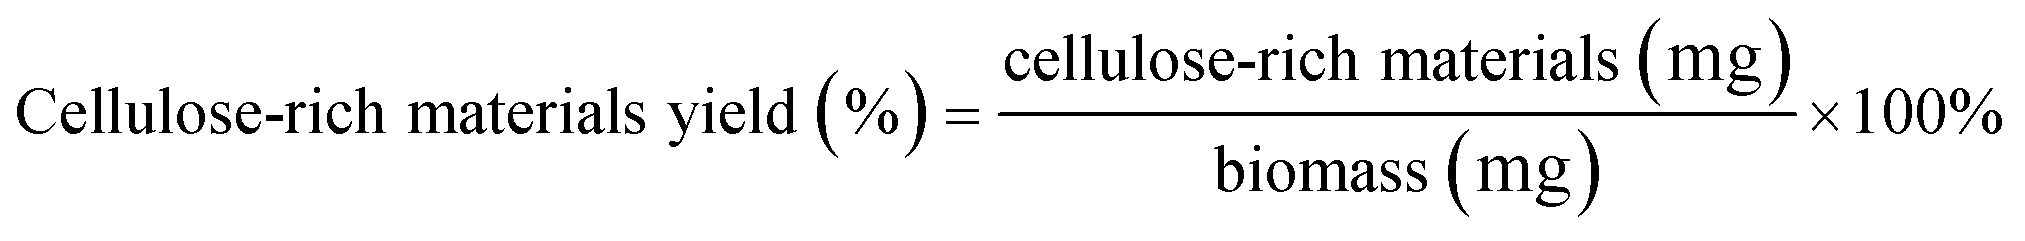
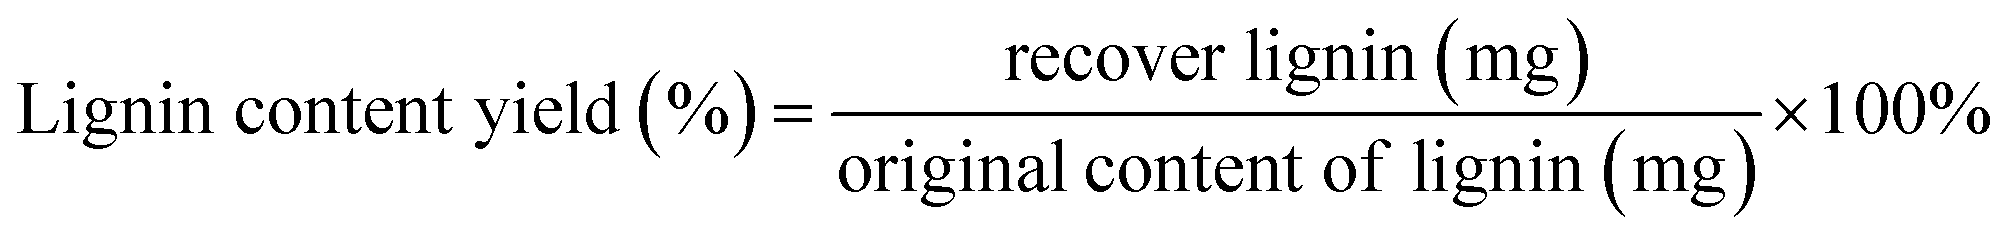
Poplar or bamboo flour (0.4 g) was added to 8 g of the ionic liquid. The mixture was stirred at 90 °C or 100 °C for 30 min. An acetone/deionized water (1/1, v/v) solution (30 mL) was then added into the ionic liquid mixture. The resulting solid was filtered, washed with 30 mL of acetone/deionized water (1/1, v/v), and dried under a vacuum at 60 °C for 24 h to yield cellulose-rich materials. Acetone was then removed from the filtrate by rotary evaporation. The resulting product was filtered, further washed with 20 mL of deionized water, and vacuum-dried at 60 °C for 24 h to yield regenerated lignin. The yields of the cellulose-rich materials and extracted lignin were calculated according to eqn (1) and (2), respectively. The ionic liquid was recycled and concentrated for reuse.
 | (1) |
 | (2) |
3.3 Fourier transform infrared (FTIR) analysis
FTIR analysis was performed on a FTIR spectrophotometer (Bruker ALPHA-T, Karlsruhe, Germany). The operating system used was Spectrum software (OPUS 6.5, Bruker Optics, Karlsruhe, Germany). Approximately 0.5 mg of the sample was mixed with KBr. The sample was then placed in a press and pressed with 16 tons of pressure for 2 min. The FTIR spectra were recorded for the pellets over the 4000 cm−1 to 400 cm−1 region, with a total of 16 scans and a resolution of 4 cm−1. The FTIR spectra were recorded using a blank KBr pellet as the background.3.4 Scanning electron microscopy (SEM)
SEM images were taken for both untreated and pretreated poplar and bamboo solids using a Hitachi S-3400N microscope. Prior to acquiring images, the samples were mounted with double sided carbon tape on precut brass sample stubs and sputter coated with approximately 30 angstrom of Au/Pd. The representative images of ionic liquid-pretreated poplar and bamboo were acquired with a 5 kV accelerating voltage.3.5 X-ray diffractometry
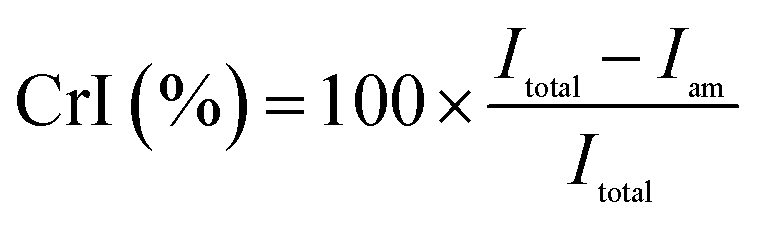
X-ray diffractometry was conducted on D/max-2500PC diffractometer (Japan) equipped with Cu Kα radiation over the range of 5−60° with a step of 4° at 40 kV and 100 mA. The crystallinity, as expressed by the crystallinity index (CrI), was determined by Segal method.17 The following empirical equation was adopted to estimate the crystallinity index:
 | (3) |
In which Itotal is the scattered intensity at the main peaks, whereas Iam is the scattered intensity due to the amorphous portion.18
3.6 Enzymatic hydrolysis
Enzymatic hydrolysis was performed with a biomass loading of 1% (g mL−1) and 0.02 g of cellulase in 0.1 M sodium citrate buffer (pH 4.8) on a shaker at 150 rpm, 50 °C for 72 h. After that time, the mixture was heated at 100 °C for 10 min. The reducing sugars were measured by the DNS method.19 The yields of glucose, xylose and cellobiose were measured by HPLC and calculated according to eqn (4).
 | (4) |
3.7 Nuclear magnetic resonance (NMR) analysis
1H–13C correlation 2D NMR heteronuclear single quantum correlation spectra were recorded on a Bruker AV-III 400 MHz spectrometer (ShangHai, China) at 25 °C. A mixture of DMSO-d6/pyrimidine (4![[thin space (1/6-em)]](https://www.rsc.org/images/entities/char_2009.gif) :1, v/v) was used as the solvent for sample handing.20
:1, v/v) was used as the solvent for sample handing.20
4. Results and discussion
The composition of the poplar and bamboo was analyzed using the National Renewable Energy Laboratory standard procedure.15 Poplar consisted of 42.5% cellulose, 10.0% hemicelluloses, and 23.5% lignin. Bamboo contained 36.3% cellulose, 12.6% hemicelluloses, and 30.6% lignin.4.1 Determination of lignin
Higher pretreatment temperatures accelerated the swelling and dissolution rates of lignocelluloses in ILs.21,22 Higher temperatures could effectively disrupt the recalcitrant structure of lignocelluloses to release lignin. Vo et al.23 demonstrated that milled poplar could be dissolved in 1-ethyl-3-methylimidazolium acetate ([Bmim]Ac) at 130 °C for 12 h; the procedure yielded 31.9% of the original lignin. With lower pretreatment temperatures, longer times were required for efficient lignin extractions of biomasses. Xu et al.24 reported that rice straw pretreated with 1-ethyl-3-methylimidazolium phosphinate ([Emim][H2PO2]), [Emim]Ac, and [Emim]Cl at 110 °C for 24 h resulted in lignin extraction rates of 55.6%, 47.8%, and 14.6%, respectively, when determined from the UV-vis absorbance at 280 nm. Compared with current studies (Table 1), a low pretreatment temperature and a short time were used in this work.| Ionic liquid | Biomass | Temp. (°C) | Time (h) | Biomass mass/ILs mass (%) | Lignin extraction yield (%) | Ref. |
|---|---|---|---|---|---|---|
| [Emim]Cl | Triticale straw | 150 | 1.5 | 5 (w/w) | 29 | 28 |
| [C4C1im]Cl | Legume straw | 150 | 2 | 5 (w/w) | 30 | 8 |
| [Emim]Ac | Triticale straw | 130 | 1.5 | 5 (w/w) | 41 | 7 |
| [Emim]Ac | Poplar | 130 | 12 | 5 (w/w) | 31.90 | 26 |
| [Emim]Ac | Poplar | 125 | 1 | 33.3 (w/w) | 10.1 | 27 |
| [Bmim]Ac/H2O | Willow | 120 | 22 | 10 (w/v) | 46.7 | 29 |
| [Emim]Ac | Southern yellow pine | 110 | 16 | 5 (w/w) | 31.4 | 30 |
| [Emim]Ac | Maple wood flour | 90 | 24 | 5 (w/w) | 37 | 31 |
| [Hpy]Cl | Poplar | 100 | 0.5 | 5 (w/w) | 61.0 | |
| [Hmim]Cl | Poplar | 100 | 0.5 | 5 (w/w) | 60.4 | |
| [Hpy]Cl | Bamboo | 100 | 0.5 | 5 (w/w) | 51.7 | |
| [Hnmp]Cl | Bamboo | 100 | 0.5 | 5 (w/w) | 50.3 |
In this study, the yield of the lignin extracted was calculated according to eqn (2). As the temperature increased from 90 °C to 100 °C (Fig. 1), lignin regeneration improved from 51.3% to 61.0% with [Hpy]Cl-treatment. Lignin yield improved from 49.3% to 60.4% with [Hmim]Cl-treatment, and the yield improved from 38.7% to 47.9% with [Hnmp]Cl-treatment. Thus, high lignin yields of 61.0% and 60.4% were achieved when the poplar was pretreated at 100 °C for 30 min with [Hpy]Cl and [Hmim]Cl, respectively.
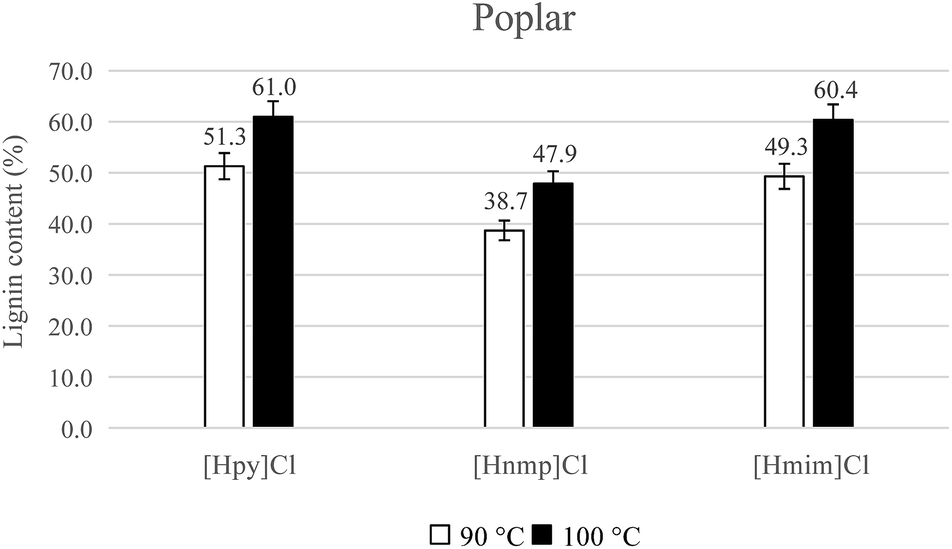 | ||
| Fig. 1 The extracted lignin content from poplar. | ||
In addition, as the temperature increased from 90 °C to 100 °C, lignin regeneration improved from 42.6% to 51.7% with [Hpy]Cl-treatment. Lignin yield improved from 26.6% to 50.3% with [Hnmp]Cl-treatment, and the yield improved from 39.9% to 43.7% with [Hmim]Cl-treatment. Thus, high lignin yields of 51.7% and 50.3% were obtained from bamboo treated with [Hpy]Cl and [Hnmp]Cl, respectively (Fig. 2).
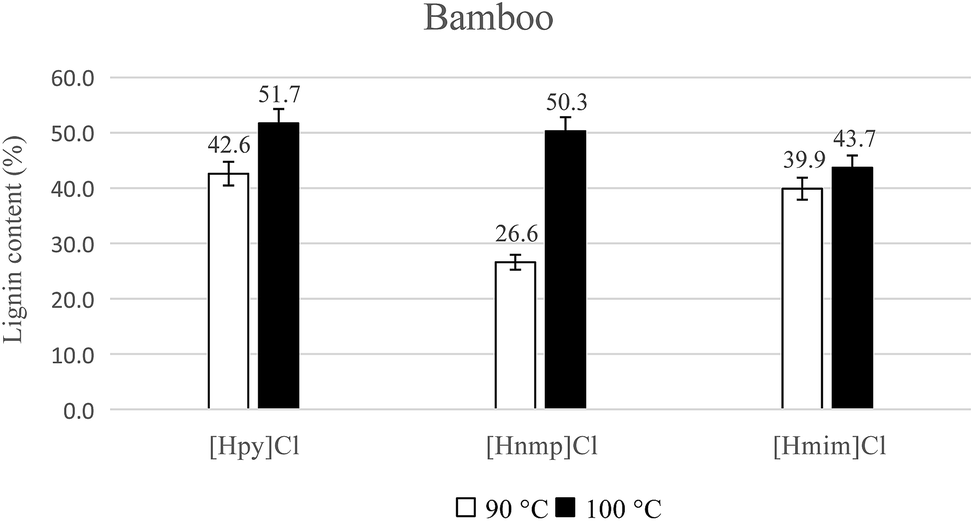 | ||
| Fig. 2 The extracted lignin content from bamboo. | ||
The degree of biomass recalcitrance varies among the biomass species. Fort et al.25 proposed that wood type and species affected the dissolution ability. In this study, lignin yields of 38.7% to 61.0% were obtained from poplar, and lignin yields of 26.6% to 51.7% were extracted from bamboo. A lower lignin yield was recovered from bamboo due to its recalcitrant structure. Although ball milling of bamboo for 72 h before IL-pretreatment was required,12 the milling process was not employed when using these ILs in this work.
When compared to contemporary studies, a low pretreatment temperature and a short processing time were employed using these ionic liquids, they resulted in obtaining high lignin yield (Table 1). For example, 31.90% of the lignin was extracted from poplar in [Emim]Ac at 130 °C for 12 h.26 Poplar pretreated with [Emim]Ac for 1 h at 125 °C resulted in 10.1% lignin removal.27 In this work, more than 60% lignin removal was achieved from poplar with [Hpy]Cl and [Hmim]Cl at 100 °C for 30 min.
4.2 Determination of cellulose-rich materials
The yields of cellulose-rich materials were calculated according to eqn (1). As shown in Fig. 3 and 4, when the temperature increased from 90 °C to 100 °C, the yield of cellulose-rich materials decreased from 59.7% to 37.1% for poplar with [Hpy]Cl-treatment (Fig. 3). When the temperature increased from 90 °C to 100 °C, the yield of cellulose-rich materials decreased from 76.1% to 53.0% for bamboo with [Hnmp]Cl-pretreatment (Fig. 4). Increased temperatures resulted in the efficient lignin extraction and the reduced yields of cellulose-rich materials.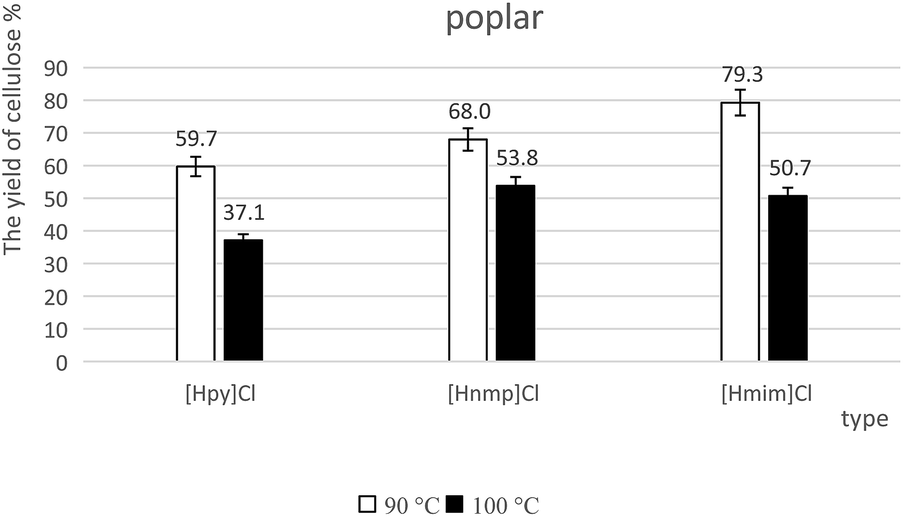 | ||
| Fig. 3 The yields of cellulose-rich materials from poplar. | ||
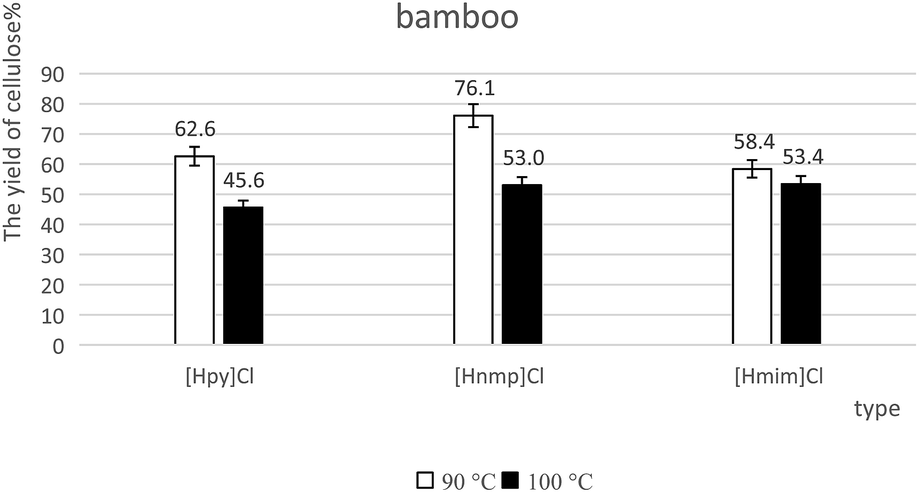 | ||
| Fig. 4 The yields of cellulose-rich materials from bamboo. | ||
4.3 FTIR analysis of cellulose-rich materials from lignocelluloses
The FTIR spectra of cellulose-rich materials from poplar are illustrated in Fig. 5. The absorbances at 3427, 2923, 1433, 1378, 1334, 1163, 1108, 1057, and 889 cm−1 are associated with cellulose. Typically, the absorption at 3427 cm−1 is associated with the O–H stretching. The peak at 2923 cm−1 is attributed to C–H stretching. A peak at 1433 cm−1 is related to CH2 symmetric bending. The absorbance at 1378 cm−1 is related to CH bending. The peak at 1334 cm−1 is related to the CH2 bending of the carbohydrates, whereas the 1163 cm−1 peak is attributed to C–O antisymmetric stretching. The absorbance at 1111 cm−1 is related to C–OH skeletal vibration, and the absorbance at 1053 cm−1 is due to the C–O–C pyranose ring skeletal vibration. The peak at 889 cm−1 corresponds to the glycosidic C1–H deformation with ring vibration contribution, which is a characteristic of the β-glycosidic linkages between glucose monomers in cellulose.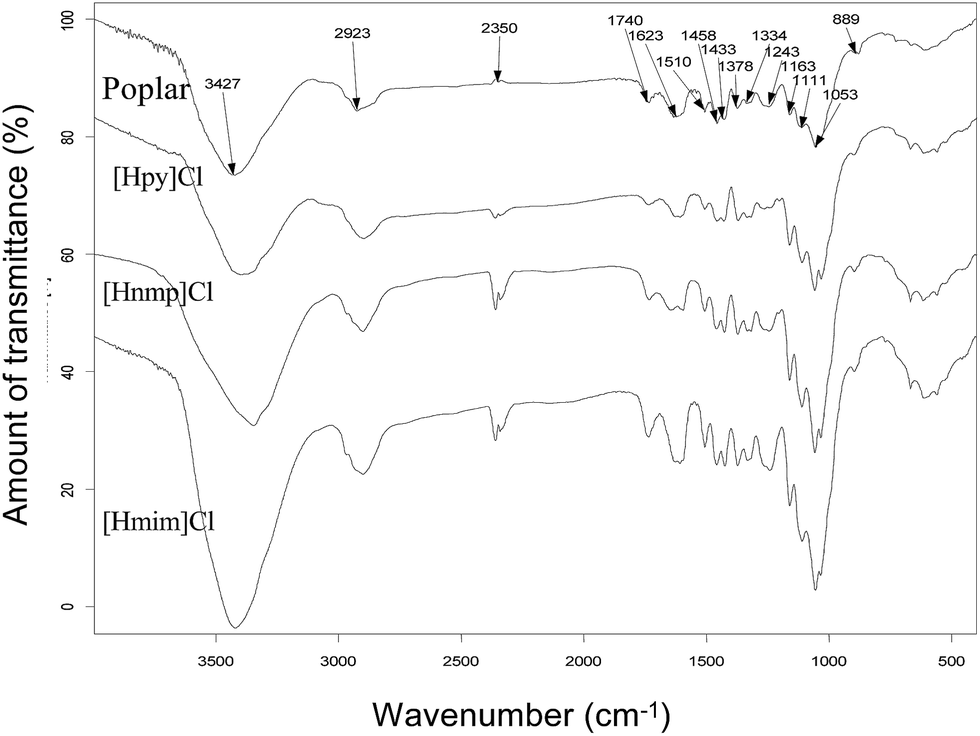 | ||
| Fig. 5 FTIR spectra of cellulose-rich materials from poplar at 90 °C. | ||
The FTIR spectra of cellulose-rich materials from bamboo are illustrated in Fig. 6. The absorbance at 3442, 2912, 1458, 1371, 1327, 1166, 1049, and 900 cm−1 are associated with cellulose. Typically, the absorption at 3427 cm−1 is associated with the O–H stretching. The 2912 cm−1 peak is attributed to C–H stretching. A peak at 1422 cm−1 is related to CH2 symmetric bending, whereas the 1371 cm−1 peak is related to CH bending. The absorbance at 1327 cm−1 is related to CH2 bending of carbohydrates. The 1166 cm−1 peak is attributed to C–O antisymmetric stretching. The 1111 cm−1 absorbance is related to C–OH skeletal vibration, whereas the 1049 cm−1 absorbance is attributed to the C–O–C pyranose ring skeletal vibration. The peak at 900 cm−1 is related to the glycosidic C1–H deformation with ring vibration contribution.
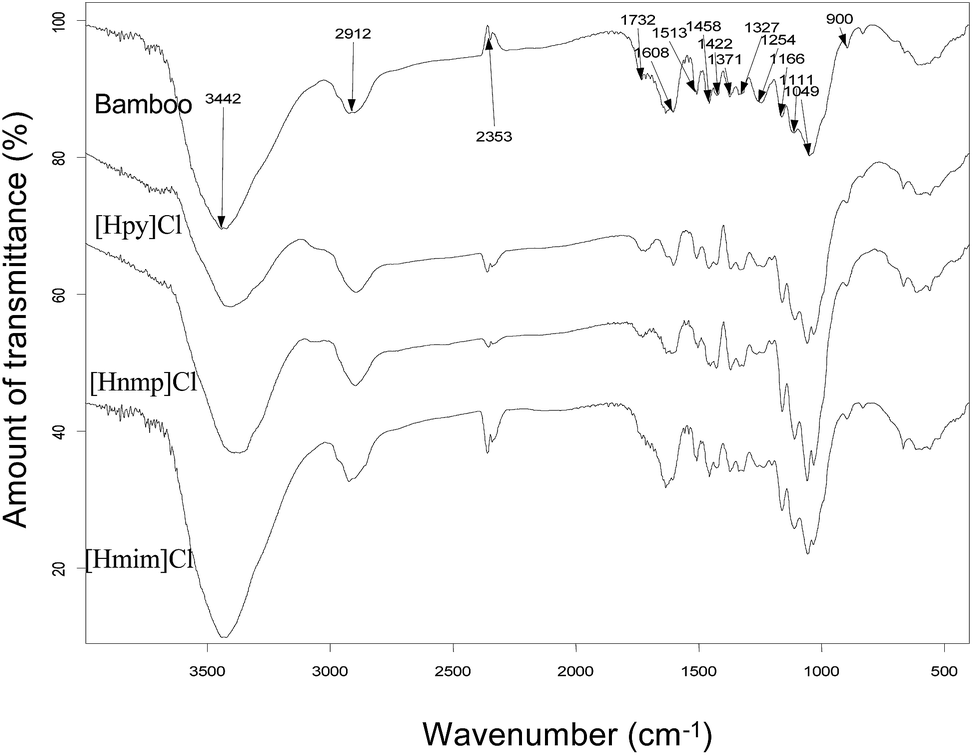 | ||
| Fig. 6 FTIR spectra of cellulose-rich materials from bamboo at 90 °C. | ||
4.4 FTIR analysis of lignin from poplar
The peaks at 3423, 2938, 1710, 1601, 1510, 1462, 1426, 1331, 1272, 1225, 1126, 1035, and 830 cm−1 are associated with IL-extracted lignin from poplar (Fig. 7). Typically, the peaks at 1601 cm−1 and 1510 cm−1 are attributed to the aromatic skeletal vibrations. The peak at 1462 cm−1 is related to C–H deformations. The peak at 1426 cm−1 is associated with aromatic skeletal vibrations combined with C–H in-plane deformation. The peak at 1331 cm−1 is related to syringyl unit (S) vibration breathing with C![[double bond, length as m-dash]](https://www.rsc.org/images/entities/char_e001.gif) O stretching and to condensed guaiacyl unit (G) rings. The peak at 1272 cm−1 is related to G ring breathing with carbonyl stretching. The peak at 1225 cm−1 is associated with C–C, C–O, and CO stretching. The peak at 1126 cm−1 is attributed to ether. The peak at 1035 cm−1 is associated with aromatic C–H in-plane deformation and with C–O deformation in primary alcohols, as well as CO stretching. The peak at 830 cm−1 is C–H out-of-plane deformation of S rings.32
O stretching and to condensed guaiacyl unit (G) rings. The peak at 1272 cm−1 is related to G ring breathing with carbonyl stretching. The peak at 1225 cm−1 is associated with C–C, C–O, and CO stretching. The peak at 1126 cm−1 is attributed to ether. The peak at 1035 cm−1 is associated with aromatic C–H in-plane deformation and with C–O deformation in primary alcohols, as well as CO stretching. The peak at 830 cm−1 is C–H out-of-plane deformation of S rings.32
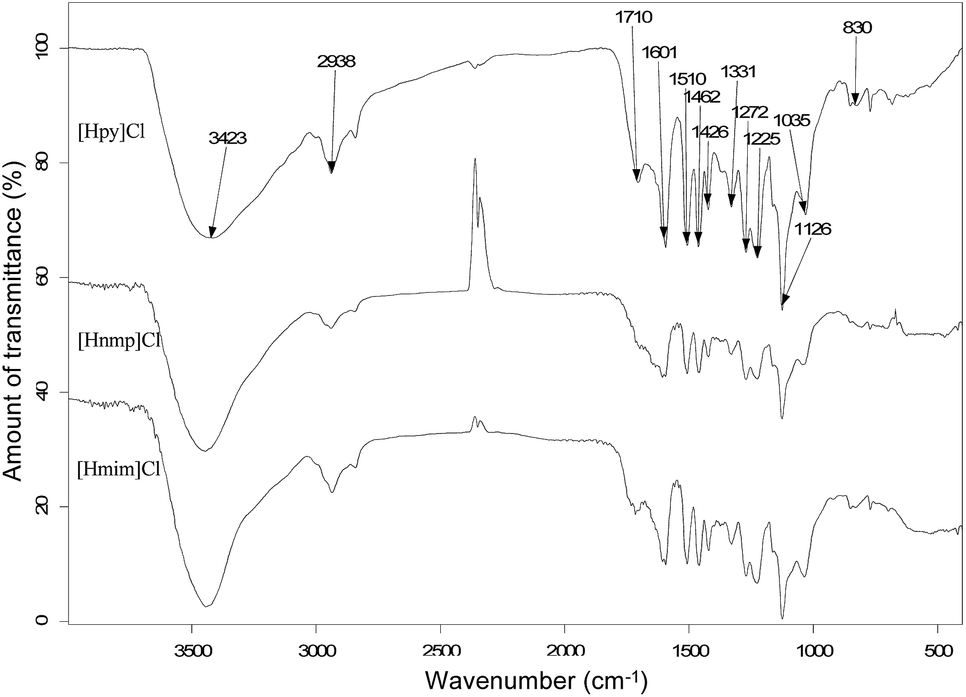 | ||
| Fig. 7 FTIR spectra of IL-extracted lignin from poplar at 90 °C. | ||
4.5 FTIR analysis of lignin from bamboo
The peaks at 3431, 2938, 1703, 1605, 1513, 1462, 1426, 1331, 1225, 1166, 1126, 1035, and 834 cm−1 are attributed to alkali lignin (Fig. 8). Typically, the peaks at 1605 cm−1, 1513 cm−1, and 1426 cm−1 are attributed to aromatic skeletal vibrations. Similarly, the peak at 1462 cm−1 is the result of C–H deformations. The peak at 1331 cm−1 is related to syringyl unit (S) vibrations. The peak at 1225 cm−1 is from C–C, C–O, and CO stretching.33 The peak at 1125 cm−1 is attributed to ether-O–. The peak at 1035 cm−1 is associated with aromatic C–H in-plane deformation. The peak at 834 cm−1 is associated with C–H out-of-plane deformation of S rings.
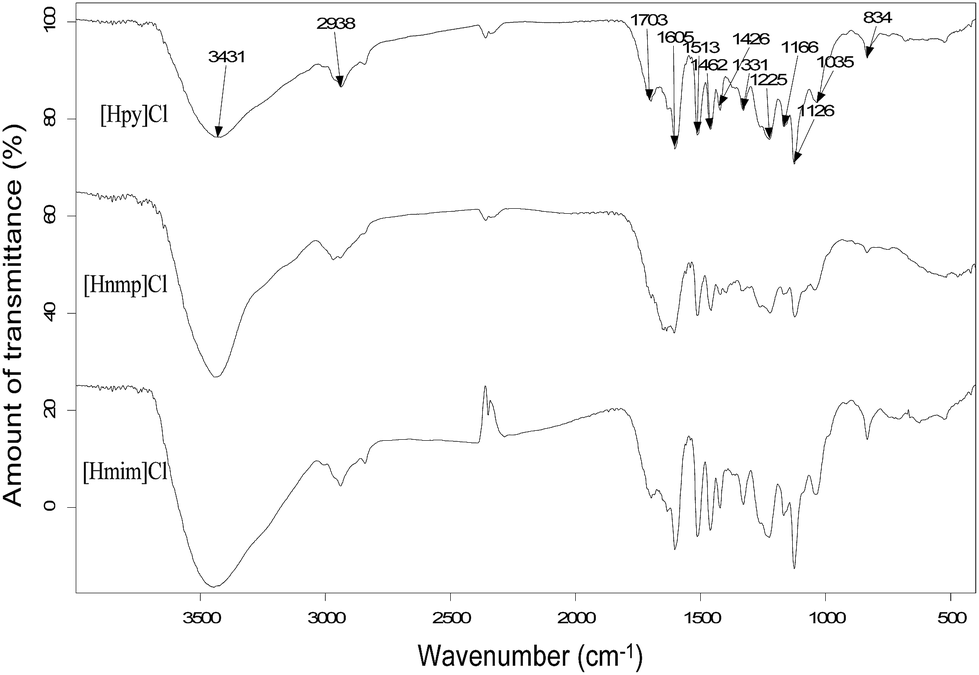 | ||
| Fig. 8 FTIR spectra of IL-extracted lignin from bamboo at 90 °C. | ||
Furthermore, the intensity of the peak at 1710 cm−1 was strong in the spectra with [Hpy]Cl and [Hmim]Cl pretreatments for bamboo, but weak in the spectra with [Hnmp]Cl pretreatment. This peak was associated with CO stretching that indicated hydroxycinnamates, for example, ferulate. Ferulate esterified with an arabinosyl unit in hemicelluloses was attached to lignin with an ether bond to form a carbohydrates–ferulate–lignin bridge structure. With [Hnmp]Cl pretreatment, lignin containing the bridge structure could not be dissolved in acetone/water, resulting in the decreased content of ferulate in lignin fraction.33
Comparisons of the FTIR spectra of poplar with that of bamboo showed some slight differences, for instance, the peak at 1272 cm−1 that was associated with G ring breathing with carbonyl stretching. This peak was prominent in poplar lignin indicating more G unit than bamboo lignin.
4.6 Scanning electron microscopy analysis
The structural changes in morphology of the lignocellusic biomass before and after IL-pretreatment were analyzed by SEM. As shown in Fig. 9, the original untreated lignocelluloses had the compact ordered and rigid fibril structures, however, the significant morphological modification for both of the bamboo and poplar was observed after ionic liquids pretreatment. Specifically, for poplar, the structure was loosened and less compact after [Hpy]Cl pretreatment. For bamboo, the surface of the residue become irregular after [Hmim]Cl treatment. The alteration of morphology indicated the disruption of linkages in lignocellulose during IL-pretreatment, providing a more accessible surface to cellulose, leading to enhanced enzymatic digestibility.8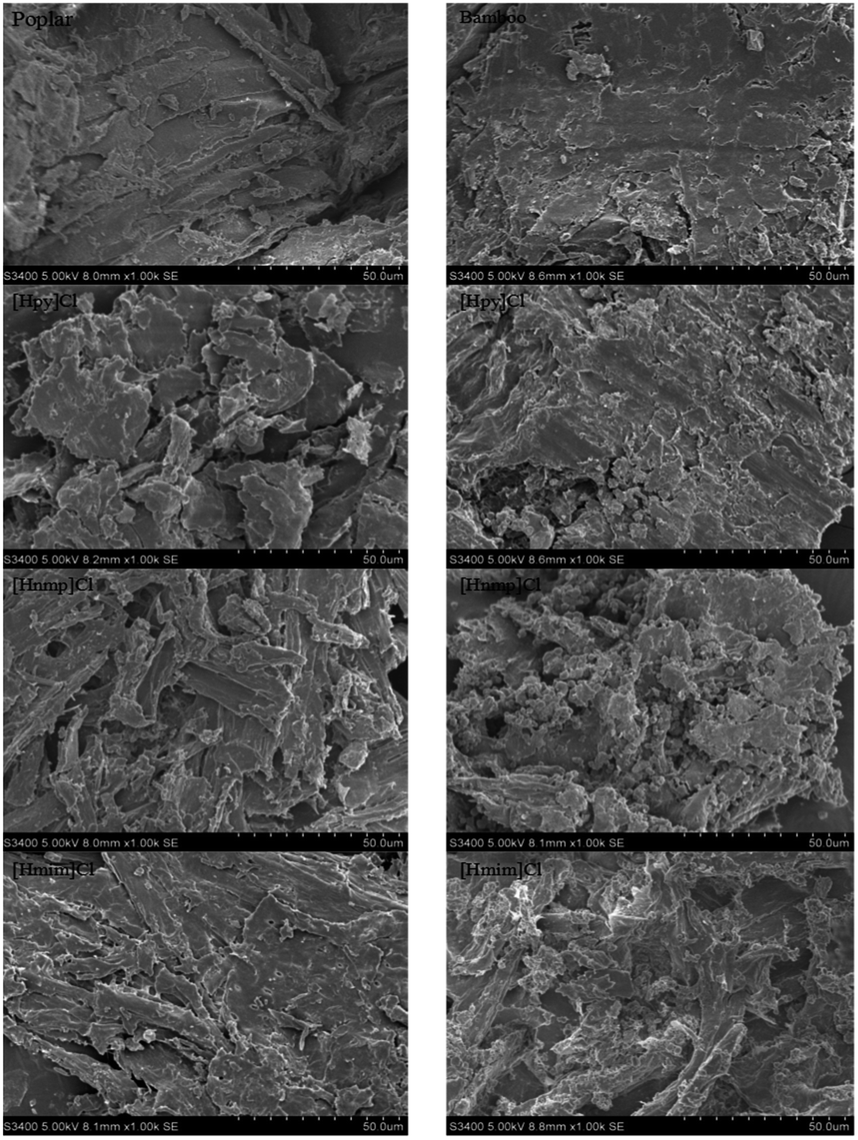 | ||
| Fig. 9 SEM analysis of untreated and IL-pretreated poplar and bamboo. | ||
4.7 X-ray diffraction analysis
The untreated and pretreated cellulose-rich materials of poplar and bamboo were determined by X-ray diffraction and the results were shown in Fig. 10 and 11.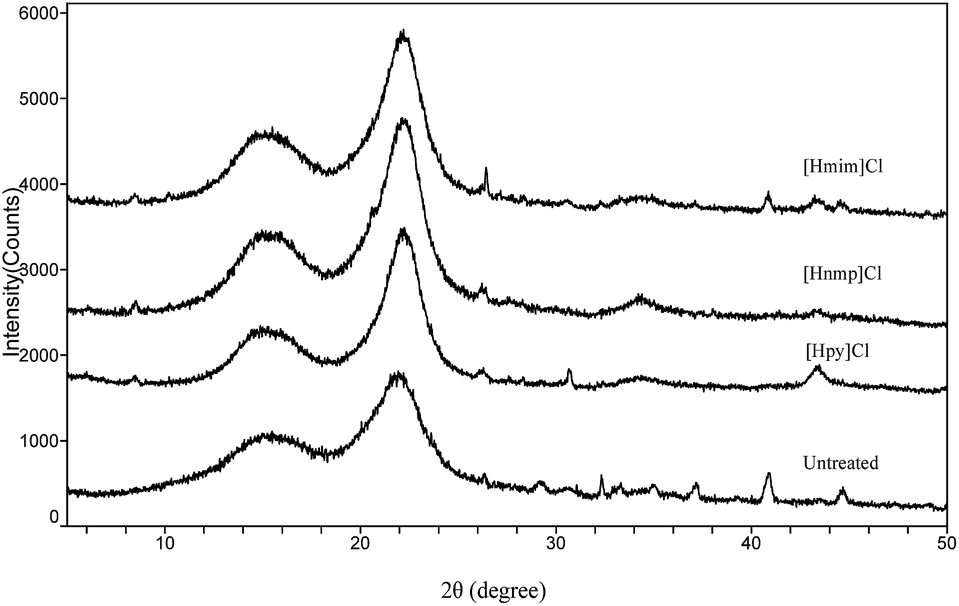 | ||
| Fig. 10 XRD analysis of untreated poplar and the cellulose-rich materials. | ||
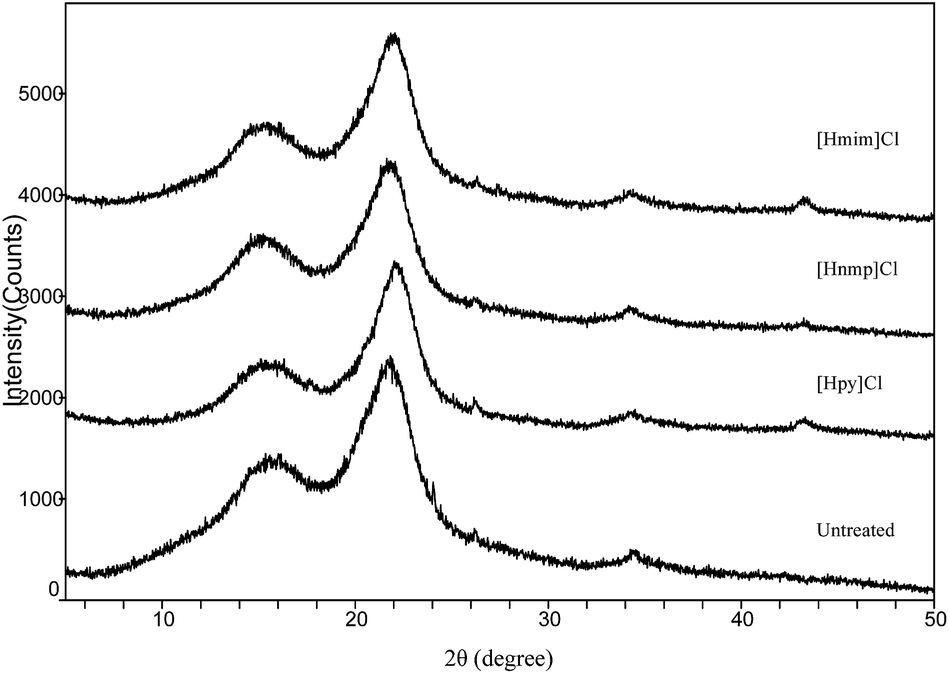 | ||
| Fig. 11 XRD analysis of untreated bamboo and the cellulose-rich material. | ||
For poplar and bamboo, all samples showed major intensive peaks related to their crystalline structures at 2θ values of around 15.5° and 22.2°, indicating that the crystallinity of the samples were not significantly changed by IL pretreatment.34 The peak intensities of the IL treated samples were slightly increased compared to those of the untreated samples, which was consistent with the current reports.35 The cellulose-rich material crystal structure was unaffected by delignification, but the CrI of the biomass was increased owing to lignin removal.36 In addition, the peaks around 2θ = 15.5° and 22.2° were sharper for the IL pretreated poplar and bamboo, which were typical peak for the cellulose I.37
4.8 Enzymatic hydrolysis
The results of enzymatic hydrolysis of original biomass and IL-treated biomass are summarized in Tables 2 and 3. After 72 h, high yields of glucose, cellobiose and xylose were 67.5%, 4.2% and 10.4%, respectively, pretreated by [Hpy]Cl from poplar at 90 °C for 30 min. Good yields of glucose, cellobiose and xylose were 65.5%, 7.1% and 11.8% in [Hmim]Cl-treated bamboo sample at 90 °C for 30 min, respectively.| Biomass pretreated | Glucose (%) | Cellobiose (%) | Xylose (%) | |||
|---|---|---|---|---|---|---|
| Ave (%) | Std. | Ave (%) | Std. | Ave (%) | Std. | |
| Poplar | 46.4 | 0.37 | 5.5 | 0.89 | 7.3 | 1.24 |
| [Hpy]Cl | 67.5 | 1.42 | 4.2 | 1.07 | 10.4 | 0.60 |
| [Hnmp]Cl | 62.3 | 0.86 | 3.6 | 1.23 | 8.1 | 0.77 |
| [Hmim]Cl | 62.0 | 0.94 | 3.1 | 0.42 | 8.0 | 1.19 |
| Biomass pretreated | Glucose (%) | Cellobiose (%) | Xylose (%) | |||
|---|---|---|---|---|---|---|
| Ave (%) | Std. | Ave (%) | Std. | Ave (%) | Std. | |
| Bamboo | 42.0 | 0.55 | 4.5 | 0.41 | 8.4 | 0.34 |
| [Hpy]Cl | 63.5 | 0.94 | 2.2 | 0.73 | 8.0 | 0.68 |
| [Hnmp]Cl | 60.8 | 0.53 | 2.5 | 1.12 | 8.4 | 0.90 |
| [Hmim]Cl | 65.5 | 1.03 | 7.1 | 0.41 | 11.8 | 1.09 |
The capability of ionic liquids could destruct the link of lignocelluloses and then to remove the lignin content effectively. The significantly reduction lignin resulted in the high enzyme digestibility of cellulose. The reduced lignin in cellulose-rich materials were also confirmed by FTIR analysis. Moreover, SEM image showed the significant structural changes in morphology, which released a large area on the fiber surface, consequently improving the accessibility of cellulose and the enzymatic efficiency. Ionic liquids pretreatment in this work contributed to achieve the high yield of IL-isolated lignin and the high enzymatic digestibility of cellulose.
4.9 HSQC NMR analysis
The IL-extracted lignin was analyzed by 2D 1H–13C HSQC (Heteronuclear Single Quantum Correlation) NMR. As shown in Fig. 12, the signals at 56.139/3.731 ppm, 115.670/6.860 ppm, 123.920/7.342 ppm, 136.214/7.746 ppm, and 149.965/8.594 ppm are associated with poplar lignin. In general, the signal at 56.139/3.731 ppm is from methoxyl groups (MeO) in the aliphatic region. The aromatic region of lignin is from 100 ppm to 155 ppm. Typically, a signal at 115.670/6.860 ppm is from C5–H5 in guaiacyl units (G). A signal at 123.920/7.342 ppm is associated with ferulate groups (FA). However, no signal is observed in the region from 60 ppm to 100 ppm, which is generally associated with polysaccharides.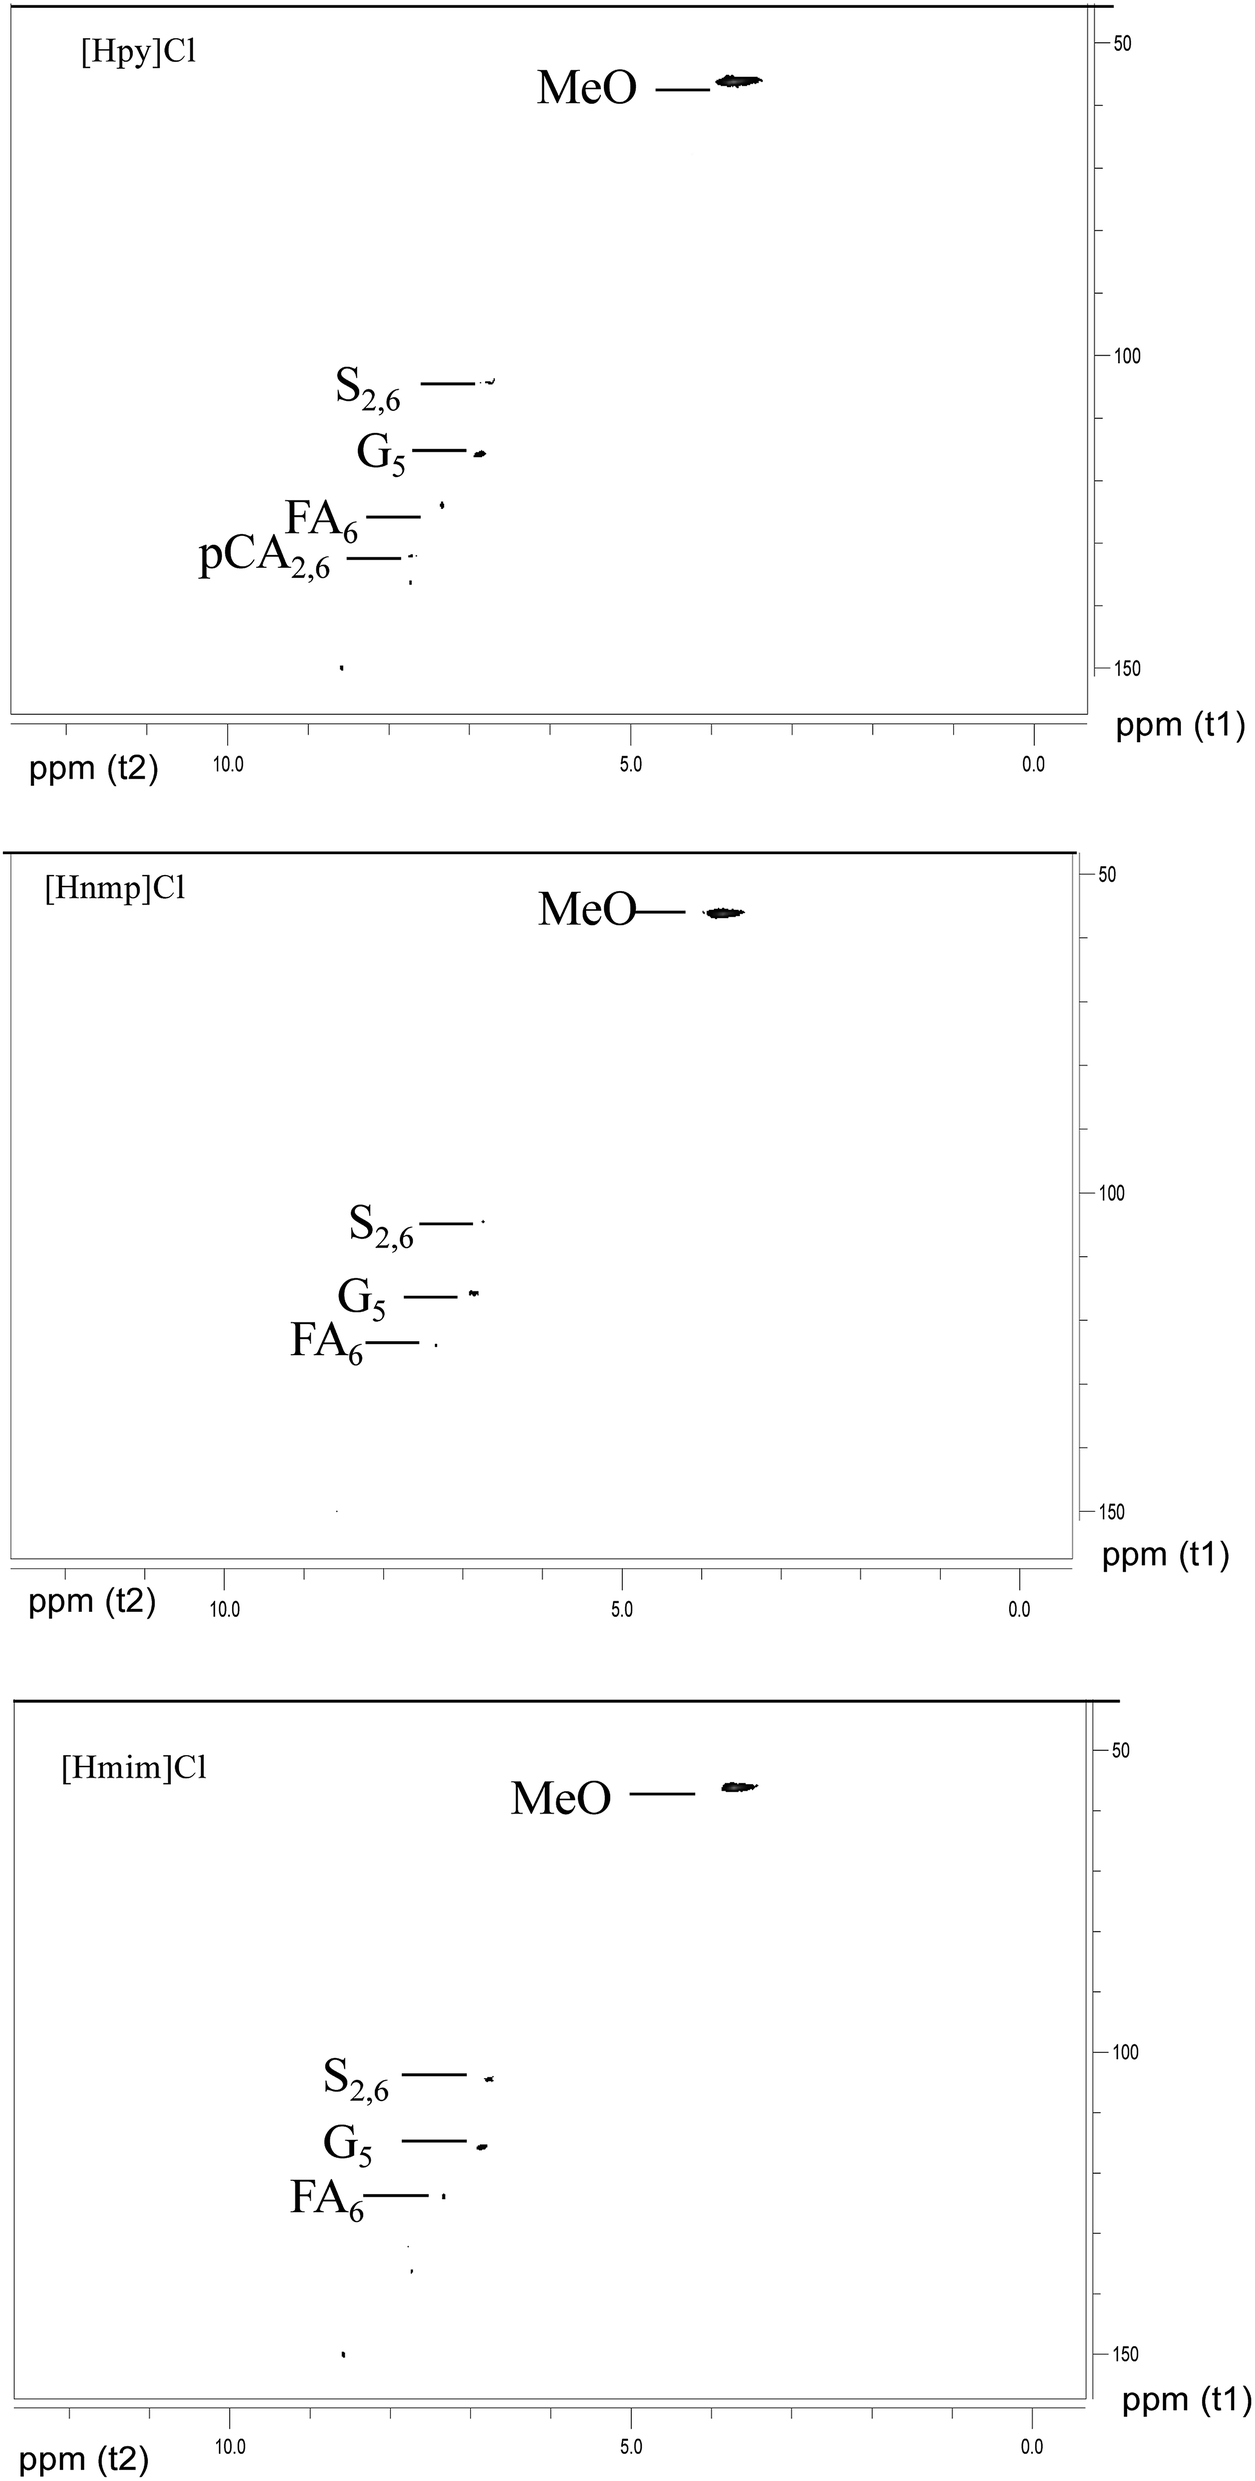 | ||
| Fig. 12 2D-NMR (HSQC) spectra of IL-extracted lignin from poplar. | ||
As shown in Fig. 13, the signals at 56.139/3.731 ppm, 104.508/6.794 ppm, 104.508/6.794 ppm, 116.155/6.860 ppm, 123.920/7.342 ppm, 130.714/7.498 ppm, 136.376/7.746 ppm, and 149.965/8.594 ppm are associated with bamboo lignin. The signal at 56.139/3.731 ppm is from methoxyl groups (MeO) in the aliphatic region.38 A signal at 104.508/6.794 ppm is associated with C2/6–H2/6 in etherified syringyl units (S). The signal at 116.155/6.860 ppm is from guaiacyl units (G). A signal at 123.920/7.342 ppm is associated with ferulate groups (FA).39 A signal at 130.662/7.509 ppm is associated with p-coumarate groups (PCA).
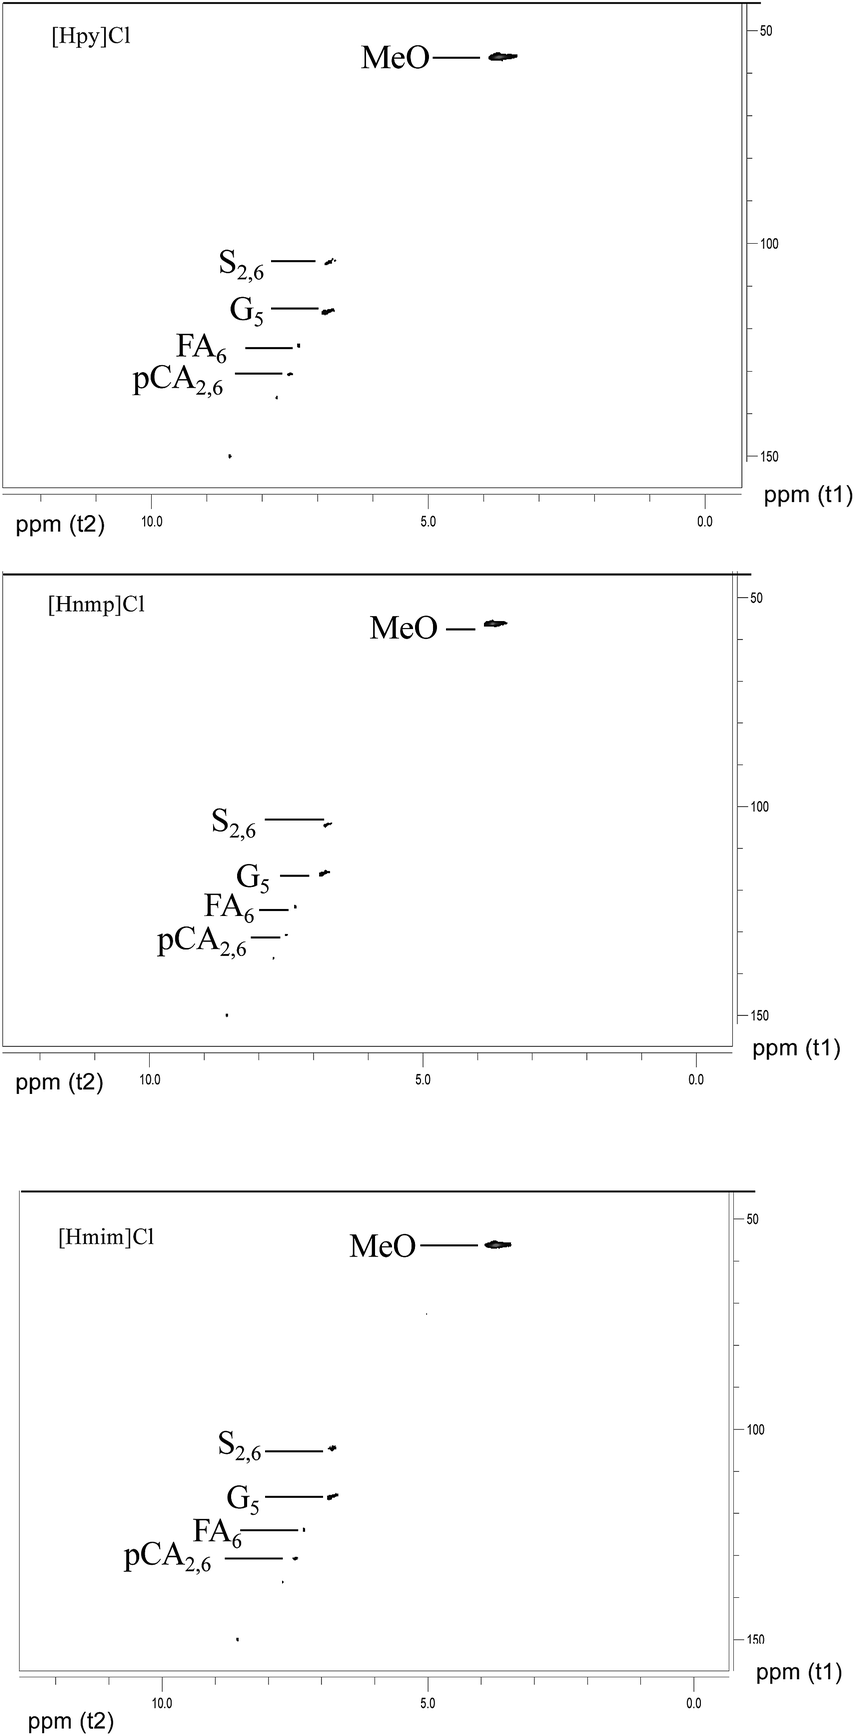 | ||
| Fig. 13 2D-NMR (HSQC) spectra of IL-extracted lignin from bamboo. | ||
5. Conclusions
In this study, ionic liquids were prepared via one-step synthesis as compared to other ILs reported in literature that required a two-step synthesis route. These ILs worked efficiently at a relatively low temperature of 90 °C and 100 °C and a short processing time of 30 min for the pretreatment of lignocellulosic biomass.These ionic liquids appeared to be more efficient at disruption of inter- and intra-molecular hydrogen bonding in the biopolymers comprising these biomasses. Ionic liquids interact with and solvate the aromatic moieties of lignin through π–π and n–π interactions between the aromatic rings and the cations of the IL. Lignin extraction yields of 61.0% and 60.4% from poplar were achieved with [Hnmp]Cl and [Hmim]Cl pretreatments, respectively. Lignin extraction yields of 51.7% and 50.3% from bamboo were obtained with [Hpy]Cl and [Hmim]Cl pretreatments, respectively.
The significantly decreased lignin content resulted in the high enzyme digestibility of cellulose. Additionally, the significant structural changes in morphology increased the accessibility of cellulase and then improved the enzymatic efficiency. The original fibrous structure was significantly disorder by IL-pretreatment, which released a large area on the fiber surface, consequently improving the accessibility of cellulose and the enzymatic efficiency. Poplar with [Hpy]Cl pretreatment resulted in 67.5% glucose, 4.2% cellobiose and 10.4% xylose. Bamboo with [Hmim]Cl pretreatment resulted in 65.5% glucose, 7.1% cellobiose and 11.8% xylose after enzymatic hydrolysis.
[Hnmp]Cl, [Hpy]Cl, and [Hmim]Cl were found to be very effective at lignin extraction and enzymatic saccharification for lignocellulosic biomass.
Supplementary data
Pyridinium chloride ([Hpy]Cl)
1H-NMR (400 MHz, DMSO-d6) (ppm): 8.135 (t, 2H, pyridinium ring), 8.684 (t, 1H, pyridinium ring), 9.019 (d, 2H, pyridinium ring), and 12.357 (s, 1H, N–H).13C-NMR (400 MHz, DMSO-d6) (ppm): 127.657 (s, 2C, pyridinium ring), 141.222 (s, 2C, pyridinium ring), and 146.803 (s, 1C, pyridinium ring).
N-Methyl-2-pyrrolidonium chloride ([Hnmp]Cl)
1H-NMR (400 MHz, DMSO-d6) (ppm): 1.831 (q, 2H, pyrrolidonium ring), 2.147 (t, 2H, pyrrolidonium ring), 2.633 (s, 3H, –CH3), 3.255 (t, 2H, pyrrolidonium ring), and 13.511 (s, 1H, N–H).13C-NMR (400 MHz, DMSO-d6) (ppm): 17.582 (s, 1C, pyrrolidonium ring), 29.530 (s, 1C, –CH3), 30.463 (s, 1C, pyrrolidonium ring), 49.153 (s, 1C, pyrrolidonium ring), and 174.474 (s, 1C, pyrrolidonium ring).
1-H-3-Methylimidazolium chloride ([Hmim]Cl)
1H-NMR (400 MHz, DMSO-d6) (ppm): 2.079 (f, 2H, –CH2–), 2.444 (t, 2H, –CH2–), 3.841 (s, 3H, –CH3), 4.290 (t, 2H, –CH2–), 7.704 (s, 1H, imidazolium ring), 7.779 (s, 1H, imidazolium ring), and 9.159 (s, 1H, imidazolium ring).13C-NMR (400 MHz, DMSO-d6) (ppm): 26.050 (s, 1C, –CH2–), 35.677 (s, 1C, –CH3), 47.309 (s, 1C, –CH2–), 47.666 (s, 1C, –CH2–), 122.246 (s, 1C, imidazolium ring), 123.538 (s, 1C, imidazolium ring), and 136.710 (s, 1C, imidazolium ring).
Conflicts of interest
There are no conflicts to declare.Acknowledgements
This work was financially supported by the National Natural Science Foundation of China (21506030).References
- S. Siankevich, Z. Fei, N. Yan and P. J. Dyson, Chimia, 2015, 69, 592–596 CrossRef CAS PubMed.
- L. Petrus and M. A. Noordermeer, Green Chem., 2007, 38, 861–867 Search PubMed.
- S. H. Lee, T. V. Doherty, R. J. Linhardt and J. S. Dordick, Biotechnol. Bioeng., 2009, 102, 1368–1376 CrossRef CAS PubMed.
- N. I. Haykir, E. Bahcegul, N. Bicak and U. Bakir, Ind. Crops Prod., 2013, 41, 430–436 CrossRef CAS.
- T. Heinze, K. Schwikal and S. Barthel, Macromol. Biosci., 2005, 5, 520–525 CrossRef CAS PubMed.
- Y. Dong, J. Holm, J. Kärkkäinen, J. Nowicki and U. Lassi, Biomass. Bioenerg., 2014, 70, 461–467 CrossRef CAS.
- D. Fu, G. Mazza and Y. Tamaki, J. Agric. Food Chem., 2010, 58, 2915–2992 CrossRef CAS PubMed.
- L. Wei, K. Li, Y. Ma and X. Hou, Ind. Crops Prod., 2012, 37, 227–234 CrossRef CAS.
- Q. Li, Y. C. He, M. Xian, G. Jun, X. Xu, J. M. Yang and L. Z. Li, Bioresour. Technol., 2009, 100, 3570–3575 CrossRef CAS PubMed.
- K. Ninomiya, K. Inoue, Y. Aomori, A. Ohnishi, C. Ogino, N. Shimizu and K. Takahashi, Chem. Eng. J., 2015, 259, 323–329 CrossRef CAS.
- C. Li, B. Knierim, C. Manisseri, R. Arora, H. V. Scheller, M. Auer, K. P. Vogel, B. A. Simmons and S. Singh, Bioresour. Technol., 2010, 101, 4900–4906 CrossRef CAS PubMed.
- D. Yang, L. X. Zhong, T. Q. Yuan, X. W. Peng and R. C. Sun, Ind. Crops Prod., 2013, 43, 141–149 CrossRef CAS.
- J. Y. Kim, E. J. Shin, I. Y. Eom, K. Won, Y. H. Kim, D. Choi, I. G. Chio and J. W. Choi, Bioresour. Technol., 2011, 102, 9020–9025 CrossRef CAS PubMed.
- J. K. Xu, Y. C. Sun and R. C. Sun, Process Biochem., 2015, 50, 955–965 CrossRef CAS.
- A. D. Sluiter, B. Hames, R. Ruiz, C. Scarlata, J. Sluiter, D. W. Templeton and D. Crocker, NREL/TP-510–42618, National Renewable Energy Laboratory, Golden, CO, 2012.
- B. X. Zhang, Y. F. Wang and X. M. Hu, Ind. Crops Prod., 2015, 76, 688–696 CrossRef.
- L. C. Segal, J. J. Creely, A. E. J. Martin and C. M. Conrad, Text. Res. J., 1959, 29, 786–794 CrossRef CAS.
- G. Cheng, P. Varanasi, C. Li, H. Liu, Y. B. Melnichenko, B. A. Simmons, M. Kent and S. Singh, Biomacromolecules, 2011, 12, 933–941 CrossRef CAS PubMed.
- G. L. Miller, Anal. Chem., 1959, 31, 175–201 Search PubMed.
- N. Sun, H. Liu, N. Sathitsuksanoh, V. Stavila, M. Sawant, A. Bonito, K. Tran, A. George, K. L. Sale, S. Singh, B. A. Simmons and B. A. Holmes, Biotechnol. Biofuels, 2013, 6, 39–52 CrossRef CAS PubMed.
- N. Sun, M. Rahman, Y. Qin, M. L. Maxim, H. Rodríguez and R. D. Rogers, Green Chem., 2009, 11, 646–655 RSC.
- X. Wang, H. Li, Y. Cao and Q. Tang, Bioresour. Technol., 2011, 102, 7959–7965 CrossRef CAS PubMed.
- H. T. Vo, C. S. Kim, B. S. Ahn, H. S. Kim and H. Lee, J. Wood Chem. Technol., 2011, 31, 89–102 CrossRef CAS.
- J. Xu, B. Wu, L. Hu, Z. Wu, N. Xu, B. L. Dai and J. He, Chem. Eng. J., 2015, 267, 163–169 CrossRef CAS.
- D. A. Fort, R. C. Remsing, R. P. Swatloski, P. Moyna, G. Moyna and R. D. Rogers, Green Chem., 2007, 9, 63–69 RSC.
- M. Lawoko, G. Henriksson and G. Gellerstedt, Holzforschung, 2006, 21, 143–165 Search PubMed.
- H. Wu, M. Mora-Pale, J. Miao, T. V. Doherty, R. J. Linhardt and J. S. Dordick, Biotechnol. Bioeng., 2011, 108, 2865–2875 CrossRef CAS PubMed.
- D. Fu and G. Mazza, Bioresour. Technol., 2011, 102, 7008–7011 CrossRef CAS PubMed.
- A. Pinkert, D. Goeke, K. N. Marsh and S. Pang, Green Chem., 2011, 13, 3124–3136 RSC.
- X. Pan, D. Xie, N. Gilkes, D. J. Gregg and J. N. Saddler, Appl. Biochem. Biotechnol., 2005, 124, 1069–1079 CrossRef.
- A. W. King, J. Asikkala, I. Mutikainen, P. Järvi and I. Kilpeläinen, Angew. Chem., Int. Ed., 2011, 50, 6301–6305 CrossRef CAS PubMed.
- A. Casas, M. V. Alonso, M. Oliet, E. Rojo and F. Rodriguez, J. Chem. Technol. Biotechnol., 2012, 87, 472–480 CrossRef CAS.
- W. Lan, C. F. Liu, F. Yue, R. C. Sun and J. F. Kennedy, Carbohydr. Polym., 2011, 86, 672–677 CrossRef CAS.
- X. Chen, Y. Gao, L. Wang, H. Chen and N. Yan, ChemPlusChem, 2015, 80, 1565–1572 CrossRef CAS.
- W. Xiao, W. Yin, S. Xia and P. Ma, Carbohydr. Polym., 2012, 87, 2019–2023 CrossRef CAS.
- L. Wu, A. Kumagai, S. H. Lee and T. Endo, Bioresour. Technol., 2014, 162, 207–212 CrossRef CAS PubMed.
- A. Alemdar and M. Sain, Bioresour. Technol., 2008, 99, 1664–1671 CrossRef CAS PubMed.
- T. Q. Yuan, T. You, W. Wang, F. Xu and R. C. Sun, Bioresour. Technol., 2013, 136, 345–350 CrossRef CAS PubMed.
- A. M. Socha, S. P. Plummer, V. Stavila, B. A. Simmons and S. Singh, Biotechnol. Biofuels, 2013, 6, 61–70 CrossRef CAS PubMed.
| This journal is © The Royal Society of Chemistry 2017 |