
 Open Access Article
 This Open Access Article is licensed under a Creative Commons Attribution-Non Commercial 3.0 Unported Licence
A cost-effective birnessite–silicon solar cell hybrid system with enhanced performance for dye decolorization
Guiping Ren ,
Manyi Sun,
Yuan Sun,
Yan Li,
Changqiu Wang,
Anhuai Lu* and
Hongrui Ding*
,
Manyi Sun,
Yuan Sun,
Yan Li,
Changqiu Wang,
Anhuai Lu* and
Hongrui Ding*
The Key Laboratory of Orogenic Belts and Crustal Evolution, School of Earth and Space Sciences, Peking University, Beijing Key Laboratory of Mineral Environmental Function, Beijing, China. E-mail: ahlu@pku.edu.cn; DHR@pku.edu.cn
First published on 12th October 2017
Abstract
A cost-effective and simple configuration of birnessite–silicon solar cell (Bir–SSC) hybrid system is reported in this study. Birnessite, with a band gap of 2.1 eV as determined by UV-vis spectroscopy, was electrochemically deposited on a fluorine-doped tin oxide (FTO) for usage as the anode. It was thoroughly characterized by scanning electron microscopy (SEM), atomic force microscopy (AFM) and Raman spectroscopy, and its prompt response to visible light was further tested by linear sweep voltammetry (LSV). When birnessite electrode was connected with a silicon solar cell in a hybrid system, a remarkably enhanced methyl orange (MO) decolorization from 47.1% (with a bare SSC) to 95.8% was observed. The results indicated the synergistic effects of photoelectrochemical and electrochemical reactions in the hybrid system. In addition, the electron utilization efficiency was 15.29% and 8.54% with and without light irradiation on birnessite respectively. When applied with three different rated voltage SSC, 2.0 V SSC showed the best fit in the hybrid system. Cycling experiments exhibited the stable performance of birnessite electrode, where the MO color removal ratio in ten cycles remained stable at 90.1 ± 2.5%, which is close to the first cycle (95.8%). The hybrid system possesses the merits of cost-effectiveness, low-power consumption, and “green” fabrication strategy, which exbihits promising potential in solar energy utilization and wastewater treatment.
1. Introduction
Wastewater discharge has been regarded as an urgent environmental problem for years, and water pollution by synthetic dyes is also of great concern due to the large worldwide production of dyestuffs.1,2 Traditional physical, chemical and biological techniques as well as advanced oxidation processes (AOPs) are commonly employed in wastewater treatment.3–6 However, these methods have some drawbacks. For example, physical transformation and chemical oxidation are restricted by high expense, ineffectiveness, and the formation of by-products. Biological treatments are time consuming and applicable only for biodegradable pollutants. AOPs require high energy consumption as well as the use of costly and unstable reagents, confining its commercialization.2,5,7 Consequently, to develop the new environment-friendly technologies has become an extremely urgent challenge.Over the past decade, the electrochemical technology has been largely developed for its alternative use for wastewater remediation. Electrons flowing in the electrochemical equipment provided a versatile, efficient, cost-effective and clean reagent, thus exactly meeting the environmental demands.8–14 The main efficient electrochemical procedures are electrocoagulation, electroreduction, electrochemical oxidation, indirect electrooxidation with strong oxidants and photoassisted electrochemical methods.8,9 The treatment using emerging technologies like photoelectro-Fenton and photoelectrocatalysis (PEC) have been classified as electrochemical advanced oxidation processes (EAOPs).8–11 Electrocoagulation is an effective and economical technology for almost total decolorization of chloride dyes. Electrochemical reduction requires higher degradation power cathode materials.8–10 Indirect electro-oxidation using strong oxidants (active chlorine or Fenton) along with photoassisted electrochemical applications enhances the efficiency significantly.1,2,5–12 Electrochemical oxidation provides a simple, viable way and EAOP is promising for the remediation of chloride-free effluents.8–10 Moreover, the combination with nanofiltration, microwaves and ultrasounds opens new perspectives for dyestuff effluents treatment.9 Solar energy is employed in photoelectrochemical system leading to a solar PEC (SPEC) process,12–16 but little attention has been devoted to solar cells. Solar cells are a stable, low cost and commercialized power generation devices, which can transform solar energy into electric energy and may overcome the drawback of high cost of electrical supply.10 The possibilities of combined application of solar cells and photoelectrochemical system remain to be explored.
As far as electrochemical technologies are concerned, selection of electrode is one of the most significant factors.8,11 Designing and fabricating an electrode of desired composition and characteristics is a challenging task.17 Commonly used methods for fabrication of metal oxide anodes are solution/gas phase chemical methods and electrochemical methods (anodization/deposition). The solution-phase method involves dip/spin coating, painting, spray pyrolysis, and sol–gel techniques. The gas-phase methods are chemical vapour deposition and atomic layer deposition.18 Moreover, a large variety of electrodes including doped and undoped PbO2; mixed metal oxides of Ti, Ru, Ir, Sn and Sb doped-SnO2; carbonaceous electrodes and boron-doped diamonds are used as anodes for treatment of synthetic dyes.8–11,19–22 In most cases, TiO2 film was used in photocatalysis and PEC process and a few novel photocatalysts responding to visible light, such as Fe2O3, WO3, ZnO, and GaN were developed as well.23–26 In recent years, manganese oxides have drawn increasing attention for applications in batteries, supercapacitors and visible light-driven catalysis.27–29 Birnessite was one such manganese oxide, which consists of edge-sharing sheets of MnO6 octahedra and has a bandgap of 1.8–2.1 eV (ref. 30–32). Applications of birnessite in oxidation of indigo carmine, benzene and phenolic compounds have been reported.33–36 Since manganese is the 10th most abundant element in the earth's crust and is several orders of magnitude cheaper than rare earth metal catalysts such as Pt, Pd, or Ru, birnessite was a compelling candidate as an electrode material.
In this study, a stable, low-cost and commercialized power generation device—silicon solar cell—was connected with a birnessite electrode in a Bir–SSC hybrid system with the aim to achieve economic and environmental friendly effects. The treatment efficiency of the hybrid system for organic pollutant was tested by a model dye-methyl orange (MO). Moreover, the birnessite electrode characters, MO decolorization efficiency, electron utilization efficiency, system compatibility with different solar cells and the stability of birnessite after ten continuous runs were investigated. By virtue of the simple configuration and good performance, the Bir–SSC hybrid system was believed to be an environment-friendly and low-power consumption system that could harvest solar energy simultaneously to treat wastewater.
2. Methods and materials
2.1 Birnessite electrode preparation
Birnessite electrode was prepared by cathodic deposition, which was performed in a three-electrode electrochemical cell at room temperature.37 Fluorine-doped tin oxide (FTO), platinum sheet (1 cm × 1 cm) and a saturated calomel electrode (SCE, 0.244 V vs. normal hydrogen electrode) were used as the working, counter and reference electrode, respectively. Before electrodeposition, the FTO was cleaned by sonication in acetone, ethanol, and distilled water for 30 min each. The electrodeposition bath consisted of an aqueous solution of 2 mmol L−1 KMnO4 + 50 mmol L−1 KCl. All solutions were prepared from analytical-grade reagents and 18.3 MΩ cm Millipore water. The exposed area of the working electrode was 2.5 × 4 cm2. A potentio/galvanostat electrochemical workstation (CHI 760E Shanghai Chenhua Instrument, China) was employed to maintain a constant potential of −0.05 V (vs. SCE) during the deposit process. The birnessite was controlled with the charge of 0.5C and then rinsed with distilled water.2.2 Characterization of birnessite electrode
Scanning electron micrographs of birnessite were obtained using a Quanta 650 Field Emission Gun scanning electron microscope (SEM) (FEI, USA) under a high voltage of 15 kV and a pressure of 120 Pa. The samples were mounted on an aluminum SEM stub via conductive tapes and coated with gold using a Denton Desk II Gold Sputter Coater before SEM observations.In order to acquire more morphology information, thickness measurements of birnessite were performed using Bruker Dimension ICON Atomic Force Microscopy (AFM) (Bruker, USA). The birnessite was partially lifted off the substrate using a scalpel and then the heights were measured for birnessite-coated and uncoated regions beneath the AFM tip. Imaging was performed in ScanAsyst® mode over a range of 50 × 10 μm. Average step heights along X axis were obtained using the “step” feature in NanoScope_Analysis software.
The mineral phase and structure analysis of birnessite were measured by Raman spectra (Renishaw inVia Reflex, UK) equipped with a 532 nm laser and a long working-distance 50× objective. The accuracy of the apparatus and the frequency stability were checked by recording the Raman spectrum of silicon. To obtain a high signal-to-noise ratio, each Raman spectrum was the average of 5 successive scans recorded at a spectral resolution of 1 cm−1. The laser intensity was 50% and the diameter of the beam spot was 1 μm.
As a semiconducting material, the value of optical band gap was determined by UV-vis absorption spectroscopy (UV 3600-Plus, Japan) in transmission mode with baseline correction for the bare FTO substrate.
The photoresponse of birnessite electrode was measured by a quartz cube cell with a conventional three-electrode configuration system under chopped irradiation from an external simulated LED (Light Emitting Diode) and the illumination intensity was 100 mW cm−2. Linear sweep voltammetry (LSV) was performed in the electrolyte with 0.1 mol L−1 Na2SO4 + 1.0 mol L−1 ethanol aqueous solution using a potentiostat (CHI 1000C Shanghai Chenhua Instrument, China). Hand-chopped light was used to obtain the light and dark curves and the scan rate for the linear sweep voltammetry was 2.5 mV s−1.
2.3 Hybrid system configuration
The Bir–SSC hybrid system was based on an electrolytic cell (Fig. 1). Birnessite electrode, platinum sheet and a saturated calomel electrode were used as the working, counter and reference electrode, respectively. The positive electrode of SSC was connected with birnessite electrode; the negative electrode was linked to a unit of 1000 Ω resistance and then connected with the cathode. The voltage of the resistance was recorded using a datalogger (ADC-16, Pico Technology, UK). Electrode potentials were recorded simultaneously using a digital voltmeter (UT-33B, China). | ||
| Fig. 1 Schematic of the Bir–SSC hybrid system. | ||
At first, the adsorption and photodecomposition of MO by birnessite electrode was studied. Then, a SSC was introduced to the linear circuit and the decolorization ability of Bir–SSC hybrid system under light and dark conditions for birnessite electrode were investigated. Moreover, the feasibility and compatibility of the hybrid system equipped with different standard SSCs was further explored. In order to understand the long-term cycle of the hybrid system and stability of birnessite electrode, ten continuous runs for decolorization of MO was carried out. Then, morphology and structure of the electrodes were comparatively studied by Raman, SEM and AFM techniques.
2.4 Photoelectrocatalytic decolorization characterization
Photoelectrocatalytic decolorization of MO was performed at room temperature in a cylindrical quartz glass electrolytic cell containing 30 mL 5 mg L−1 MO aqueous solution. During the course of the experiment, the pH of the decolorization solution was not controlled, but monitored using a Mettler Toledo pH meter before (pH = 5.6) and after (pH = 5.6) the decolorization process. The incident light was irradiated onto birnessite electrodes from the backside through the quartz window. The light intensity at sample position was approximately 200 mW cm−2, provided by an external white LED lamp.The decolorization efficiency of MO was evaluated by monitoring the absorbance at the maximum absorption wavelength of 464 nm using a UV-visible spectrometer (Evolution 220, Thermo, USA). The efficiency of the MO decolorization was estimated using eqn (1):
| MO decolorization (%) = (A0−At)/A0 × 100% | (1) |
| Ct−C0 = −k0t | (2) |
| ln(Ct/C0) = −k1t | (3) |
3. Results and discussion
3.1 Morphology and structure characterization of birnessite electrode
After potentiostatic electrodeposition, a birnessite film, composed of wrinkled thin sheets, was formed on the FTO electrode (using SEM, as shown in Fig. 2), which was consistent with previously reported synthesized birnessite films.30,37 All the sheets were perpendicular to the FTO electrode and assembled to a porous structure, which facilitated the access of the electrolyte. The thickness of the film was approximately 200 nm as measured by AFM. Even after ten times of reuse, no significant changes in the birnessite film were observed and the thickness remained at 200 nm, indicating physical stability of birnessite electrode. | ||
| Fig. 2 SEM images of birnessite before (a) and after (b) 10 times of reuse for MO decolorization. | ||
Raman spectra (Fig. 3) showed three bands at 514, 578 and 641 cm−1, which nearly matched the major vibrational modes of birnessite.38 The Raman band located at 641 cm−1 was attributed to the symmetric stretching vibration ν2 (Mn–O) of MnO6 groups. The strongest band located at 578 cm−1 was attributed to the ν3 (Mn–O) stretching vibration in the basal plane of MnO6 sheets.38,39 The low-wavenumber Raman (<500 cm−1) peaks were associated with K–O vibrations. Consistent with the morphology characteristics, the Raman patterns before and after 10 times cycling test showed no observable changes, indicating the chemical stability of the birnessite electrode.
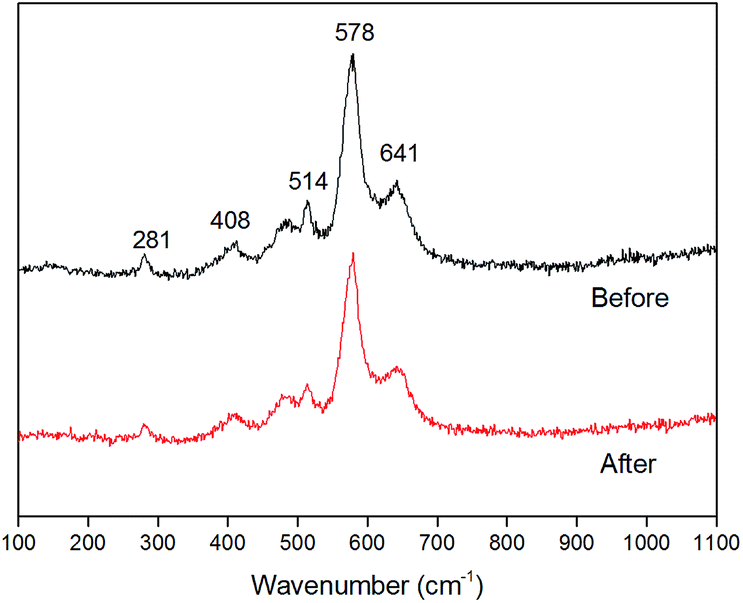 | ||
| Fig. 3 Raman spectra of birnessite electrode before and after 10 times of reuse for MO decolorization. | ||
3.2 Band gap and photocurrent of birnessite
Fig. 4 (inset picture) displayed the UV-vis absorption spectrum of birnessite electrode, which exhibits broad absorptions in the wavelength range of 300–700 nm. The electronic transition between the valence and conduction bands consists primarily of an excitation from an O(2p) to Mn(3d) and with some Mn(3d) to Mn(3d) character.32,40 A distinct peak is located at around 400 nm, which could be ascribed to the overlap of the d–d transitions of manganese ions in the octahedral site.41 The Tauc plots and absorption spectrum for birnessite is shown in Fig. 4. The extrapolated results indicated an allowed indirect band gap of 2.1 eV and an allowed direct band gap of 2.3 eV. A previous study had reported that synthetic Na–birnessite (approximately Na4Mn14O27) had a band gap of 1.8 eV (ref. 35) and synthesized protonic birnessite (H0·13MnO2·0.7H2O) had a band gap of 2.23 eV. In addition, electrodeposited crystalline Na birnessite-type MnO2 thin film exhibited an indirect band gap of 2.1 eV and an allowed direct band gap of 2.7 eV (ref. 31,42). Based on the laboratory results of different birnessite films, we concluded that the birnessite electrode was a visible-light photoactive material.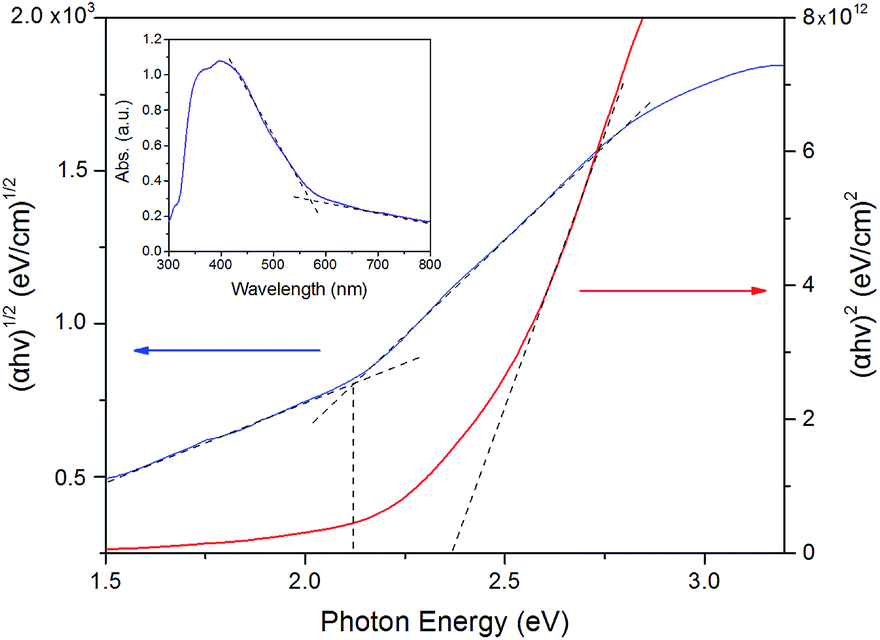 | ||
| Fig. 4 Tauc plots of birnessite for determining the indirect (2.1 eV) and direct (2.3 eV) band gaps (inset picture: UV-vis absorption spectra for birnessite electrode). | ||
Furthermore, photocurrent density of birnessite electrode responding to different potentials under visible-light illumination was investigated by LSV curves. As shown in Fig. 5 (inset picture), the photocurrent immediately increased when light was turned on and rapidly went back to base line when light was switched off. The anodic photocurrents corresponding to a photo-oxidation process indicated that birnessite had an n-type semiconducting nature.30,42,43 Moreover, the behavior of photocurrent generation was influenced by potential change. With higher potential, the increment of photocurrent was more significant and when the anodic potential increased to 1.2 V, the value of photocurrent was almost three times higher than dark current (Fig. 5). The result suggested that the separation of electron–hole pairs was more effective at higher anodic potential.
 | ||
| Fig. 5 Current potential curve (anodic sweep at 2.5 mV s−1 shown) for birnessite showing n-type photocurrent and reasonable catalytic activity. | ||
3.3 Photoelectrocatalytic decolorization of MO in the hybrid system
The MO decolorization efficiencies at different controls were compared with each other. As shown in Fig. 6, the “Dark + Bir” experimental group showed no evident decolorization effect, which indicated that the adsorption of MO by birnessite electrode was negligible. Moreover, the concentration of MO did not decrease in the “Light + Bir” experimental group. This suggested that the direct photodecomposition of MO by birnessite could not take place. However, when an external SSC (open-circuit voltage was 2.0 V and short-circuit current was 5.0 mA) was employed in the system, “Dark + Bir + SSC”, decolorization reaction took place (Fig. 6). After 4 hours, color removal ratio was 47.1% attributing to electrochemical MO decolorization and the kinetics of MO decrease fitted well with the zero-order kinetic model with rate constants (k0) of 0.59 mg L−1 h−1 and R2 values of 0.992. The results revealed that SSC pulled the electrons out from the anode, thus leading to an electrocatalytic oxidation process. | ||
| Fig. 6 Decolorization curves for MO in different controls. | ||
Notably, the highest MO color removal ratio was achieved in the “Light + Bir + SSC” experimental group (95.8%). The kinetics of MO decolorization followed the pseudo first-order kinetic model with the rate constant (k1) of 0.79 h−1 and R2 value of 0.997. In addition, the total organic carbon (TOC) values of samples before and after decolorization in the hybrid system were calculated to be 2.25 and 2.11 mg L−1. It means that although the color of MO was removed, MO did not completely degrade to CO2 and could form more recalcitrant by-products and a large number of intermediates.44–47 Previous studies found that the photoelectrocatalysis method could decolorize different dyes completely, but TOC removal was much lower.8 Garcia-Segura reported that TOC reduced only by 40% in solar PEC for AOPs.8,12 The results indicated that by-products were formed during degradation process.
Comparing with the recent treatment techniques, such as electrocoagulation, electrochemical reduction, electrochemical oxidation, indirect electro-oxidation and photoassisted electrochemical applications, this hybrid system provided a novel idea for solar energy utilization and wastewater treatment. Light was not only used as a photocatalyst, but also for electrochemical power supply. Based on these results, it can be said that the future looks bright for the use of this hybrid system coupling with various SSC in the field of electrochemical advanced oxidation processes.
3.4 Electron utilization efficiency in the hybrid system
To gain more insight, the system electric quantity and the utilized electrons for MO decolorization was calculated according to the current (calculated by voltage of fixed resistance recorded by datalogger) and decolorization ratio data (Fig. 7). The average current in “Light + Bir + SSC” was 15 μA, while it was only 7 μA in “Dark + Bir + SSC”. To facilitate comparison, the total transferred electrons, utilized electrons for MO decolorization and the electrons utilization efficiency at the anode are summarized in Table 1. The electric quantity of “Light + Bir + SSC” was only 2.35 times of “Dark + Bir + SSC”. Nevertheless, the total quantity of reduced MO was more significant and up to an amazing relative percentage of 426.5%. Moreover, the electron utilization efficiency was 8.99% compared with 4.96% in dark condition. Above all, we could conclude that Bir–SSC hybrid system had higher electron utilization efficiency, demonstrating that MO decolorization was promoted at the birnessite electrode and the energy of visible light was used by the hybrid system. Such a promotion was clearly due to the synergistic mechanism of photoelectrocatalysis and electrocatalysis.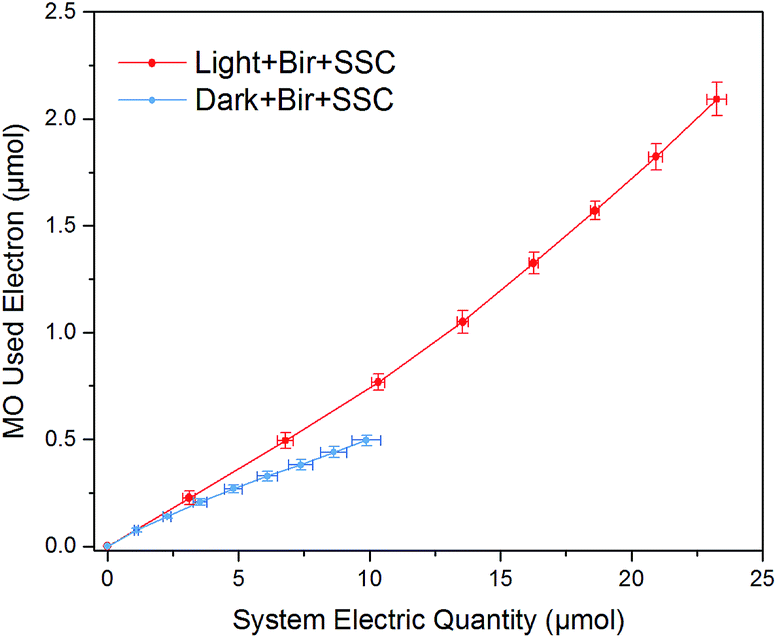 | ||
| Fig. 7 Correlations of total electrons in the circuit and the electrons used for MO decolorization in Bir–SSC hybrid system under light and dark. | ||
| MO decolorization utilized (μmol) | System electric quantity (μmol) | Utilization efficiency | |
|---|---|---|---|
| Light + Bir + SSC | 2.09 ± 0.08 | 23.25 ± 0.36 | 8.99% |
| Dark + Bir + SSC | 0.49 ± 0.03 | 9.88 ± 0.56 | 4.96% |
| Relative percentage | 426.53% | 235.32% | 181.25% |
3.5 Compatibility of birnessite electrode with SSC
With the aim to achieve a better understanding of the performance for the hybrid system, the feasibility and stability of the hybrid system equipped with various specifications of SSC were further investigated (Fig. 8). Three types of SSC (open-circuit voltages were 0.5, 1.0, 2.0 V) were applied to the external circuit in the experiments. MO decolorization ratios in “Light + Bir + SSC”, with SSC voltage from low to high reached 33.7%, 81.9% and 95.1% in a span of 4 hours. The kinetics of MO decolorization effectively followed the zero-order kinetic model, with rate constants (k1) of 0.10, 0.44 and 0.77 h−1 (R2 = 0.987, 0.997 and 0.997). Nevertheless, it was only 14.5%, 43.8% and 52.4% at “Dark + Bir + SSC” condition. The kinetics of MO removal fitted the zero-order kinetic model (Table 2), with rate constants (k0) of 0.18, 0.55 and 0.62 mg L−1 h−1 (R2 = 0.997, 0.996 and 0.999). Therefore, when referring to the enhancement of the decolorization efficiency in the hybrid system, SSC exerted influence in two ways. On the one hand, a SSC with higher open-circuit voltage was applied in the hybrid system, which accelerated the separation of electron–hole pairs and produced more oxidative species. On the other hand, the higher voltage SSC produced a larger current and the electrochemical oxidation enhanced at the same time. | ||
| Fig. 8 MO decolorization ratios in Bir–SSC hybrid system coupling with different rated voltage SSCs. | ||
| SSC | 0.5 V | 1.0 V | 2.0 V | |
|---|---|---|---|---|
| Dark + Bir + SSC | Decolorization ratio in 4h | 14.5% | 43.8% | 52.4% |
| Constant k0 (mg L−1 h−1) | 0.18 | 0.55 | 0.62 | |
| Correlation coefficient R2 | 0.997 | 0.996 | 0.999 | |
| Light + Bir + SSC | Decolorization ratio in 4h | 33.7% | 81.9% | 95.1% |
| Constant k1 (h−1) | 0.10 | 0.44 | 0.77 | |
| Correlation coefficient R2 | 0.987 | 0.997 | 0.997 |
It is worthwhile to mention that the percent MO decolorization at an irradiated birnessite anode by SSC (0.5, 1.0 and 2.0 V) were 98.99%, 113.8% and 144.3% (at 2.5 h), respectively. The results indicated that birnessite showed the most significant photoelectrochemical process with 2.0 V SSC. At a lower voltage the separation of electron hole pairs was inefficient, but at a higher voltage SSC enhanced the electrochemical oxidation, which weakened the effect of birnessite to some extent.
3.6 Long-term cycle and stability testing
The stability of the hybrid system and birnessite electrode for photoelectrocatalysis decolorization of pollutants was tested by successive decolorization of MO for ten continuous runs. The birnessite electrode after decolorization reaction was analyzed by Raman spectroscopy (Fig. 3), which confirmed that the birnessite phase was stable on the FTO electrode. In addition, this was consistent with the observation from SEM (Fig. 2) and the thickness of birnessite film measured by AFM. Moreover, the decolorization efficiencies in ten cycles remained stable at the range of 90.1 ± 2.5%, which is very close to the first cycle (95.8%) as shown in Fig. 9, indicating that the birnessite film on electrode was stable when the decolorization experiments were repeated 10 times. The concentration of Mn2+ in the solutions was determined by ICP-OES (Spectroblus, Spectro, Germany). However, no Mn2+ ions were detected in the decolorization solutions after the decolorization of MO finished, meaning that no obvious ions leakage occurred during the decolorization process. | ||
| Fig. 9 Cycling decolorization of MO by Bir–SSC hybrid system under visible light illumination. | ||
All the results obtained inferred the high stability of electrode in Bir–SSC hybrid system for decolorization of environmental pollutants. Therefore, the future looks bright, as more efficient materials may be employed in the hybrid system.
3.7 Possible photoelectrocatalysis mechanism
From the photoelectrocatalytic decolorization results (Fig. 6), we can conclude that without SSC, the electron transfer rate at the birnessite anode was too low to be measured. Even under irradiation, photoelectrons could not be effectively separated to enter into the circuit, which could be due to the lower conduction band potential and poor electron–hole separation efficiency of birnessite. With the help of SSC, an external bias was imposed, which significantly increased the photoelectron transfer rate and prevented the recombination of the photoelectron–hole pairs. The synergistic effect of photoelectrochemical and electrochemical oxidation was realized in the Bir–SSC hybrid system. In addition, the electron was promoted from the valence band to the conduction band, leaving behind a hole in the valence band and reacting with MO. The azo group might convert to amines, which is related to the disappearing of the orange color.45 Moreover, TOC values changed slightly in the hybrid system, which indicates that MO did not completely degrade to CO2. The process of methylation and hydroxylation might take place and result in plenty of intermediates.44–47 In addition, by-products of MO may be similar to those of photocatalytic degradation process.46 The proposed schematic mechanism is shown in Fig. 10. For further studies, semiconducting materials with higher efficiency, more suitable operating conditions and better reactor design can be investigated using our proposed hybrid system. Moreover, with a better utilization for solar energy by diverse SSC, it is possible to achieve the goal of coupling of cathodic and anodic processes and enhancement efficiency for wastewater remediation by new electrochemical advanced oxidation processes in the future. | ||
| Fig. 10 Schematic of the proposed possible mechanism for the Bir–SSC hybrid system. | ||
4. Conclusions
We investigated the enhanced performance of photoelectrocatalysis decolorization application using a low-cost Bir–SSC hybrid system fabricated in this study. SEM, AFM and Raman spectroscopy were used to characterize birnessite electrode. Moreover, UV-vis spectroscopy and electrochemical techniques indicated that birnessite has photoactive material response to visible light. Photoelectrocatalytic decolorization results demonstrated that photoelectrochemical and electrochemical oxidation acted synergistically in the hybrid system. As a result, both the decolorization rate and electron utilization efficiency were significantly improved. Furthermore, different rated voltage SSCs were employed in the hybrid system and the 2.0 V SSC showed the most significant photoelectrochemical process. Cycle and stability testing showed that the birnessite electrode has stable decolorization efficiencies after 10 repeated experiments. Such a system was believed to be an environment-friendly and low-cost system that could have the potential to be a powerful tool for the degradation of hazardous organics in water.Conflicts of interest
There are no conflicts to declare.Acknowledgements
This study was funded by the National Basic Research Program of China (973 Program) (Grant No. 2014CB846001) and the Natural Science Foundation of China (Grant No. 41230103, 41522201 & 41402032).References
- T. Robinson, G. McMullan, R. Marchant and P. Nigam, Bioresour. Technol., 2001, 77(3), 247–255 CrossRef CAS PubMed.
- E. Forgacs, T. Cserhati and G. Oros, Environ. Int., 2004, 30(7), 953–971 CrossRef CAS PubMed.
- A. Bousher, X. Shen and R. G. Edyvean, Water Res., 1997, 31(8), 2084–2092 CrossRef CAS.
- M. Panizza and G. Cerisola, Chem. Rev., 2009, 109(12), 6541–6569 CrossRef CAS PubMed.
- I. Oller, S. Malato and J. A. Sánchez-Pérez, Sci. Total Environ., 2011, 409(20), 4141–4166 CrossRef CAS PubMed.
- O. J. Hao, H. Kim and P. C. Chiang, Crit. Rev. Environ. Sci. Technol., 2000, 30(4), 449–505 CrossRef CAS.
- C. A. Martínez-Huitle, M. A. Rodrigo, I. Sires and O. Scialdone, Chem. Rev., 2015, 115(24), 13362–13407 CrossRef PubMed.
- C. A. Martínez-Huitle and E. Brillas, Appl. Catal., B, 2009, 87(3), 105–145 CrossRef.
- E. Brillas and C. A. Martínez-Huitle, Appl. Catal., B, 2015, 166, 603–643 CrossRef.
- I. Sirés, E. Brillas, M. A. Oturan, M. A. Rodrigo and M. Panizza, Environ. Sci. Pollut. Res., 2014, 21(14), 8336–8367 CrossRef PubMed.
- C. A. Martinez-Huitle and S. Ferro, Chem. Soc. Rev., 2006, 35(12), 1324–1340 RSC.
- S. Garcia-Segura, S. Dosta, J. M. Guilemany and E. Brillas, Appl. Catal., B, 2013, 132, 142–150 CrossRef.
- S. Garcia-Segura, L. C. Almeida, N. Bocchi and E. Brillas, J. Hazard. Mater., 2011, 194, 109–118 CrossRef CAS PubMed.
- R. Salazar, E. Brillas and I. Sirés, Appl. Catal., B, 2012, 115, 107–116 CrossRef.
- R. Salazar, S. Garcia-Segura, M. S. Ureta-Zañartu and E. Brillas, Electrochim. Acta, 2011, 56(18), 6371–6379 CrossRef CAS.
- F. C. Moreira, S. Garcia-Segura, V. J. P. Vilar, R. A. Boaventura and E. Brillas, Appl. Catal., B, 2013, 142, 877–890 CrossRef.
- A. N. Subba Rao and V. T. Venkatarangaiah, Environ. Sci. Pollut. Res., 2014, 21(5), 3197–3217 CrossRef CAS PubMed.
- D. Perednis and L. J. Gauckler, J. Electroceram., 2005, 14(2), 103–111 CrossRef CAS.
- X. Li, D. Pletcher and F. C. Walsh, Chem. Soc. Rev., 2011, 40(7), 3879–3894 RSC.
- Y. J. Feng and X. Y. Li, Water Res., 2003, 37(10), 2399–2407 CrossRef CAS PubMed.
- M. Panizza and G. Cerisola, Chem. Rev., 2009, 109(12), 6541–6569 CrossRef CAS PubMed.
- N. N. Rao, K. M. Somasekhar, S. N. Kaul and L. Szpyrkowicz, J. Chem. Technol. Biotechnol., 2001, 76(11), 1124–1131 CrossRef CAS.
- A. M. Basilio, Y. K. Hsu and K. H. Chen, Mater. Chem., 2010, 20, 8118 RSC.
- X. F. Cheng, W. H. Leng, D. P. Liu, J. Q. Zhang and C. N. Cao, Chemosphere, 2007, 68(10), 1976–1984 CrossRef CAS PubMed.
- S. S. Shinde, C. H. Bhosale and K. Y. Rajpure, Catal. Rev.: Sci. Eng., 2013, 55(1), 79–133 CAS.
- Y. K. Hsu, Y. G. Lin and Y. C. Chen, Electrochem. Commun., 2011, 13(12), 1383–1386 CrossRef CAS.
- F. Jiao and H. Frei, Energy Environ. Sci., 2010, 3(8), 1018–1027 CAS.
- A. R. Armstrong and P. G. Bruce, Nature, 1996, 381(6582), 499 CrossRef CAS.
- C. C. Hu and T. W. Tsou, Electrochem. Commun., 2002, 4(2), 105–109 CrossRef CAS.
- Y. K. Hsu, Y. C. Chen, Y. G. Lin, L. C. Chen and K. H. Chen, J. Mater. Chem., 2012, 22(6), 2733–2739 RSC.
- B. A. Pinaud, Z. Chen, D. N. Abram and T. F. Jaramillo, J. Phys. Chem. B, 2011, 115(23), 11830–11838 CAS.
- D. M. Sherman, Geochim. Cosmochim. Acta, 2005, 69(13), 3249–3255 CrossRef CAS.
- S. C. Chien, H. L. Chen, M. C. Wang and K. Seshaiah, Chemosphere, 2008, 74(8), 1125–1133 CrossRef PubMed.
- J. Hou, Y. Li, M. Mao, L. Ren and X. Zhao, ACS Appl. Mater. Interfaces, 2014, 6(17), 14981–14987 CAS.
- M. Zaied, E. Chutet, S. Peulon, N. Bellakhal, B. Desmazières, M. Dachraoui and A. Chaussé, Appl. Catal., B, 2011, 107(1), 42–51 CrossRef CAS.
- H. Zhang, H. Ding, X. Wang, C. Zeng, A. Lu, Y. Li and C. Wang, J. Environ. Sci., 2017, 52, 259–267 CrossRef PubMed.
- M. Nakayama, T. Kanaya, J. W. Lee and B. N. Popov, J. Power Sources, 2008, 179(1), 361–366 CrossRef CAS.
- C. Julien, M. Massot, R. Baddour-Hadjean, S. Franger, S. Bach and J. P. Pereira-Ramos, Solid State Ionics, 2003, 159(3–4), 345–356 CrossRef CAS.
- Y. K. Hsu, Y. C. Chen, Y. G. Lin, L. C. Chen and K. H. Chen, Chem. Commun., 2011, 47(4), 1252–1254 RSC.
- K. D. Kwon, K. Refson and G. Sposito, Geochim. Cosmochim. Acta, 2009, 73(14), 4142–4150 CrossRef CAS.
- E. J. Oh, T. W. Kim, K. M. Lee, M. S. Song, A. Y. Jee, S. T. Lim and S. J. Hwang, ACS Nano, 2010, 4(8), 4437–4444 CrossRef CAS PubMed.
- N. Sakai, Y. Ebina, K. Takada and T. Sasaki, J. Phys. Chem. B, 2005, 109(19), 9651–9655 CrossRef CAS PubMed.
- Y. Ohko, K. Hashimoto and A. Fujishima, J. Phys. Chem. A, 1997, 101(43), 8057–8062 CrossRef CAS.
- K. Dai, H. Chen, T. Peng, D. Ke and H. Yi, Chemosphere, 2007, 69(9), 1361–1367 CrossRef CAS PubMed.
- L. G. Devi, S. G. Kumar, K. M. Reddy and C. Munikrishnappa, J. Hazard. Mater., 2009, 164(2), 459–467 CrossRef PubMed.
- C. Baiocchi, M. C. Brussino, E. Pramauro, A. B. Prevot, L. Palmisano and G. Marci, Int. J. Mass Spectrom., 2002, 214, 247–256 CrossRef CAS.
- Y. P. Chen, S. Y. Liu, H. Q. Yu, H. Yin and Q. R. Li, Chemosphere, 2008, 72(4), 532–536 CrossRef CAS PubMed.
| This journal is © The Royal Society of Chemistry 2017 |