 Open Access Article
Creative Commons Attribution 3.0 Unported Licence
Effect of Nb doping in WO3/ZrO2 catalysts on gas phase dehydration of glycerol to form acrolein†
Ku-Hsiang Sung and
Soofin Cheng *
*
Department of Chemistry, National Taiwan University, Roosevelt Rd. Sec. 4, Taipei 106, Taiwan. E-mail: chem1031@ntu.edu.tw; Fax: +886-2-33668671
First published on 29th August 2017
Abstract
Gas-phase dehydration of glycerol to produce acrolein was investigated over tungstated zirconia catalysts with and without niobium doping, in order to correlate the catalytic activity and life-stability with the acid/base properties of the catalysts. The results of NH3- and CO2-TPD experiments showed that the tungstated zirconia catalysts contained both acidic and basic sites, and the amounts decreased with the increase in calcination temperature. The most suitable calcination temperature for 20% WO3/ZrO2 as the catalyst in the gas phase dehydration of glycerol to form acrolein was 450 °C in consideration of achieving high acrolein yield and long lifetime of the catalyst. Not only the amount of acid but also the amount of base affected the acrolein yield. Doping a small amount of niobium further increased the life-stability of the catalysts, attributed to the decrease in the number of basic sites. The influence of Nb is mostly in neutralization of surface acidity electronically instead of geometric blocking of the basic sites. Moreover, fine tuning the ratio of acid/base sites was found to be important in achieving good catalytic performance in the gas-phase dehydration of glycerol to generate acrolein. The ratio of acid/base sites in the range of 4–5.4 gave the highest glycerol conversion, and acrolein yield and lowest catalyst decay rate. The spent catalysts were easily regenerated by calcination at 450 °C, and the catalytic activities were retained well even after the second time of reuse.
1. Introduction
To decrease the global demand for fossil fuels and reduce CO2 emission, there has been great interest in producing fuels and chemicals from renewable feedstock. Biodiesel is considered one of the best choices among several alternative fuels because of its CO2-neutral production and slight impact on engine performance.1 Biodiesel is currently synthesized by base-catalyzed transesterification of triglyceride with short chain alcohols on a large scale, accompanied by the formation of 10 wt% of glycerol as byproduct.2 Although political regulations have pushed the production of biofuels in order to fulfill the CO2 reduction objectives fixed by the Kyoto climate protocol and lately the Paris Agreement, it is not yet possible to produce any of these biofuels as economical competitors to fossil fuels. One of the possible ways to reduce the production cost of biodiesel is using glycerol to produce value-added chemicals. When considering a commercial target, the catalytic dehydration of glycerol to acrolein is the most promising route for valorizing glycerol because acrolein has many applications in industrial processes, such as the precursors of acrylic acid and biocides.3Dehydration of glycerol to form acrolein has been exercised since 1930, Schering-Kahlbaum claimed the first patent of acrolein production from glycerol in gas-phase over lithium phosphate supported on pumice stone.4 The rate of acrolein decomposition was found to be faster than that of acrolein formation in the absence of acid catalyst. Since then, sulfuric acid was used as the catalyst in liquid phase dehydration of glycerol.5,6 However, corrosion hazard and difficulties in handling and product separation are the drawbacks. Although solid acid catalysts such as clay and alumina supported phosphoric acid7,8 and heteropolyacids9,10 were effective as the dehydration catalysts in liquid phase, it is still hazardous to operate the reaction under supercritical water pressure.
Gas-phase dehydration of glycerol to produce acrolein has been promoted by solid acids. Dubois et al.11,12 studied the catalytic performances of various solid acids, including zeolites, Nafion and WO3/ZrO2, in gas-phase dehydration of glycerol, and concluded that solid acids with Hammett acidities (HAs) in the range of −10 to −16 were suitable catalysts. They also reported for the first time that WO3/ZrO2 had high activity in catalyzing gas-phase dehydration of glycerol to produce acrolein. In 2007, Chai et al.13 examined a large group of solid materials including zeolites, SAPOs, metal oxides, supported phosphoric and heteropoly acids, and sulfated and tungstated zirconia, in catalyzing gas-phase dehydration of glycerol. They concluded that solids with HAs in the range of −3 to −8.2 were most active catalysts in generating acrolein. Among the solids, 15 wt% WO3/ZrO2 showed the highest glycerol conversion and acrolein selectivity. Nevertheless, deactivation of the catalysts with time-on-stream (TOS) was the main concerns. In 2011, Ulgen et al.14 reported the use of WO3/TiO2 instead of WO3/ZrO2 as the catalyst in gas-phase dehydration of glycerol, and they found that co-feeding of oxygen could reduce deactivation rate of the catalyst.
Niobium based catalysts have been tested in dehydration of glycerol to form acrolein.15–20 Chai et al.15 reported that the niobia calcined at 400 °C gave the highest glycerol conversion and acrolein selectivity. Shiju et al.16 studied silica supported niobia catalysts and found that the glycerol conversion and acrolein selectivity depended on the niobia loading and calcination temperature. However, in both aforementioned works, the niobia catalysts showed glycerol conversions decreased rapidly with TOS. Lauriol-Garbey et al.19,20 used zirconium and niobium mixed oxides (ZrNbO) as catalysts for glycerol dehydration. The ZrNbO catalysts gave the recorded high conversion of 82% even after 177 h on stream with acrolein selectivity remaining 72%. However, these results have not been repeated by other research groups. Lately, the same group reported SiO2-doped WO3/ZrO2 as catalysts in dehydration of glycerol.21 However, the catalytic lifetime was much shorter than that of ZrNbO. Recently, niobium species supported on a zirconium doped porous silica were used as the catalysts, but acrolein selectivity of 45 mol% was obtained after 2 h TOS.22 In the present study, we disclosed a novel finding that doping a small amount of niobium to WO3/ZrO2 catalysts would increase the life-stability of the catalysts. Moreover, relatively high acrolein selectivities (ca. 70%) could be retained. Efforts were put in correlation of the active sites with the decay rate of the catalysts.
2. Experimental methods
2.1 Catalyst synthesis
Tungstated zirconia was prepared by wet impregnation method. For the WO3/ZrO2 catalyst of 20% weight ratio, a solution containing 0.2656 g (NH4)6H2W12O40·xH2O dissolved in 5 mL deionized water was added dropwise onto 1.2926 g Zr(OH)4 powders under static condition, and the mixture was left steady for 1 h before the solvent was removed by rotary evaporation.23,24 After drying at 100 °C overnight, the powders were calcined in air at temperatures in the range of 400 to 800 °C for 3 h with a ramping rate of 1 °C min−1. The niobium doped tungstated zirconia catalysts were prepared by the procedures similar to the foregoing method, except proper amounts of niobium oxalate were added in the solution of ammonium metatungstate hydrate for impregnation on Zr(OH)4 powders. After drying at 100 °C overnight, the powders were calcined at 450 °C for 3 h in air. The resultant materials were designated as X-NbWOx/ZrO2-450, where the WO3/ZrO2 weight ratios were kept at 20%, and X varied in 1, 3, and 5% is the Nb2O5/(WO3 + ZrO2) weight ratio.2.2 Catalyst characterization
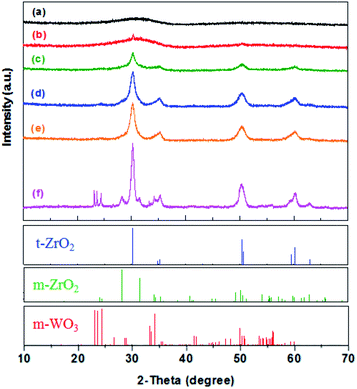
Powder X-ray diffraction (PXRD) patterns were recorded with a Panalytical X'Pert diffractometer using Cu Kα radiation in an operating mode of 45 kV and 40 mA. Nitrogen physisorption was carried out in a Micromeritics TriStar 3000 system. Prior to the physisorption, the sample was degassed at 200 °C under 10−3 torr for at least 8 h. Acidity and basicity of the catalysts were determined by temperature-programmed desorption of NH3 and CO2, respectively, using an AutoChem 2910 system with a TCD detector. About 0.25 gram of the sample was heated in a 50 mL min−1 of He flow at calcination temperature for 1 h to remove the adsorbed moisture. Then, 5% ammonia in He or pure CO2 gas (50 mL min−1) was passed through the sample at 100 °C for 1 h, followed by purging the sample with pure He (30 mL min−1) for another hour. The TCD signals of the effluent were recorded when the sample was heated from 100 to 600 °C with a ramping rate of 10 °C min−1. FTIR spectra were conducted using a Nicolet Magna FT-IR 550 spectrometer. The resolution of the recorded spectra is 4 cm−1. 25 mg of the sample was pressed into a disk and placed inside the cell. After heated at 450 °C under 10−4 torr for 1 h and cooled down to room temperature, the sample was exposed to pyridine vapor for 30 min and evacuated to 10−4 torr for another 30 min to remove pyridine vapor in the gas phase. The IR spectra were recorded under 10−4 torr while the temperature was raised to 400 °C at 100 °C intervals. Scanning electron microscopy (SEM) photographs were taken using a Hitachi S-4800 Field Emission Scanning Electron Microscope.2.3 Catalytic reaction
Gas-phase dehydration of glycerol was carried out at 290 °C under ambient pressure in a vertical fixed-bed tubular quartz reactor. The catalyst (300 mg) in fine powders was mixed with quartz (300 mg) and then sandwiched in the middle of the reactor with quartz wool. Prior to the reaction, the catalyst was pretreated at 290 °C for 1 h under flowing dry nitrogen (60 mL min−1). An aqueous solution of 10 wt% glycerol was fed into the reactor by a syringe pump with a flow rate of 8 mL h−1. The products were collected hourly by an ice-water trap and analyzed by a gas-chromatography (GC) equipped with a capillary column (BP-20) and a FID detector. The glycerol conversion and selectivities of identified products were calculated according to the following equations:| Conversion (%) = (initial mol − final mol) of glycerol/initial mol of glycerol × 100% | (1) |
| Selectivity (%) = (specific product in mol)/(initial mol − final mol) of glycerol × 100% | (2) |
3. Results and discussion
3.1 Effect of calcination on WO3/ZrO2 catalysts
Nitrogen sorption isotherms of the calcined WO3/ZrO2 catalysts show type IV isotherms with the hysteresis loops appeared at p/p0 of 0.5–0.9, implying that these materials own mesopores. The derived textural properties are given in Table 1. A decrease in surface area and increase in pore diameter are observed with increasing the calcination temperature, and both are originated from sintering of the metal oxide particles at high temperatures.
| Sample | SBET (m2 g−1) | Pore diametera (nm) | Pore volume (cm3 g−1) |
|---|---|---|---|
| a Determined by BJH method at peak maximum of pore size distribution profile. | |||
| WO3/ZrO2-400 | 254 | 3.7 | 0.241 |
| WO3/ZrO2-450 | 223 | 4.4 | 0.222 |
| WO3/ZrO2-500 | 189 | 5.1 | 0.248 |
| WO3/ZrO2-600 | 138 | 5.3 | 0.221 |
| WO3/ZrO2-700 | 134 | 6.3 | 0.239 |
| WO3/ZrO2-800 | 62 | 12 | 0.224 |
| 1% NbWOx/ZrO2-450 | 233 | 5.0 | 0.278 |
| 3% NbWOx/ZrO2-450 | 236 | 5.3 | 0.302 |
| 5% NbWOx/ZrO2-450 | 242 | 5.6 | 0.302 |
NH3- and CO2-TPD experiments were used to measure the surface concentrations of acidic and basic sites, respectively. Fig. S1(A) (ESI†) shows that the total acid amounts of the WO3/ZrO2 catalysts measured by NH3-TPD decrease with calcination temperature, and the desorption peaks appear mainly in the range of 150–500 °C. These results are in consistence with that reported by García-Sancho et al.25 that the acidic strengths of the WO3/ZrO2 catalysts were in the range of weak to moderate. However, it is noticed that the sample calcined at 400 °C have additional desorption peaks at temperatures above 400 °C. The high temperature peak decreases in intensity and shifts to temperatures above 470 °C for the sample calcined at 450 °C.
Fig. S1(B) (ESI†) compares the base amounts of WO3/ZrO2 catalysts calcined at different temperatures measured by CO2-TPD experiment. Again, the total base amounts of the WO3/ZrO2 catalysts decrease with the calcination temperature. Three peak maxima can be seen at ca. 190, 380 and 530 °C on the sample calcined at 400 °C. The last high temperature peak is hardly seen on the sample calcined at 450 °C. In combination of the CO2-TPD and NH3-TPD results, it can be concluded that most of the surface hydroxyl groups condensate in the temperature range of 400–450 °C. Moreover, the high temperature peak observed on the NH3-TPD profile of WO3/ZrO2 calcined at 450 °C should not be due to condensation of surface hydroxyl groups. Instead, it corresponds to some strong acidic sites present on the sample.
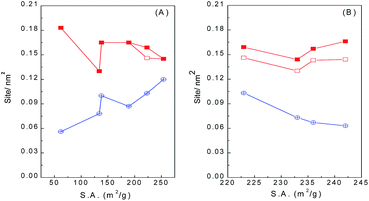
Table 2 summarizes the acid and base densities based on the desorption peak areas of NH3-TPD and CO2-TPD, respectively, of WO3/ZrO2 calcined at different temperatures. It is noticed that those calcined at 400–600 °C have acid densities in a close range of 0.145–0.165 sites per nm2, while those calcined at 700 and 800 °C have slightly lower and higher acid density of 0.130 and 0.183 sites per nm2, respectively. On the other hand, base densities decrease almost linearly with the increase of calcination temperature. As the surface area decreases with calcination temperature, Fig. 2 shows that the acid and base densities as a function of surface area varied in the reverse trend. Base density increases with surface area, while acid density decreases with surface area but merely in a narrow range. These results infer that the amount of basic sites increases more abruptly than that of acid sites with the increase of surface area, and the latter is almost linearly proportional to the surface area.
| Catalyst | Acid amount (1018 g−1) | Acid density (nm−2) | Base amount (1018 g−1) | Base density (nm−2) | Decay rateb (%/h) |
|---|---|---|---|---|---|
| a Values in parenthesis are strong acid sites (>500 °C on NH3-TPD profiles).b From the slopes of glycerol conversions vs. TOS based on TOS.c From the slopes of glycerol conversions vs. TOS based on TOS in 3–9 h.d From the slopes of glycerol conversions vs. TOS based on TOS 3–6 h in Fig. 3A.e From the slopes of glycerol conversions vs. TOS based on TOS 7–12 h in Fig. 5A. | |||||
| WO3/ZrO2-400 | 36.8 | 0.145 | 15.1 | 0.0595 | −0.32c |
| WO3/ZrO2-450 | 32.6 (2.9)a | 0.146 (0.013)a | 11.4 | 0.0510 | −0.39c/−1.37e |
| WO3/ZrO2-500 | 31.2 | 0.165 | 8.10 | 0.0430 | −0.70d |
| WO3/ZrO2-600 | 22.8 | 0.165 | 6.81 | 0.0494 | −2.00d |
| WO3/ZrO2-700 | 17.4 | 0.130 | 5.20 | 0.0388 | −7.50d |
| WO3/ZrO2-800 | 11.3 | 0.183 | 1.73 | 0.0279 | −9.50d |
| 1% NbWOx/ZrO2-450 | 30.3 (3.3) | 0.130 (0.014) | 8.46 | 0.0363 | −0.37e |
| 3% NbWOx/ZrO2-450 | 33.7 (3.3) | 0.143 (0.014) | 7.84 | 0.0332 | −0.14e |
| 5% NbWOx/ZrO2-450 | 34.8 (5.3) | 0.144 (0.022) | 7.57 | 0.0313 | −0.63e |
| Catalysts | Conversion (%) | Product selectivity (%) | ||||
|---|---|---|---|---|---|---|
| Acrolein | AD | AA | HA | Unknowns | ||
| a Reaction conditions: 290 °C, 0.3 g catalyst, GHSV = 1117 h−1, 60 mL min−1 N2 flow rate. AD = acetaldehyde; AA = allyl alcohol; HA = 1-hydroxylacetone. Selectivity for unknowns = (100 − known products)%. The selectivity data were obtained at TOS = 3–4 h, and those in parenthesis obtained at TOS = 11–12 h of reaction. | ||||||
| WO3/ZrO2-400 | 99 (95) | 62 (57) | 6 (4) | 2 (1) | 9 (18) | 21 (20) |
| WO3/ZrO2-450 | 99 (92) | 68 (70) | 6 (4) | 1 (2) | 9 (12) | 16 (12) |
| WO3/ZrO2-500 | 99 (79) | 71 (71) | 6 (5) | 2 (3) | 4 (9) | 17 (12) |
| WO3/ZrO2-600 | 99 (47) | 70 (68) | 4 (3) | 2 (3) | 7 (8) | 17 (18) |
| WO3/ZrO2-700 | 97 (17) | 69 (65) | 2 (1) | 2 (3) | 4 (6) | 23 (25) |
| WO3/ZrO2-800 | 87 | 63 | 1 | 1 | 6 | 29 |
Dalil's group has confirmed the coke formation at initial stage of gas phase glycerol dehydration, and the amount of coke deposited on WO3/TiO2 catalysts was found to increase with TOS.27–29 Since the selectivities of Unknowns over our catalysts are quite steady as a function of TOS (3–4 h vs. 11–12 h in Table 3). It is also consistent with the finding by Dalil's group.
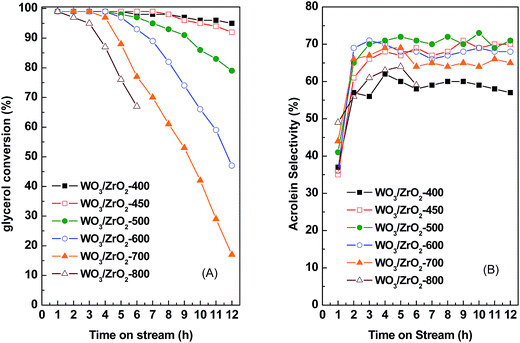
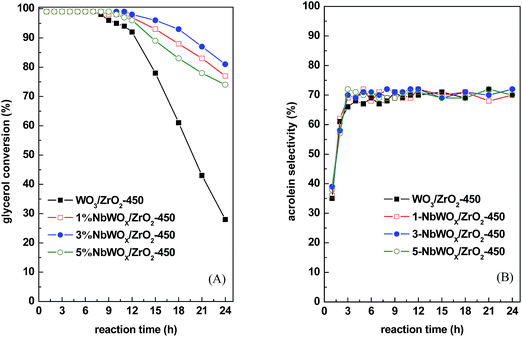
In comparison of WO3/ZrO2 calcined at different temperatures, those calcined at 450–700 °C give relatively higher acrolein selectivities of 68–71% (Fig. 1 and Table 3). Moreover, acrolein selectivities retain almost unchanged with TOS for catalysts calcined at 450–600 °C. For the catalyst calcined at lowest temperature, WO3/ZrO2-400, which contains the largest amounts of both acidic and basic sites, is most stable on TOS. However, the acrolein selectivity is among the lowest. In contrast, WO3/ZrO2 calcined at highest temperatures, WO3/ZrO2-700 and -800, have very fast decay rates and larger amounts of coke formation. Judging by the stabilities of the catalysts and high acrolein selectivities, the most suitable calcination temperature for WO3/ZrO2 catalyst is 450 °C. Therefore, the catalysts studied hereafter were calcined at 450 °C.
3.2 WO3/ZrO2 catalysts doping with niobium
Fig. S2 (ESI†) shows the SEM photographs of WO3/ZrO2-450 catalyst and those doped with 1% and 3% Nb2O5. All of them are aggregates of nanoparticles ca. 10 nm in diameter and hard to estimate the individual oxide particle size. It is apparent that the doping of 1–3 wt% Nb2O5 does not cause the drastic change of the morphology of WO3/ZrO2 oxides, and no particles of other morphologies can be seen. This result implies that Nb is probably distributed homogeneously in the oxides.
Fig. S3 (ESI†) shows the NH3- and CO2-TPD profiles of WO3/ZrO2-450 catalysts doped with different amounts of Nb2O5, in comparison with those of pristine WO3/ZrO2-450. Fig. S3(A) (ESI†) shows that all the samples have similar NH3 desorption profiles: a broad band covering from 100 to 450 °C and a weak peak appeared above 450 °C. The possibility that the high temperature peaks are due to the condensation of surface hydroxyl groups can be excluded because they do not show in the CO2-TPD profiles (Fig. S3(B), ESI†). Hence, the presence of the small high temperature peaks in NH3-TPD profiles implies that the materials contain a small amount of strong acidic sites, probably attributed to formation of Nb2O5 clusters. Nevertheless, the majority of the acidic sites is in the weak to medium strength region. The intensities of the low temperature peaks decrease when only 1 wt% Nb2O5 is doped, and contrarily increase when it is further increased to 3 and 5% (Fig. S3(A), ESI†). However, the positions of desorption maxima retain at almost the same temperature around 200 °C, implying no significant change in acid strength of the catalysts with niobium doping.
The CO2-TPD profiles in Fig. S3(B) (ESI†) show that the base amounts decrease markedly when as low as 1% Nb2O5 is doped on WO3/ZrO2-450. The decrease in base amount is attributed to that Nb would neutralize the basic sites present on the zirconia support.15 However, the change in base amounts is less significant as the doping amount of Nb is further increased. The phenomenon can be explained by that the influence of Nb is mostly in neutralization of surface acidity electronically instead of geometrically blocking the basic sites. Moreover, Fig. S3(B)† shows that the basic sites of strongest strength with the CO2 desorption peak appeared above 400 °C are suppressed completely, while those of weakest strength with the desorption peak appeared at 100–330 °C are partially suppressed and those around 380 °C are hardly affected by Nb-doping.
The acid and base densities estimated from the desorption peak areas of NH3-TPD and CO2-TPD of Nb-doped WO3/ZrO2-450 samples are also summarized in Table 2. The acid densities are almost unchanged (0.143–0.146 nm−2), except the one doped with 1% Nb2O5 has lower value of 0.130 nm−2, while the base density decreases from 0.0510 nm−2 to 0.0313–0.0363 nm−2 with Nb doping. Fig. 2B plots the acid/base densities on Nb-doped WO3/ZrO2-450 as a function of surface area. It clearly shows that the acid densities are constrained in a narrow range while the base densities decrease with the increase in surface areas.
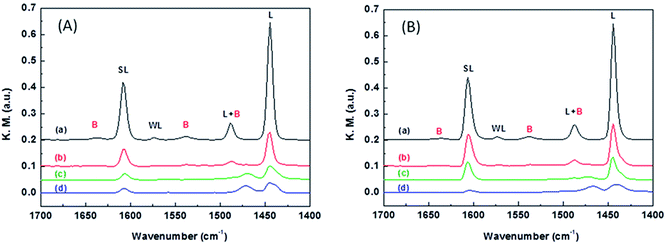
The nature of the acidic sites was examined by taking the FT-IR spectra of the catalysts after pyridine adsorption. Fig. 4 compares the FT-IR spectra of WO3/ZrO2-450 and that doped with 3% Nb2O5. At the desorption temperature of 100 °C, both samples show a strong peak at 1445 cm−1 attributing to pyridine adsorbed on the Lewis acid sites and a weak peak at 1545 cm−1 attributing to pyridine adsorbed on the Brønsted acid sites. In addition, the peaks at 1575 and 1610 cm−1 correspond to pyridine adsorbed on the weak and strong Lewis acid sites, respectively. At the desorption temperature of 300 °C, the 1545 cm−1 peak disappears completely while the 1445 and 1610 cm−1 peaks still retain some intensity for both samples. These results imply that both Nb2O5-doped and undoped WO3/ZrO2-450 materials contain mainly the Lewis acidic sites, and the strength of Lewis acidic sites is stronger than that of Brønsted acid sites. Moreover, 3% NbWO3/ZrO2-450 contains slightly larger amount of strong Lewis acidic sites than WO3/ZrO2-450, judging by the peak intensities of the FT-IR spectra taken at desorption temperatures of 200–300 °C.
| Catalysts | Conversion (%) | Product selectivity (%) | ||||
|---|---|---|---|---|---|---|
| Acrolein | AD | AA | HA | Unknowns | ||
| a Reaction conditions: 290 °C, 0.3 g catalyst, GHSV = 1117 h−1, 60 mL min−1 N2 flow rate. AD = acetaldehyde; AA = allyl alcohol; HA = 1-hydroxylacetone; selectivity for unknowns = (100 − known products)%. The selectivity data were data obtained at TOS = 3–4 h, and those in parenthesis obtained at TOS = 23–24 h of reaction. | ||||||
| WO3/ZrO2-450 | 99 (28) | 68 (70) | 6 (6) | 1 (3) | 9 (15) | 16 (6) |
| 1% NbWOx/ZrO2-450 | 99 (77) | 69 (70) | 8 (5) | 2 (2) | 11 (14) | 10 (9) |
| 3% NbWOx/ZrO2-450 | 99 (81) | 69 (72) | 7 (5) | 1 (2) | 9 (15) | 14 (6) |
| 5% NbWOx/ZrO2-450 | 99 (74) | 71 (70) | 8 (5) | 2 (3) | 11 (17) | 8 (5) |
3.3 Reusability of catalyst
The reusability of 3% NbWOx/ZrO2-450 catalyst was examined. The spent catalyst after reaction at 290 °C for 24 h was regenerated by calcination at 450 °C for 3 h to burn the coke disposed on the surface of the catalyst. Fig. S4 (ESI†) showed the TG profile of the used 3% NbWOx/ZrO2-450 catalyst obtained in air. The coke deposition on the used catalyst is about 19 wt%. Moreover, the profile indicates that 17 wt% is burned away at temperature below 450 °C and only 2 wt% coke is still remained after calcination at 450 °C. Fig. S5 (ESI†) compares the catalytic performances of the fresh and regenerated 3% NbWOx/ZrO2-450 catalysts. The results showed that the glycerol conversion and selectivity to acrolein are well retained even the catalyst is regenerated and reused for second time. The similar variation patterns in glycerol conversions and acrolein selectivities as a function of TOS provide a solid evidence that the initial low acrolein selectivities are due to that the system is not in dynamic stability, instead of rapid coke formation as proposed by Dalil et al.29 These results also infer that 2 wt% coke deposition on the 3% NbWOx/ZrO2-450 catalyst does not significantly vary the acid/base active sites and has negligible influence on the catalyst activity.3.4 Catalytic active sites
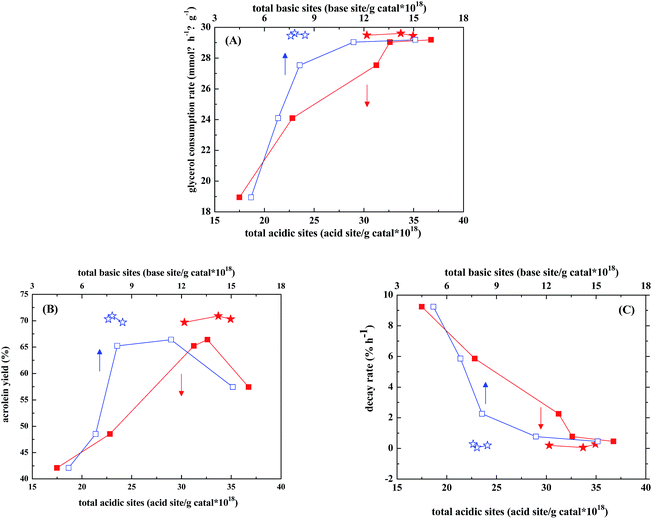
Zirconia is considered to be one of the amphoteric oxides and contains both acidic and basic sites on its surface. Addition of WO3 to zirconia was found to significantly decrease the amount of basic sites and slightly increase the acidic sites.30 When used as the catalysts in gas-phase dehydration of glycerol, ZrO2 gave complicated products with acetol (also known as hydroxylacetone, HA) as the largest portion of products (25% selectivity), while WO3/ZrO2 gave acrolein of 70% selectivity as the main product.31 Kinage et al.32 studies Na-doped metal oxides as the catalysts for glycerol conversion and proposed that the basic sites were responsible for HA formation. Chai et al.13 suggested that the strong acidic sites of Hammett constant in −8.2 to −3.0 were more efficient than those of medium to weak acid sites in acrolein formation. Besides, Lewis acids such as Al2O3 and Nb2O5 showed lower acrolein selectivities (ca. 40 mol%) than the materials containing Brønsted acids, such as supported phosphoric acid and heteropoly acid (60–70 mol%). On the other hand, the polyglycerols or acetalization products of glycerol were considered to form and be adsorbed on basic sites.33,34In our case, the glycerol consumption rate increases almost linearly with both amounts of acid and base sites, based on the catalytic results of WO3/ZrO2 calcined at different temperatures (Fig. 6A). Nevertheless, there are optimal amounts of acid and base sites to obtain the maximum acrolein yield (Fig. 6B), which are 31–33 × 1018 sites per g catal for acidic sites and 7–12 × 1018 sites per g catal for basic sites. This is in consistence with the observation by Stošić et al.30 that the selectivity of acrolein is largely governed by the balance between acidic and basic active sites. Fig. 6 also shows that when 1–5% Nb2O5 is doped in WO3/ZrO2-450, the acid amounts retain at relatively high values of 30–35 × 1018 sites per g catal, while the base amounts are shrunk in a narrower range of 7.5–8 × 10¹⁸ sites per g catal. Both are still in the range of the optimal amounts of acid and base sites to obtain the optimal acrolein yield.
In our case, most of the acidic sites on WO3/ZrO2-450 with and without doping Nb2O5 determined by pyridine adsorption are Lewis acid sites and the Brønsted acid sites are few and relatively weak. Therefore, Lewis acid sites seem to be the active sites for glycerol dehydration, and around 70% selectivities of acrolein are obtained. This finding is different from the literature reports that Lewis acids showed lower selectivities in the acrolein production than the materials containing Brønsted acids.13 However, under the reaction condition where a large amount of water is present, it cannot be excluded that some Brønsted acidity may be generated through coordinative interaction of water molecules with Lewis acid sites on the catalysts. On the other hand, Kinage et al.32 proposed that the basic sites were responsible for hydroxylacetone (HA) formation. Indeed, higher HA selectivities are obtained on the catalysts containing larger amounts of basic sites, such as WO3/ZrO2-400 and WO3/ZrO2-450 (Table 3).
As the decay rate is concerned, Fig. 6C shows that it decreases almost linearly with both amounts of acid and base sites, and those trends are in reverse to those of glycerol consumption rate. WO3/ZrO2-400 is the most stable catalyst among WO3/ZrO2 calcined at different temperatures (Fig. 3 and Table 3), while WO3/ZrO2-800 which contains lowest amounts of acid sites and almost no basic sites gives the lowest glycerol conversion, acrolein selectivity and faster decay rate. Since the acid sites, which are active for glycerol dehydration, are also active for coke formation, the fast decay rate observed over WO3/ZrO2-800 should be due to coking on the active sites. With the increasing amount of basic sites on WO3/ZrO2 catalysts, the decay rate slows down. Therefore, basic sites should contribute the suppression of coke formation.
For Nb-doped WO3/ZrO2-450, the product selectivities in 3–4 h TOS are almost unaffected upon Nb-doping, while the Unknowns selectivities decrease with decreasing the amount of basic sites. It has been proposed that too many basic sites would lead to formation of macromolecules, such as polyglycerols or acetalization products of glycerol.33,34 Therefore, fine tuning the amount of basic sites is important. This conclusion is demonstrated in Fig. 6, in which the glycerol consumption rate, acrolein selectivity and catalyst decay rate all vary more drastically with the base amount than acid amount, and the optimal acrolein selectivity is obtained in a narrower range of base amount than that of acid amount.
Fig. S6 (ESI†) intends to correlate glycerol consumption rate, acrolein yield, and catalyst decay rate as a function of acid and base densities on the surface in the unit of sites per nm2. No good correlation can be drawn, implying that the catalytic performance is less affected by the acid and base densities on the surface.
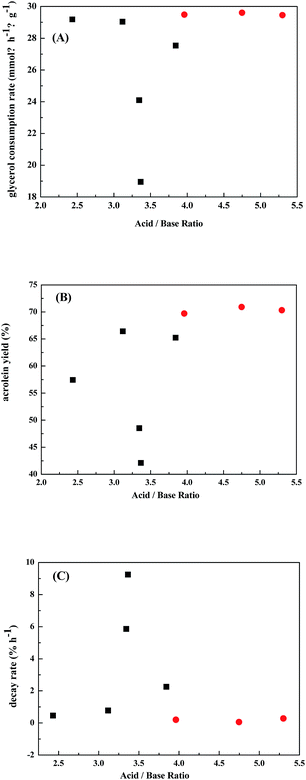
Fig. 7 correlates the catalytic performances with the ratio of acid/base sites. It shows the best performances are over Nb-doped WO3/ZrO2-450 catalysts which have acid/base ratios of 4.0–5.4. It is also noticed that there appears a narrow range of acid/base ratios of 3.25–3.5 giving lowest glycerol consumption rate, low acrolein yield, and fast catalyst decay rate. These results demonstrate again that fine tuning the ratio of acid/base sites is important in achieving good catalytic performance in gas-phase dehydration of glycerol to generate acrolein.
4. Conclusions
Total amounts of acid and base sites of WO3/ZrO2 catalysts prepared by impregnation method decreased with the increase of calcination temperature. In gas-phase dehydration of glycerol, the glycerol consumption rate increased almost linearly with total amounts of acid and base sites, while those calcined at 450–700 °C gave highest acrolein selectivities of 68–71%. Moreover, the decay rate of the catalysts slowed down with the increase of total amounts of acid and base sites. The most suitable calcination temperature for WO3/ZrO2 catalyst was 450 °C in consideration of high acrolein yield and long lifetime of the catalyst. Furthermore, the deactivation of the catalyst could be greatly improved by doping small amount of niobium. Most of the acidic sites on WO3/ZrO2-450 with and without doping Nb2O5 are Lewis acid sites and the Brønsted acid sites are few and relatively weak. The optimal catalytic performance was obtained over 3% NbWOx/ZrO2-450. The glycerol conversion was kept at 82% after 24 h. The improvement of catalyst is attributed to that basic sites on the ZrO2 support are neutralized by niobium. The glycerol consumption rate increases almost linearly with both amounts of acid and base sites. Nevertheless, there are optimal amounts of acid and base sites to obtain the maximum acrolein yield. Fine tuning the ratio of acid/base sites is important in achieving good catalytic performance in gas-phase dehydration of glycerol to generate acrolein. High glycerol consumption rate, high acrolein yield, and slow catalyst decay rate are observed over Nb-doped WO3/ZrO2-450 catalysts which have acid/base ratios of 4.0–5.4. The spent catalysts could be easily regenerated by calcination at 450 °C for 3 h, and the catalytic activities were well retained.Conflicts of interest
There are no conflicts to declare.Acknowledgements
Financial supports from Ministry of Science & Technology, Taiwan (104-2119-M-002-019) are gratefully acknowledged.Notes and references
- L. C. Meher, D. Vidya Sagar and S. N. Naik, Renewable Sustainable Energy Rev., 2006, 10, 248–268 CrossRef CAS.
- F. Yang, M. A. Hanna and R. Sun, Biotechnol. Biofuels, 2012, 5, 13 CrossRef CAS PubMed.
- B. Katryniok, S. Paul, M. Capron and F. Dumeignil, ChemSusChem, 2009, 2, 719–730 CrossRef CAS PubMed.
- S. Kahlbaum, FR Patent No. 695931, 1930.
- M. Watanabe, T. Iida, Y. Aizawa, T. M. Aida and H. Inomata, Bioresour. Technol., 2007, 98, 1285–1290 CrossRef CAS PubMed.
- H. Groll and G. Hearne, US Pat., No. 2042224 1936.
- H. Hoyt and T. Manninen, US Pat., No. 2558520 1951.
- A. Neher, T. Haas, A. Dietrich, H. Klenk and W. Girke, DE Patent No. 4238493, 1994.
- E. Tsukuda, S. Sato, R. Takahashi and T. Sodesawa, Catal. Commun., 2007, 8, 1349–1353 CrossRef CAS.
- S.-H. Chai, H.-P. Wang, Y. Liang and B.-Q. Xu, Appl. Catal., A, 2009, 353, 213–222 CrossRef CAS.
- J. L. Dubois, C. Duquenne and W. Hoelderich, WO 2006087083 2006.
- J. L. Dubois, C. Duquenne, W. Hoelderich and J. Kervennal, WO 2006087084 2006.
- S.-H. Chai, H.-P. Wang, Y. Liang and B.-Q. Xu, Green Chem., 2007, 9, 1130–1136 RSC.
- A. Ulgen and W. F. Hoelderich, Appl. Catal., A, 2011, 400, 34–38 CrossRef CAS.
- S.-H. Chai, H.-P. Wang, Y. Liang and B.-Q. Xu, J. Catal., 2007, 250, 342–349 CrossRef CAS.
- N. R. Shiju, D. R. Brown, K. Wilson and G. Rothenberg, Top. Catal., 2010, 53, 1217–1223 CrossRef CAS.
- M. Massa, A. Andersson, E. Finocchio and G. Busca, J. Catal., 2013, 307, 170–184 CrossRef CAS.
- Y. Y. Lee, K. A. Lee, N. C. Park and Y. C. Kim, Catal. Today, 2014, 232, 114–118 CrossRef CAS.
- P. Lauriol-Garbey, J. M. M. Millet, S. Loridant, V. Bellière-Baca and P. Rey, J. Catal., 2011, 281, 362–370 CrossRef CAS.
- P. Lauriol-Garbey, G. Postole, S. Loridant, A. Auroux, V. Belliere-Baca, P. Rey and J. M. M. Millet, Appl. Catal., B, 2011, 106, 94–102 CAS.
- P. Lauriol-Garbey, S. Loridant, V. Bellière-Baca, P. Rey and J.-M. M. Millet, Catal. Commun., 2011, 16, 170–174 CrossRef CAS.
- R. Znaiguia, L. Brandhorst, N. Christin, V. Bellière Baca, P. Rey, J.-M. M. Millet and S. Loridant, Microporous Mesoporous Mater., 2014, 196, 97–103 CrossRef CAS.
- A. Ulgen and W. Hoelderich, Catal. Lett., 2009, 131, 122–128 CrossRef CAS.
- A. Martínez, G. Prieto, M. A. Arribas, P. Concepción and J. F. Sánchez-Royo, J. Catal., 2007, 248, 288–302 CrossRef.
- C. García-Sancho, J. A. Cecilia, A. Moreno-Ruiz, J. M. Mérida-Robles, J. Santamaría-González, R. Moreno-Tost and P. Maireles-Torres, Appl. Catal., B, 2015, 179, 139–149 CrossRef.
- C.-J. Jia, Y. Liu, W. Schmidt, A.-H. Lu and F. Schüth, J. Catal., 2010, 269, 71–79 CrossRef CAS.
- M. Dalil, D. Carnevali, M. Edake, A. Auroux, J.-L. Dubois and G. S. Patience, J. Mol. Catal. A: Chem., 2016, 421, 146–155 CrossRef CAS.
- M. Dalil, M. Edake, C. Sudeau, J.-L. Dubois and G. S. Patience, Appl. Catal., A, 2016, 522, 80–89 CrossRef CAS.
- M. Dalil, D. Carnevali, J.-L. Dubois and G. S. Patience, Chem. Eng. J., 2015, 270, 557–563 CrossRef CAS.
- D. Stošić, S. Bennici, J.-L. Couturier, J.-L. Dubois and A. Auroux, Catal. Commun., 2012, 17, 23–28 CrossRef.
- J. H. Bitter, M. K. van der Lee, A. G. T. Slotboom, A. J. van Dillen and K. P. de Jong, Catal. Lett., 2003, 89, 139–142 CrossRef CAS.
- A. K. Kinage, P. P. Upare, P. Kasinathan, Y. K. Hwang and J.-S. Chang, Catal. Commun., 2010, 11, 620–623 CrossRef CAS.
- D. G. Barton, M. Shtein, R. D. Wilson, S. L. Soled and E. Iglesia, J. Phys. Chem. B, 1999, 103, 630–640 CrossRef CAS.
- C. García-Sancho, R. Moreno-Tost, J. Mérida-Robles, J. Santamaría-González, A. Jiménez-López and P. Maireles-Torres, Appl. Catal., A, 2012, 433, 179–187 CrossRef.
Footnote |
| † Electronic supplementary information (ESI) available: TPD-NH3 and CO2, TG profiles and catalyst reusability. See DOI: 10.1039/c7ra08154e |
| This journal is © The Royal Society of Chemistry 2017 |

