DOI:
10.1039/C7RA08150B
(Paper)
RSC Adv., 2017,
7, 45377-45384
Preparation of electrolyzed oxidizing water with a platinum electrode prepared by magnetron sputtering technique†
Received
24th July 2017
, Accepted 9th September 2017
First published on 22nd September 2017
Abstract
Electrolyzed oxidizing water (EO water) with low pH (2.2–2.7), high oxidation–reduction potential (ORP > 1100 mV), and available chlorine content (ACC) of 30–80 mg L−1 has an efficiently bactericidal activity and wide adaptability against many food-borne pathogens. EO water could be generated by electrolysis of a dilute NaCl solution in an electrolysis chamber with a Pt/Ti electrode. In this study, the Pt/Ti electrode was prepared by magnetron sputtering technique. The electrode surface has the characteristic of specific growth along the [111] direction. At the same time, the platinum electrodes prepared through thermal decomposition and electrodeposition as the control were also investigated. X-ray diffraction (XRD) and scanning electron microscopy (SEM) were employed to study the performances of these three types of Pt/Ti electrode. The effects of the physicochemical properties of the Pt electrodes on their electrochemical behaviors were studied. Furthermore, the values of pH, ORP, ACC, Cl− and the sterilization effect of EO water using these Pt electrodes as anode materials have been systematically discussed. In addition, the content of HClO, ClO−, O3 and dissolved oxygen in EO water using the Pt-MS electrode has also been reported in this article.
Introduction
Food-borne diseases, which are directly related to people's lives, safety, and health, are the most prominent health problems in the world. Therefore, a new food sterilization technique with wide adaptability, high efficiency, broad spectrum, and safety has a high demand in the food industry.1 The electrochemical technique, which could be attempted by both direct and indirect oxidation, is environment-friendly, low-cost, easily operated, and known to inactivate a wide variety of microorganisms ranging from bacteria to viruses and algae.2 Electrolyzed oxidizing water (EO water) has been proved to possess high bactericidal efficiency and broad-spectrum antimicrobial activity against many food-borne pathogens due to its low pH (2.2–2.7), high oxidation–reduction potential (ORP > 1100 mV), and available chlorine content (ACC) of 30–80 mg L−1. Hence, EO water could be used as an indirect oxidation electrochemical technique.3–14 In addition, the cost of EO water is only 0.05 $ per L,15 which is much less expensive compared with that of other substances such as glutaraldehyde, chlorine dioxide, hydrogen peroxide and ethanol.
EO water is generated by electrolysis of a dilute NaCl solution in an electrolysis chamber, where anode and cathode electrodes are separated by a membrane. In 2003, Hsu first explored the influence of velocity, salinity, and temperature on the preparation of EO water.16 However, the electrode material, which is the most important parameter in the preparation of EO water, has been barely investigated until now.17–19 The instantaneous current efficiency for the formation of active chlorine (ICEAC) strongly depends on the nature of the anode.20,21 At present, the electrode materials mainly include titanium-based dimensionally stable anode (DSA), Pt electrode and boron-doped diamond (BDD).17–19,22–25 DSAs are usually preferred over Pt and BDD to obtain a higher ICEAC.21 RuO2 electrode, which has been widely used in chlor-alkali industry as one of the DSA electrodes, has the best chlorine evolution activity.26,27 However, when the chloride ion content is low, such as in the process of EO water preparation (CNaCl < 0.1 wt%), RuO2 electrode has exhibited a poor stability, short service life, and low electrolytic efficiency. This is partly because RuO2 electrode has a good activity for not only chlorine evolution but also oxygen evolution in the dilute NaCl solution electrolysis.28 A large amount of oxygen generated from oxygen evolution reaction (OER) would destroy the anoxic solid solution structure on the electrode surface and lower the chlorine evolution reaction (CER) selectivity.21,29–31 The stability of IrO2 electrode is higher than that of RuO2 electrode, but the CER activity of IrO2 electrode is comparatively poor.32,33 Hence, the preparation of a multi-component composite oxide electrodes, such as IrO2–Ta2O5,17 RuO2–IrO2,34,35 RuO2–TiO2,35,36 RuO2–SnO2,37 Sb–SnO2,38 and Ru1−xZnxO2 (ref. 39) have become an inevitable alternative. However, the preparation methods for the composite oxide electrodes are complex. The electrode composition and morphology are not easy to achieve in a controllable manner. Therefore, in the preparation of EO water, the Pt electrode, which has a good selectivity and stability for CER, is still widely used.
The conventional methods for preparing Pt/Ti electrodes are electrodeposition and thermal decomposition. However, in these two methods, slight attention has been paid to the crystal structure of the platinum electrode. Thus far, there are only a few studies reported on the influence of the crystal surface structure on the activity of CER. In addition, the Pt/Ti electrodes prepared by these two methods had a large particle size and uneven distribution, which have resulted in the low platinum utilization efficiency and high manufacturing costs. In contrast, magnetron sputtering is a new method for preparing the thin film materials. It could not only achieve a fine particle size and smooth surface but also exhibits special surface morphology and structure by controlling magnetron sputtering process.40–43
In this study, the Pt/Ti electrode was prepared by magnetron sputtering technique. The electrode surface has the characteristic of specific growth along the [111] direction. XRD and SEM were employed to study the performance of the three types of prepared Pt electrode. The effects of the physicochemical properties of the Pt electrodes on their electrochemical behaviors were studied. Furthermore, the values of pH, ORP, ACC, Cl− and the sterilization effect of EO water using these Pt electrodes as anode materials have been systematically discussed. In addition, the content of HClO, ClO−, O3 and dissolved oxygen in EO water using Pt-MS electrode has also been reported in this article.
Experimental
Materials
Platinum target (Pt ≥ 99.99%) was purchased from SKY Technology Development Co., Ltd, Shenyang, China. Acetone (CH3COCH3, AR), sodium carbonate (Na2CO3, AR), sodium chloride (NaCl, AR), dinitrodiammineplatinum ammoniacal (Pt(NH3)2(NO2)2, AR), aminosulfonic acid (NH2SO3H, AR), sodium citrate (Na3C6H5O7·2H2O, AR), ammonium sulfamate (NH2SO3NH4, AR), hydrochloroplatinic acid (H2PtCl6, AR), ethanol (C2H5OH, AR), isopropanol (C3H7OH, AR) and sulphuric acid (H2SO4, AR) were purchased from Sinopharm Chemical Reagent Co., Ltd., Shanghai, China. All reagents were analytical grade and used without further purification. Argon gas (99.999%) was purchased from Ming-Hui Company.
Electrode preparation
A titanium plate (grade TA1) was sandblasted, degreased in acetone and sodium carbonate with ultrasonication and utilized as the electrode substrate. The Pt-MS electrode was prepared by the magnetron-sputtering (MS) synthesis. The Ti plate was disposed on a sample stage in a vacuum chamber. The vacuum chamber was evacuated to 6.6 × 10⁻⁴ Pa and then a uniform film was obtained with gas pressure 1.5 Pa, at sputtering power 40 W and sputtering time 5 min. The Pt-ED electrode was prepared by electrodeposition (ED) with dinitrodiammineplatinum ammoniacal as an electrolyte and aminosulfonic acid, sodium citrate and ammonium sulfamate as the additives. The electrode was electroplated at current density 10 mA cm−2 and temperature 85 °C for 30 min. The Pt-TD electrode was prepared by thermal decomposition (TD) with 0.2 mol L−1 H2PtCl6/ethanol-isopropanol solution. The Ti plate was impregnated in the precursor solution for 20 s, and then slowly removed from the precursor solution at 1 mm s−1. A uniform liquid film was formed on the surface of the Ti substrate under the effect of viscosity and gravity. Next, the electrode was dried to evaporate the solvent at 130 °C for 10 min and then placed in a muffle furnace at 450 °C for 10 min. On cooling to room temperature, the electrode was coated again. This procedure was repeated 10 times. For the last time, the total duration of thermal oxidation was 1 h.
Material characterization
X-ray diffraction (XRD) was used to analyze the structure of the electrode coating. The inspection was carried out at room temperature on a XRD-7000 X-ray diffractometer (Shimadzu, Japan), using Cu Kα radiation (λ = 0.15405 nm) operating at 40 kV and 30 mA. The surface morphology was characterized by scanning electron microscopy (SEM, S-3000N, Hitachi Co., Japan).
Electrochemical measurements
The electrochemical experiments were carried out on a CHI 760D electrochemical analyzer at 30 °C. All of the electrochemical measurements were carried out in a typical three-electrode electrochemical glass cell: a carbon paper was used as a counter electrode, a reversible hydrogen electrode (RHE) as the reference electrode, and the Pt electrode (Pt-MS, Pt-TD, and Pt-ED) as a working electrode. For the electrochemical tests, the surface of the specimen was covered with epoxy resin except for the working area (1 cm2) on one side. Cyclic voltammetry (CV) measurements were performed from 0.03 to 1.3 V in 0.5 mol L−1 H2SO4 solution at a scan rate of 50 mV s−1. The linear sweep voltammetry (LSV) was used as a systematic and effective method to investigate the electrochemical activity of the prepared electrocatalysts. On obtaining a stable cycle, the CER polarization curves were measured by sweeping the potential from 1.00 to 1.45 V (vs. RHE) at a scan rate of 5 mV s−1 in 4.0 M NaCl (pH = 1.0). The OER polarization curves were obtained by sweeping the potential from 1.0 to 1.85 V (vs. RHE) at a scan rate of 5 mV s−1 in 0.5 mol L−1 H2SO4 solution.
EO water preparation and analysis
The generation of EO water involved the electrolysis of NaCl (0.5 wt%) in an anion-exchange membrane electrolytic cell separated by an anion membrane. The anode was the Pt/Ti electrode and the cathode was the Ti plate. The current density was 100 mA cm−2 and the electrolysis time was 10 min. The values of pH and ORP of EO water were analyzed by a pH meter (3-Star, Thermo Orion). The concentration of total active chlorine dissolved in the solution was determined using the TMB (3,3′,5,5′-tetramethylbenzidine) colorimetric method. In this method, TMB was oxidized to form a yellow product and its concentration was analyzed immediately using a spectrophotometer (UV-2102PC, UNICO, US) at 450 nm. The content of HClO, ClO− and O3 was measured directly using a spectrophotometer at wavelength of 233 nm, 292 nm, and 258 nm, respectively, with the absorption coefficient ε of 100, 365, and 2900, respectively. The content of Cl− was measured by potentiometric titration with Ag electrode and Hg/Hg2Cl2/KCl(Sat) reference electrode. Dissolved oxygen was measured by a dissolved oxygen meter (Oxi340/SET, Germany). They were measured three times and the average values were obtained.
Bactericidal effect of EO water
Escherichia coli (O157:H7) and Bacillus subtilis var. niger (ATCC 9372) (purchased from China General Microbiological Culture Collection Center) were employed as indicator bacteria in all disinfection experiments. The initial population of E. coli and B. subtilis for each disinfection experiment was approximately 9.36 log CFU mL−1 and 7.26 log CFU mL−1, respectively. During the experiments, 1.0 mL bacterial suspension was mixed with 9.0 mL EO water in a sterile tube and immediately quenched with an excess Na2S2O3 (10 mmol L−1) for 30 min to eliminate the residual disinfectants in the sample solution. The survival of bacteria was determined by the colony counting method using a tryptic soy agar (TSA) plate with serial dilutions in Butterfield's phosphate buffer (pH 7.2–7.4). To prepare the counting plate, 1 mL of each appropriate dilution of bacterial culture was mixed carefully with 15 mL TSA at 45–47 °C and then transferred to a Petri dish at ambient temperature for solidification. After complete solidification, an overlay was formed by pouring 5 mL to 10 mL Violet Red Bile Agar (VRBA) onto the surface of the inoculated medium. The plates were incubated at 35 °C for 48 h and the colonies formed on the plates were counted. Significant differences between treatments were established at a significance level of p = 0.05.
Results and discussion
The morphologies and structures of the Pt electrodes prepared by the three methods were characterized and shown in Fig. 1. As displayed in Fig. 1a, the surface of the Pt-MS electrode is very flat, in which the primary particles are approximately spherical with an average diameter of about 20–30 nm as shown in the inset of Fig. 1a. The Pt-TD electrode has a vertical surface structure, which is accompanied by numerous tiny platinum particles with sizes of about 150–200 nm as shown in Fig. 1b and its inset. The surface of the Pt-ED electrode is smooth and compact as shown in Fig. 1c with large particle size is (1–2 μm) as shown in the inset of Fig. 1c.
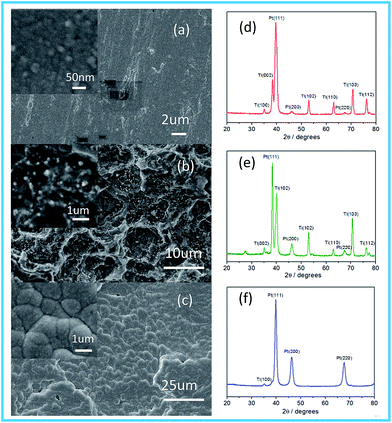 |
| | Fig. 1 SEM images show the morphologies of the Pt electrodes: Pt-MS (a); Pt-TD (b); and Pt-ED (c). X-ray diffraction curves for Pt electrodes: Pt-MS (d); Pt-TD (e); and Pt-ED (f). | |
The crystal structures of the Pt electrodes were characterized by XRD (Fig. 1d–f). The characteristic diffraction peaks of (111), (200), and (220) crystal facets are observed clearly, indicating that the Pt-ED, Pt-TD, and Pt-MS electrodes possess the face-centered cubic (fcc) crystal structure compared with JCPDS no. 04-0802. The intensity ratio of (111), (200), and (220) diffraction peaks is about 3.5![[thin space (1/6-em)]](https://www.rsc.org/images/entities/char_2009.gif) :
:![[thin space (1/6-em)]](https://www.rsc.org/images/entities/char_2009.gif) 1.2
1.2![[thin space (1/6-em)]](https://www.rsc.org/images/entities/char_2009.gif) :
:![[thin space (1/6-em)]](https://www.rsc.org/images/entities/char_2009.gif) 1.0 for the Pt-ED electrode, which is close to the intensity ratio of 3.2
1.0 for the Pt-ED electrode, which is close to the intensity ratio of 3.2![[thin space (1/6-em)]](https://www.rsc.org/images/entities/char_2009.gif) :
:![[thin space (1/6-em)]](https://www.rsc.org/images/entities/char_2009.gif) 1.7
1.7![[thin space (1/6-em)]](https://www.rsc.org/images/entities/char_2009.gif) :
:![[thin space (1/6-em)]](https://www.rsc.org/images/entities/char_2009.gif) 1.0 as in JCPDS no. 04-0802. However, the intensity ratios of the Pt-TD and Pt-MS electrodes are 13.4
1.0 as in JCPDS no. 04-0802. However, the intensity ratios of the Pt-TD and Pt-MS electrodes are 13.4![[thin space (1/6-em)]](https://www.rsc.org/images/entities/char_2009.gif) :
:![[thin space (1/6-em)]](https://www.rsc.org/images/entities/char_2009.gif) 2.0
2.0![[thin space (1/6-em)]](https://www.rsc.org/images/entities/char_2009.gif) :
:![[thin space (1/6-em)]](https://www.rsc.org/images/entities/char_2009.gif) 1.0 and 34.9
1.0 and 34.9![[thin space (1/6-em)]](https://www.rsc.org/images/entities/char_2009.gif) :
:![[thin space (1/6-em)]](https://www.rsc.org/images/entities/char_2009.gif) 1.4
1.4![[thin space (1/6-em)]](https://www.rsc.org/images/entities/char_2009.gif) :
:![[thin space (1/6-em)]](https://www.rsc.org/images/entities/char_2009.gif) 1.0, respectively. This is far from the data of JCPDS no. 04-0802, indicating that they have a (111) dominated crystalline structure. It could be related to their preparation methods. In the magnetron sputtering technique, the sputtering power will affect the orientation of the planes of the metal. When the sputtering power is low, the close-packed plane crystal at low energy would be preferentially formed. Pt has a face-centered cubic structure and its (111) crystal surface would preferentially form on the substrate surface. With the increase of sputtering power, other crystal planes will grow gradually. The peak position (θmax) and the peak width (B2θ) were obtained from the curve fitting and used for the calculation of particle size (d) according to the Scherrer formula (d = 0.94λ/B2θ
1.0, respectively. This is far from the data of JCPDS no. 04-0802, indicating that they have a (111) dominated crystalline structure. It could be related to their preparation methods. In the magnetron sputtering technique, the sputtering power will affect the orientation of the planes of the metal. When the sputtering power is low, the close-packed plane crystal at low energy would be preferentially formed. Pt has a face-centered cubic structure and its (111) crystal surface would preferentially form on the substrate surface. With the increase of sputtering power, other crystal planes will grow gradually. The peak position (θmax) and the peak width (B2θ) were obtained from the curve fitting and used for the calculation of particle size (d) according to the Scherrer formula (d = 0.94λ/B2θ![[thin space (1/6-em)]](https://www.rsc.org/images/entities/char_2009.gif) cos
cos![[thin space (1/6-em)]](https://www.rsc.org/images/entities/char_2009.gif) θmax), where λ is 1.5406 Å. The average size of the Pt-MS electrode prepared in the present study was thus calculated to be about 8.6 nm based on the peak width of the well-shaped (220) reflection.
θmax), where λ is 1.5406 Å. The average size of the Pt-MS electrode prepared in the present study was thus calculated to be about 8.6 nm based on the peak width of the well-shaped (220) reflection.
The ACC is one of the most important characteristics of EO water. Generally, the high ACC of EO water would result in an efficiently bactericidal activity. Therefore, the electrode materials which could produce more available chlorine under the same electrolytic conditions are expected to be better. From Fig. 2, it is clear that EO water has the maximum value of ACC of 74 mg L−1 when the Pt-MS electrode is used as an anode, which is higher than that when the Pt-TD electrode (64 mg L−1) and Pt-ED electrode (44 mg L−1) are used. From the above data, it could be inferred that the Pt-MS electrode has the best performance for the EO water preparation.
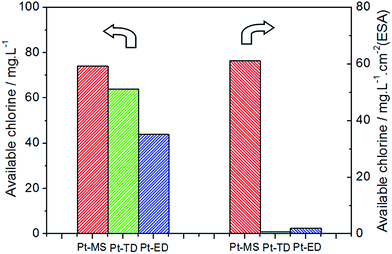 |
| | Fig. 2 The available chlorine content (ACC) of EO water prepared by Pt-MS (red), Pt-TD (green) and Pt-ED (blue) electrodes with the NaCl electrolyte (0.5 wt%), the current density of 100 mA cm−2 and the electrolysis time of 10 min in an anion-exchange membrane electrolytic cell. | |
As we all know, the electrochemical performance is affected by the electrochemical active surface area (ESA) of the electrode. The ESA represents the number of active sites that participate in the electrochemical reaction. Therefore, the ESAs of the three platinum electrodes had been measured and shown in Fig. 3 and S1.† The ESA of the Pt-MS electrode is only 1.21 cm2 due to its smooth surface and low platinum content, which is much lower than that of the Pt-TD (84.95 cm2) and Pt-ED (22.45 cm2) electrodes. If the ACC is further normalized to the ESA of the electrode, the efficiency of the Pt-MS electrode in ESA unit is very high, which is 61.9 times and 31.2 times higher than that of the Pt-TD electrode and Pt-ED electrode, respectively (Fig. 2). Such high activity of the Pt-MS electrode could be attributed to the following reasons. First, the Pt-MS electrode itself has a good electrochemical activity due to its (111) plane dominated structure, which is beneficial to the desorption and diffusion of chlorine in the EO water preparation. Second, is the high utilization of Pt atoms on the electrode surface. Tiny and closely arranged Pt particles cause most of the platinum to be exposed on the electrode surface. Thus, it could effectively achieve the adsorption of chloride ion on each Pt particle and lead to the next electrochemical reaction. Third, as suggested in the literature,31 the formation of gas channels is necessary to enable a sufficiently fast chlorine removal at high current densities from the electrode. An open surface morphology of the Pt-MS electrode is considered beneficial for gas bubble transport from the electrode surface into the solution to form available chlorine.
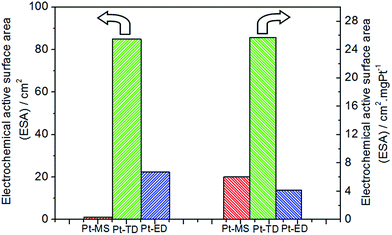 |
| | Fig. 3 Electrochemical active surface areas (ESAs) of Pt-MS (red), Pt-TD (green) and Pt-ED (blue) electrodes. | |
In addition, the ESA of the electrode was determined based on the preparation method and the platinum weight. In order to compare the effect of the preparation methods on the ESA, it was normalized to the platinum content. As shown in Fig. 3, the ESA of a unit mass of the platinum of the Pt-MS electrode is similar to that of the Pt-ED electrode, which suggests that the electrode surfaces obtained by electrodeposition and magnetron sputtering techniques are very similar. Both of them have closely arranged structures (Fig. 1a and c), so their ESAs of a unit mass of the platinum are similar. However, the Pt-TD electrode has a special honeycomb structure, which has effectively increased its ESA of a unit mass of the platinum. Hence, the ESA of a unit mass of the platinum of the Pt-TD electrode is 4.25 and 6.19 times higher than that of the Pt-MS and Pt-ED electrodes, respectively.
In order to further explain the relationship between the ACC of EO water and the electrocatalytic activity of CER in the electrolysis process, the LSV measurements were performed using a three-electrode system in 4.0 M NaCl (pH = 1.0) with a scan rate of 5 mV s−1. It is a systematic and effective method to investigate the electrochemical activity of the electrocatalysts. In the linear potential sweep curves, the anodic currents of the three platinum electrodes appeared from 1.35 V, which are close to the thermodynamic potential of CER. This shows that the CERs on the three platinum electrodes are easy to occur and the onset overpotential is low. As expected and clearly represented in Fig. 4, with the increase of the potential, the CER activity of the Pt-MS (or Pt-TD) electrode is clearly superior to that of the Pt-ED electrode. For instance, to obtain a current density of 10 mA cm−2 in a geometric surface area (GSA), the potentials of 1.46 V and 1.43 V are required for the Pt-ED and Pt-MS (or Pt-TD) electrodes. This is because both Pt-MS electrode and Pt-TD electrode have a common feature, that is, the (111) plane is the main crystal surface. It is generally accepted that the CER on the Pt electrode conforms to the Volmer–Heyrovsky mechanism.44–47 The reaction process is divided into two steps (eqn(1) and (2)), in which the step (2) is the speed control of the reaction. S represents the active site of chloride evolution reaction. An ordered structure along the (111) direction would facilitate the desorption of Clad and the diffusion of Cl2.
| | |
S + Cl− → S − Cl˙ + e
| (1) |
| | |
S − Cl˙ + Cl− → S + Cl2 + e
| (2) |
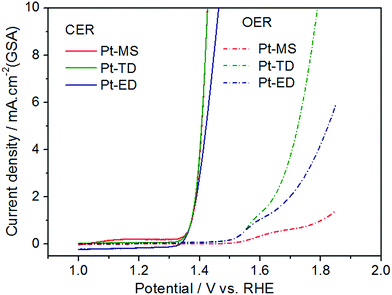 |
| | Fig. 4 Linear sweep voltammetry curves (LSVs) of Pt-MS (red), Pt-TD (green) and Pt-ED (blue) electrodes in 4.0 M NaCl (pH = 1.0) and 0.5 M H2SO4 at a sweeping rate of 5 mV s−1. | |
In addition to the CER, the OER has also occurred simultaneously in the anode region. The OER is a side reaction, which needs to be minimized or even completely eliminated. This is the case in a CER in which selectivity is a major concern. As could be observed from Fig. 4, the OER activity of the three platinum electrodes is very different from each other. Among them, the OER activity of the Pt-TD electrode is the highest due to its high ESA, which would lead to a decrease in the CER selectivity. However, the Pt-MS electrode has the lowest OER activity because of its ultra-low ESA. The low OER activity of the Pt-MS electrode is favorable for the chlorine evolution on the electrode surface, which suggests that the Pt-MS electrode has a good selectivity for chlorine evolution. Therefore, the more ACC of EO water would be obtained using the Pt-MS electrode as the anode than the other two Pt electrodes (Fig. 2).
LSV electrochemical characterizations have proved that the Pt-MS electrode has the best selectivity for chlorine evolution. In the preparation of EO water, a good selectivity of chlorine evolution means that chloride ions are more likely to lose electrons into high valent chloric compounds in the anode region. Various forms of chloric compounds are produced by CER in this region. The main reaction equations provided below (eqn(3)–(6)). The more chloric compounds are produced, the less residual chlorine ions are present in the solution. As shown Fig. 5, the residual chloride ion concentration of the Pt-MS electrode is the minimum, indicating that the electrolysis efficiency of the Pt-MS electrode is higher than those of the Pt-TD and Pt-ED electrodes.
| | |
2H2O + Cl2 − 2e− → 2HOCl + 2H+
| (4) |
| | |
2Cl− + 2O3 − e− → Cl2↑ + 3O2↑
| (5) |
| | |
OH− + Cl− − 2e− → HOCl
| (6) |
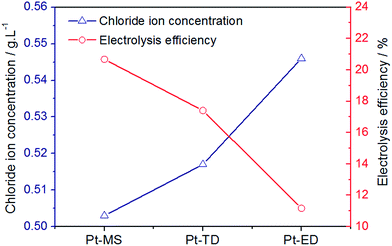 |
| | Fig. 5 The content of residual chloride ion in EO water and electrolysis efficiency prepared by Pt-MS, Pt-TD and Pt-ED electrodes. | |
The pH and ORP values of EO water, prepared by the three Pt electrodes, are listed in Table 1. The pH values of EO water prepared by three Pt electrodes are in the order Pt-MS > Pt-MD > Pt-TD, indicating that the hydrogen ion concentration prepared by the three Pt electrode materials are in the order Pt-TD > Pt-MD > Pt-MS. It is consistent with their oxygen evolution activity (Fig. 4) because hydrogen ions are mainly derived from the anodic oxygen evolution reaction (eqn(7)–(11)). Furthermore, a small amount of hydrogen ions is derived from anodic chlorine evolution reactions (eqn(4) and (6)).
| | |
2H2O − 4e− → 4H+ + O2
| (8) |
| | |
4OH− − 4e− → 2H2O + O2↑
| (9) |
| | |
3H2O − 6e− → O3↑ + 6H+
| (10) |
| | |
O2 + H2O − 2e− → O3↑ + 2H+
| (11) |
Table 1 The pH and ORP values of EO water with different Pt/Ti electrodes
| Electrode material |
pH |
ORP/mV |
| Pt-MS |
2.13 |
1145 |
| Pt-TD |
2.03 |
1146 |
| Pt-ED |
2.08 |
1095 |
For oxidation-reduction potential (ORP) of EO water, the major redox reactions are (3) and (9), for which the standard electrode potentials of φ (Cl2/Cl−) and φ (O2, H+/H2O) are 1359 mV and 1229 mV, respectively. The ORP values of the Pt-MS and Pt-TD electrodes are similar, which are higher than that of the Pt-ED electrode. It is proportional to the ACC in EO water. The ACC values of the Pt-MS and Pt-TD electrodes are higher, so the ORP values are higher.
Through the above analysis, it could be concluded that the Pt-MS electrode is a suitable anode material for the preparation of EO water. Furthermore, the bactericidal effects of EO water prepared by the three platinum electrodes were further investigated. Since the EO water prepared by the three platinum electrodes have different ACC values in the range of 49–81 mg L−1 (Table S1†), the bactericidal efficiencies of EO water toward Bacillus subtilis var. niger are clearly different. The bactericidal efficiency of EO water prepared by the Pt-MS electrode is significantly higher than those of the other two electrodes. But for Escherichia coli, they have similar germicidal efficacy. This is because the bacteria activity of Escherichia coli is not so vigorous. Even if the ACC of EO water is not so high, the bactericidal efficiency remains high. On the whole, the EO water prepared by the Pt-MS electrode has high bactericidal activity, which could efficiently kill both Escherichia coli and Bacillus subtilis var. niger. As could be seen from Table 2, the killing rate of Escherichia coli was 100% after 2 min treatment. The killing rate of Bacillus subtilis var. niger reached 99.99% and the killing value reached 4.26 log CFU mL−1 after 30 min.
Table 2 Sterilization effect of EO water prepared by the Pt-MS electrodea
| Bacteria |
Killing time/min |
Killing rate/% |
Killing logarithm value /log CFU mL−1 |
| Escherichia coli, 9.36 log CFU mL−1; Bacillus subtilis var. niger, 7.26 log CFU mL−1; ND, not detected. |
| Escherichia coli |
1 |
99.99998 |
6.70 |
| 2 |
100 |
ND |
| 5 |
100 |
ND |
| Bacillus subtilis var. niger |
5 |
99.83791 |
2.79 |
| 15 |
99.93791 |
3.21 |
| 30 |
99.99456 |
4.26 |
HClO is the most effective bactericidal factor in various forms of oxidized chlorine. The sterilization efficiency of HClO is 80 times higher than that of ClO−. Therefore, it is very important to investigate the content of HClO in total available chlorine. The inset of Fig. 6 shows an ultraviolet visible absorption spectrum of EO water. It is known that the UV absorption of HClO and ClO− is at 233 nm and 292 nm, respectively (the inset of Fig. 6). The molar absorption coefficient ε of HClO and ClO− is 100 and 365, respectively. Therefore, their content could be calculated and the relationship between the ACC and the HClO content is obtained. As could be observed from Fig. 6, the main component of the available chlorine in EO water is HClO, which is close to 90%. The content of ClO− is only 6%. In addition, the existing form of available chlorine would change by varying pH values of EO water. It could be observed from Fig. 7 that the absorbance at 233 nm decreases significantly as the pH value increases gradually, while the absorbance at 292 nm increases continuously. It indicates that the existing form of available chlorine in EO water has changed. When the pH value increases, the content of HClO has reduced, while the content of ClO− has gradually increased. It would decrease the bactericidal efficiency of EO water. Therefore, the pH value of EO water must be controlled within a certain range to prevent the decrease in content of HClO. In addition, as illustrated in Fig. 7, when the pH value is between 2.58 and 6.02, there is only a small difference among the UV absorption spectra. It shows that when EO water remains acidic, the existing form of available chlorine does not change and the bactericidal efficiency is not greatly affected. This is in agreement with the results of Park et al.,48 which show that when the pH value of EO water is between 2.58 and 7.03, the bactericidal effect is the same for Escherichia coli O157:H7 and Listeria monocytogenes.
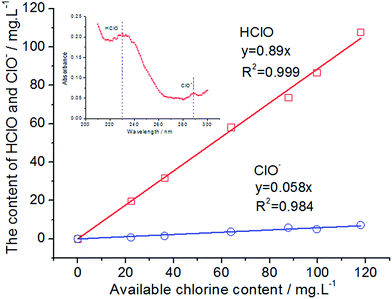 |
| | Fig. 6 The content of HClO and ClO− in EO water with different available chlorine contents. | |
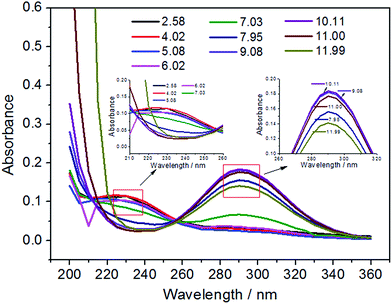 |
| | Fig. 7 The ultraviolet visible absorption spectra of EO water with different pH values. | |
In the preparation of EO water, a small number of oxygenated compounds, such as ozone and oxygen, which would also be beneficial for enhancing fungicidal activity, were formed. Fig. 8 displays the content of ozone and dissolved oxygen in EO water prepared by the Pt-MS electrode. As could be observed from this diagram, with the increase of the ACC, the content of ozone and dissolved oxygen has gradually increased. However, compared with the ACC, the total content of ozone and dissolved oxygen is very small. It further indicates that the Pt-MS electrode has a high selectivity for chlorine evolution.
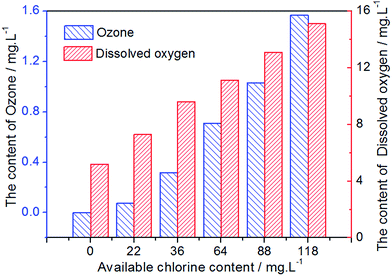 |
| | Fig. 8 The content of ozone and dissolved oxygen in EO water with different available chlorine contents. | |
Conclusions
In the present study, the Pt/Ti electrode was prepared by magnetron sputtering technique. The research suggests that the Pt-MS electrode has a very excellent electrocatalytic activity for chloride evolution due to its ordered structure along the (111) direction of the crystal, which facilitates the desorption and diffusion of chlorine. With the Pt-MS electrode as an anode, EO water is efficiently produced by electrolysis of a dilute NaCl solution. The Pt-MS electrode has the highest CER activity and the lowest OER activity, which suggests that it has a good selectivity for chlorine evolution. EO water has the maximum value of ACC with the Pt-MS electrode, compared to that of the Pt-TD and Pt-ED electrodes. Furthermore, the values of HClO, ClO−, Cl−, O3, O2, pH and ORP of EO water using the Pt-MS electrode were comprehensively detected and analyzed. They have proved that the Pt-MS electrode is well suited for the preparation of EO water. In addition, EO water prepared by the Pt-MS anode could efficiently kill Escherichia coli and Bacillus subtilis.
Conflicts of interest
There are no conflicts to declare.
Acknowledgements
The authors would like to acknowledge the financial support from the Scientific Research Project of Education Department of Hubei Province of China (D20171703).
Notes and references
- S. M. E. Rahman, I. Khan and D.-H. Oh, Compr. Rev. Food Sci. Food Saf., 2016, 15, 471–490 CrossRef.
- E. Brillas, I. Sirés and M. A. Oturan, Chem. Rev., 2009, 109, 6570–6631 CrossRef CAS PubMed.
- W. Q. Zhu, B. Q. Zhu, Y. Li, Y. Y. Zhang, B. L. Zhang and J. F. Fan, Food Chem., 2016, 197, 141–149 CrossRef CAS PubMed.
- M. Mikš-Krajnik, L. X. J. Feng, W. S. Bang and H.-G. Yuk, Food Control, 2017, 74, 54–60 CrossRef.
- C. L. Zhang, W. Cao, Y.-C. Hung and B. M. Li, Food Control, 2016, 69, 147–152 CrossRef CAS.
- I. Machado, A. Meireles, R. Fulgêncio, F. Mergulhão, M. Simões and L. F. Melo, Food Bioprod. Process., 2016, 98, 333–340 CrossRef CAS.
- J. X. Hao, T. J. Wu, H. Y. Li, W. Wang and H. J. Liu, Food Chem., 2016, 201, 87–93 CrossRef CAS PubMed.
- H. Qi, Q. G. Huang and Y.-C. Hung, Food Chem., 2018, 239, 561–568 CrossRef CAS PubMed.
- Y. H. Chen, Y.-C. Hung, M. Y. Chen and H. T. Lin, LWT--Food Sci. Technol., 2017, 84, 650–657 CrossRef CAS.
- S. G. Shiroodi, M. Ovissipour, C. F. Ross and B. A. Rasco, Food Control, 2016, 60, 401–407 CrossRef.
- K. Luo and D.-H. Oh, Food Microbiol., 2016, 53, 165–171 CrossRef CAS PubMed.
- X. M. Wang, V. M. Puri, A. Demirci and R. E. Graves, J. Food Eng., 2016, 170, 144–159 CrossRef CAS.
- X.-T. Xuan, Y.-F. Fan, J.-G. Ling, Y.-Q. Hu, D.-H. Liu, S.-G. Chen, X.-Q. Ye and T. Ding, Food Control, 2017, 73, 1483–1489 CrossRef CAS.
- C. N. Tango, I. Khan, P.-F. N. Kounkeu, R. Momna, M. S. Hussain and D.-H. Oh, Food Microbiol., 2017, 67, 97–105 CrossRef CAS PubMed.
- Y. Sakurai, M. Nakatsu, Y. Sato and K. Sato, Digestive Endoscopy, 2003, 15, 19–24 CrossRef.
- S. Y. Hsu, J. Food Eng., 2003, 60, 469–473 CrossRef.
- Z. D. Ren, S. S. Quan, J. Gao, W. Y. Li, Y. C. Zhu, Y. Liu, B. Chai and Y. R. Wang, RSC Adv., 2015, 5, 8778–8786 RSC.
- X. P. Zeng, M. Zhang, X. D. Wang, X. Y. Chen, X. Z. Su and W. W. Tang, J. Electroanal. Chem., 2012, 677–680, 133–138 CrossRef CAS.
- W. W. Tang, Y. F. Li, W. H. Li, X. J. Chen and X. P. Zeng, LWT--Food Sci. Technol., 2016, 66, 606–614 CrossRef CAS.
- C. A. Martínez-Huitle and E. Brillas, Angew. Chem., Int. Ed., 2008, 47, 1998–2005 CrossRef PubMed.
- C. A. Martínez-Huitle, M. A. Rodrigo, I. Sirés and O. Scialdone, Chem. Rev., 2015, 115, 13362–13407 CrossRef PubMed.
- Y.-J. Shih, C.-C. Su and C. P. Huang, Sep. Purif. Technol., 2015, 156, 961–971 CrossRef CAS.
- C. d. N. Brito, D. M. d. Araújo, C. A. Martínez-Huitle and M. A. Rodrigo, Electrochem. Commun., 2015, 55, 34–38 CrossRef CAS.
- D. C. d. Moura, C. d. N. Brito, M. A. Quiroz, S. B. C. Pergher and C. A. Martinez-Huitle, Journal of Water Process Engineering, 2015, 8, e31–e36 CrossRef.
- C. A. Martínez-Huitle and S. Ferro, Chem. Soc. Rev., 2006, 35, 1324–1340 RSC.
- M. Jiang, H. Wang, Y. J. Li, H. C. Zhang, G. X. Zhang, Z. Y. Lu, X. M. Sun and L. Jiang, Small, 2017, 13, 1602240 CrossRef PubMed.
- K. S. Exner, J. Anton, T. Jacob and H. Over, Angew. Chem., Int. Ed., 2016, 55, 7501–7504 CrossRef CAS PubMed.
- H. A. Hansen, I. C. Man, F. Studt, F. Abild-Pedersen, T. Bligaardac and J. Rossmeisl, Phys. Chem. Chem. Phys., 2010, 12, 283–290 RSC.
- K. S. Exner, J. Anton, T. Jacob and H. Over, Angew. Chem., Int. Ed., 2014, 53, 11032–11035 CrossRef CAS PubMed.
- R. K. B. Karlsson and A. Cornell, Chem. Rev., 2016, 116, 2982–3028 CrossRef CAS PubMed.
- I. Sohrabnejad-Eskan, A. Goryachev, K. S. Exner, L. A. Kibler, E. J. M. Hensen, J. P. Hofmann and H. Over, ACS Catal., 2017, 7, 2403–2411 CrossRef CAS.
- Y. Takasu, W. Sugimoto, Y. Nishiki and S. Nakamatsu, J. Appl. Electrochem., 2010, 40, 1789–1795 CrossRef CAS.
- T. L. Luu, J. Kim and J. Yoon, J. Ind. Eng. Chem., 2015, 21, 400–404 CrossRef.
- A. R. Zeradjanin, N. Menzel, W. Schuhmann and P. Strasser, Phys. Chem. Chem. Phys., 2014, 16, 13741–13747 RSC.
- N. Menzel, E. Ortel, K. Mette, R. Kraehnert and P. Strasser, ACS Catal., 2013, 3, 1324–1333 CrossRef CAS.
- K. S. Exner, J. Anton, T. Jacob and H. Over, Angew. Chem., Int. Ed., 2014, 53, 11032–11035 CrossRef CAS PubMed.
- R. Y. Chen, V. Trieu, A. R. Zeradjanin, H. Natter, D. Teschner, J. Kintrup, A. Bulan, W. Schuhmann and R. Hempelmann, Phys. Chem. Chem. Phys., 2012, 14, 7392–7399 RSC.
- Y. Yang, J. Shin, J. T. Jasper and M. R. Hoffmann, Environ. Sci. Technol., 2016, 50, 8780–8787 CrossRef CAS PubMed.
- V. Petrykin, K. Macounova, J. Franc, O. Shlyakhtin, M. Klementova, S. Mukerjee and P. Krtil, Chem. Mater., 2011, 23, 200–207 CrossRef CAS.
- Y. C. Zhu, M. Yuan, L. Deng, R. X. Ming, A. L. Zhang, M. Yang, B. Chai and Z. D. Ren, RSC Adv., 2017, 7, 1553–1560 RSC.
- C. X. Zhang, J. Hu, M. Nagatsu, X. S. Shu, H. Toyoda, S. D. Fang and Y. D. Meng, Electrochim. Acta, 2011, 56, 6033–6040 CrossRef CAS.
- A. A. Dameron, T. S. Olson, S. T. Christensen, J. E. Leisch, K. E. Hurst, S. Pylypenko, J. B. Bult, D. S. Ginley, R. P. O'Hayre, H. N. Dinh and T. Gennett, ACS Catal., 2011, 1, 1307–1315 CrossRef CAS.
- S. Suzuki, T. Onodera, J. Kawaji, T. Mizukami and K. Yamaga, Appl. Catal., A, 2012, s427–s428, 92–97 CrossRef.
- M. H. P. Santana and L. A. D. Faria, Electrochim. Acta, 2006, 51, 3578–3585 CrossRef CAS.
- H. A. Hansen, I. C. Man, F. Studt, F. Abild-Pedersen, T. Bligaard and J. Rossmeisl, Phys. Chem. Chem. Phys., 2010, 12, 283–290 RSC.
- E. Guerrini, V. Consonni and S. Trasatti, J. Solid State Electrochem., 2005, 9, 320–329 CrossRef CAS.
- S. Ferro and A. D. Battisti, J. Phys. Chem. B, 2002, 106, 2249–2254 CrossRef CAS.
- H. Park, Y.-C. Hung and D. Chung, Int. J. Food Microbiol., 2004, 91, 13–18 CrossRef CAS PubMed.
Footnote |
| † Electronic supplementary information (ESI) available. See DOI: 10.1039/c7ra08150b |
|
| This journal is © The Royal Society of Chemistry 2017 |
Click here to see how this site uses Cookies. View our privacy policy here.  Open Access Article
 *,
Ailian Zhang,
Ruoxi Ming,
Bo Chai and
Yuchan Zhu
 *
*

![[thin space (1/6-em)]](https://www.rsc.org/images/entities/char_2009.gif) :
:![[thin space (1/6-em)]](https://www.rsc.org/images/entities/char_2009.gif) 1.2
1.2![[thin space (1/6-em)]](https://www.rsc.org/images/entities/char_2009.gif) :
:![[thin space (1/6-em)]](https://www.rsc.org/images/entities/char_2009.gif) 1.0 for the Pt-ED electrode, which is close to the intensity ratio of 3.2
1.0 for the Pt-ED electrode, which is close to the intensity ratio of 3.2![[thin space (1/6-em)]](https://www.rsc.org/images/entities/char_2009.gif) :
:![[thin space (1/6-em)]](https://www.rsc.org/images/entities/char_2009.gif) 1.7
1.7![[thin space (1/6-em)]](https://www.rsc.org/images/entities/char_2009.gif) :
:![[thin space (1/6-em)]](https://www.rsc.org/images/entities/char_2009.gif) 1.0 as in JCPDS no. 04-0802. However, the intensity ratios of the Pt-TD and Pt-MS electrodes are 13.4
1.0 as in JCPDS no. 04-0802. However, the intensity ratios of the Pt-TD and Pt-MS electrodes are 13.4![[thin space (1/6-em)]](https://www.rsc.org/images/entities/char_2009.gif) :
:![[thin space (1/6-em)]](https://www.rsc.org/images/entities/char_2009.gif) 2.0
2.0![[thin space (1/6-em)]](https://www.rsc.org/images/entities/char_2009.gif) :
:![[thin space (1/6-em)]](https://www.rsc.org/images/entities/char_2009.gif) 1.0 and 34.9
1.0 and 34.9![[thin space (1/6-em)]](https://www.rsc.org/images/entities/char_2009.gif) :
:![[thin space (1/6-em)]](https://www.rsc.org/images/entities/char_2009.gif) 1.4
1.4![[thin space (1/6-em)]](https://www.rsc.org/images/entities/char_2009.gif) :
:![[thin space (1/6-em)]](https://www.rsc.org/images/entities/char_2009.gif) 1.0, respectively. This is far from the data of JCPDS no. 04-0802, indicating that they have a (111) dominated crystalline structure. It could be related to their preparation methods. In the magnetron sputtering technique, the sputtering power will affect the orientation of the planes of the metal. When the sputtering power is low, the close-packed plane crystal at low energy would be preferentially formed. Pt has a face-centered cubic structure and its (111) crystal surface would preferentially form on the substrate surface. With the increase of sputtering power, other crystal planes will grow gradually. The peak position (θmax) and the peak width (B2θ) were obtained from the curve fitting and used for the calculation of particle size (d) according to the Scherrer formula (d = 0.94λ/B2θ
1.0, respectively. This is far from the data of JCPDS no. 04-0802, indicating that they have a (111) dominated crystalline structure. It could be related to their preparation methods. In the magnetron sputtering technique, the sputtering power will affect the orientation of the planes of the metal. When the sputtering power is low, the close-packed plane crystal at low energy would be preferentially formed. Pt has a face-centered cubic structure and its (111) crystal surface would preferentially form on the substrate surface. With the increase of sputtering power, other crystal planes will grow gradually. The peak position (θmax) and the peak width (B2θ) were obtained from the curve fitting and used for the calculation of particle size (d) according to the Scherrer formula (d = 0.94λ/B2θ![[thin space (1/6-em)]](https://www.rsc.org/images/entities/char_2009.gif) cos
cos![[thin space (1/6-em)]](https://www.rsc.org/images/entities/char_2009.gif) θmax), where λ is 1.5406 Å. The average size of the Pt-MS electrode prepared in the present study was thus calculated to be about 8.6 nm based on the peak width of the well-shaped (220) reflection.
θmax), where λ is 1.5406 Å. The average size of the Pt-MS electrode prepared in the present study was thus calculated to be about 8.6 nm based on the peak width of the well-shaped (220) reflection.


