 Open Access Article
1H NMR metabolomic signatures related to giant cell tumor of the bone†
Francisco Javier Martínez-Lópeza,
Angel E. Bañuelos-Hernández b,
Elvia Becerra-Martínezc,
Eduardo Santini-Araujod,
Ruben A. Amaya-Zepedae,
Elizabeth Pérez-Hernández*e and
Nury Pérez-Hernández
 *a
*a
aEscuela Nacional de Medicina y Homeopatía, Instituto Politécnico Nacional, Ciudad de México, 07320, Mexico. E-mail: nperezh@ipn.mx; Tel: +52 55 57296000 ext. 55537
bUniversidad Autónoma Metropolitana, Unidad Iztapalapa, Ciencias Biológicas y de la Salud, Ciudad de México, 09340, Mexico
cCentro de Nanociencias y Micro y Nanotecnologías, Instituto Politécnico Nacional, Ciudad de México, 07320, Mexico
dUMAE de Traumatología, Ortopedia y Rehabilitación “Dr. Victorio de la Fuente Narváez”, Instituto Mexicano del Seguro Social (IMSS), Ciudad de México, 07760, Mexico
eDepartamento de Patología, Escuela de Medicina y Escuela de Odontología, Universidad de Buenos Aires, Argentina
First published on 22nd September 2017
Abstract
Giant cell tumor of the bone (GCTB) is an osteolytic neoplasm of uncertain biological behavior that affects the epiphyseal ends of long bones in young adults. This study describes for the first time the 1H NMR untargeted metabolic profiling of tissues from GCTB, which is clearly different from tissue controls. Applying univariate and multivariate analysis, fourteen differential metabolites were determinate and the major disturbed metabolic pathways included glycero-phospholipid metabolism and amino acid biosynthesis. These metabolic differences contribute to understand the molecular basis of GCTB and represent potential markers with future clinical applications.
Introduction
The Giant Cell Tumor of the Bone (GCTB) is a locally aggressive primary bone neoplasm that represents approximately 20% of benign bone tumors.1 The lesions predominantly affect the epiphyseal/metaphyseal region of the long bones of young adults that are skeletally mature, existing a peak of incidence in the third and fourth decades of life.2 The diagnosis of GCTB is based on radiographic or computed tomography presence of lytic lesions in the bone. Surgery is the preferred treatment, while the use of chemotherapy, radiation, and the antibody Denosumab are options with limited effects in tumor control.3 GCTB has high recurrence, and the metastatic lung disease is possible in 1.8% to 9.1% of cases in the extremities and in 13.5% of cases in the spine.4 Histologically, GCTB is characterized by distinctive multinucleated giant cells with osteoclast-like function surrounded by mesenchymal derived stromal cells and phagocytic histiocyte population.5 The stromal cells are considered the neoplastic component, cytogenetic findings as telomeric fusions, mutations in H3F3 and P63 have been recognized as common and correlated with the tumor behavior.6–9 These findings also have been related with tumor growth without definitive results. In addition, recent findings of genes related to the extracellular matrix integrity (LUM, DCN, and DPT) that are differentially expressed are proposed as biomarkers for metastatic and recurrent GCTB.10 Despite these findings, there is no current metabolic marker available for GCTB. Today, the development of analytical metabolomics has contributed to understand cancer pathogenesis; also, some metabolic biomarkers employed for the diagnosis of malignant disease and metabolic pathway alterations are beginning to be validated as therapeutic targets.11Specifically, the studies of NMR metabolomics have been focused on differentiation of cancer patients from matched controls based on measurements of biofluids and tissue tumors.12 Among the most relevant studies, the investigation of lung cancer has gained a significant development probably because its high lethality. Notably, using NMR and liquid chromatography, some serum metabolites distinguish between stage I lung cancer individuals and controls with 100% sensitivity and specificity,13,14 and this result is in agree with high-resolution magic-angle spinning (HRMAS) NMR metabolomic findings of adenocarcinoma and squamous cell carcinoma tissues.15 Additionally with this malignancy, differential NMR-based serum metabolite profiles can be confirmed between chronic obstructive pulmonary disease and lung cancer.16
Other two highlighted examples using NMR based metabolomics are gastric cancer17 and breast cancer.18 For the first one, relevant studies in rat model differentiate metabolic networks associated with four pathological stages: gastritis, low-grade gastric dysplasia, high-grade gastric dysplasia and gastric cancer compared with normal control group providing new information about the molecular mechanisms underlying the gastric carcinogenesis.19 In humans, the metabolic NMR profile in urine and tissue has resulted altered in cancer stages matched with the controls.20,21 For breast cancer, an study demonstrated accurate prediction in the serum NMR metabolic profiles and lifestyle variables, with sensitivity and specificity above 80% compared with control groups.22 While the in vivo 1H HRMAS NMR studies showed significant changes in the lipid profile of breast tissue, particularly in the total choline-containing compound and that changes are related with the tumor development and progression.18 Finally, many other cancer types including prostate cancer, colorectal cancer, pancreatic cancer, ovarian cancer and thyroid cancer have also been the subject of NMR-based metabolomics investigations,23 those studies highlighted the ability of NMR-based metabolomics for clinical application in cancer.
Based on this, we present the first high-resolution 1H NMR metabolomic analysis of tissues of GCTB with multivariate statistical to investigate if metabolic alterations could differentiate between control and tumor tissues. The key metabolites and altered biochemical pathways found in this study may advance the understanding of fundamental GCTB biology and harbor prognostic information that may potentially play a future role as biomarkers in the clinical area.
Materials and methods
Study population
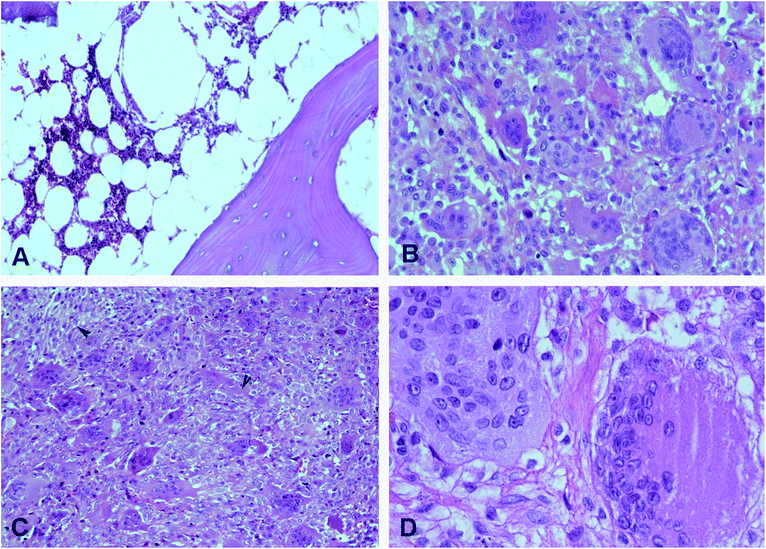
A total of 15 non-recurrent primary human GCTB samples were included in this study obtained from surgical specimens of intracompartmental resection type (bone graft) with record in the Department of Pathology of Orthopedic Hospital, UMAE “Dr. Victorio de la Fuente Narváez” IMSS.The diagnosis of GCTB was made by clinical-radiological criteria with histopathological confirmation (Fig. 1). For the control group, 15 samples of non-neoplastic bone tissue obtained from allografts were included. The tissues dissected by a Medical Pathologist with expertise in neoplastic musculoskeletal pathology in the operating room were immediately frozen in liquid nitrogen and stored at −80 °C. The patients enrolled in this study did not receive any local or systemic adjuvant therapy prior to surgery. No patient had a medical history of metabolic or concomitant systemic pathologies. The clinical information of patients is summarized in Table 1. The protocols outlined in this study were approved by the Bioethics Committee of the “Escuela Nacional de Medicina y Homeopatía del Instituto Politecnico Nacional.” This work adhered to the Ethical Norms, the Regulation of the General Law on Health in the Field of Research for Health and the Current Declaration of Helsinki. Accord to standardized treatment protocols, each patient signed an authorization for the performance of the surgery, thus, histopathology of the resected specimen was obtained.
Sample preparation
At the time of analysis, the frozen tissues were washed with a few drops of saline buffer (0.9%) to remove blood excess. Ca. 300 mg of thawed cold tissues were put in prefilled zirconium bead tubes containing 800 μL of phosphate buffer solution (PBS) and homogenized in the Bead Bug Microtube homogenizer (Benchmark Scientific, Edison, USA) by 180 s. To remove the cellular debris or insoluble material, samples were centrifuged at 12![[thin space (1/6-em)]](https://www.rsc.org/images/entities/char_2009.gif) 000 rpm for 10 minutes at 4 °C. The supernatant was poured to micro-centrifuge filters (3 kDa, Amicon Ultra 4 mL Merck Millipore, Massachusetts, USA) to remove the proteins, and 300 μL of the filtrate were supplemented with 400 μL of D2O containing DSS 4,4-dimethyl-4-silapentane-1-sulfonic acid (0.1 mM), NaN3 (0.2%), and imidazole (0.1 mM). The solution was transferred then into 5 mm NMR tubes.24
000 rpm for 10 minutes at 4 °C. The supernatant was poured to micro-centrifuge filters (3 kDa, Amicon Ultra 4 mL Merck Millipore, Massachusetts, USA) to remove the proteins, and 300 μL of the filtrate were supplemented with 400 μL of D2O containing DSS 4,4-dimethyl-4-silapentane-1-sulfonic acid (0.1 mM), NaN3 (0.2%), and imidazole (0.1 mM). The solution was transferred then into 5 mm NMR tubes.24
1H NMR spectroscopic analysis
NMR spectra were acquired using a Bruker Avance 750 spectrometer (Bruker Biospin, Karlsruhe, Germany) operating at 750.1 MHz and equipped with a 5 mm TXI probe at 298 K. Regular one-dimensional proton NMR spectra were obtained using the pulse program 1D NOESY-presat25 with a relaxation delay of 1 s, t1 of 4 μs, and tm of 100 ms. Spectra were acquired with 512 scans, the obtained FID were weighted using a Gaussian function with a line-broadening factor of 0.3 Hz, zero-filled and Fourier-transformed to 128 k data points. Spectra were manually phased, baseline-corrected, and chemical-shift-referenced to DSS (δ 0.00).Data analysis: NMR profile and statistics
The metabolites were identified and quantified using an untargeted profiling approach26 using Chenomx NMR Suite 8.2 Software (Chenomx, Inc., Edmonton, Alberta Canada). A total of 30 spectra corresponding to 15 GCTB and 15 controls were considered; all the samples were analyzed blindly in a random approach. Two persons independently analyzed the spectra, and only those compounds that were unequivocally identified and quantitated were included. HiFSA - 1H iterative Full Spin Analysis, was performed with PERCH NMR software (v.2011.1, PERCH Solutions Ltd., Kuopio, Finland). The applied methodology has been extensively described.27The concentrations obtained from spectral data were submitted to a multivariate data analysis performed using the SIMCA software (v 13.0.3, Umetrics, Umeå, Sweden). The data were normalized using a logarithmic function and scaled using Pareto scaling. Principal Component Analysis (PCA) was utilized for data overview and outlier detection. The data was modelled with the supervised method of Partial Least Squares Discriminant Analysis (PLS-DA) using the same scaling and centering parameters.
To identify the most altered metabolic pathways in GCTB, a set of significantly affected metabolite was used as the input for the metabolite set pathway analysis. Receiver operating characteristic (ROC) and visualization were performed using Metaboanalyst 3.0 (ref. 28) and the KEGG database (www.genome.jp/kegg/).
Results
Study population
The clinical characteristics of GCTB and control subjects is described in Table 1. No significant difference can be seen in age between control group and GCTB group. Any patients with GCTB group had evidence of metabolic or concomitant systemic pathologies. Accord to the Enneking staging,29 all GCTB patients were staged as IA, which corresponds to low grade lesions, intracompartmental, without metastatic lesions or pulmonary dissemination.Histological analysis
Fig. 1 displayed microscopic images of hematoxylin and eosin-stained sections of GCTB used for histological examination. All lesions were classified as IA, well differentiated, with mild cytological atypia and poor mitotic activity.29Tissue metabolite profiles of GCTB and control group based on 1H NMR
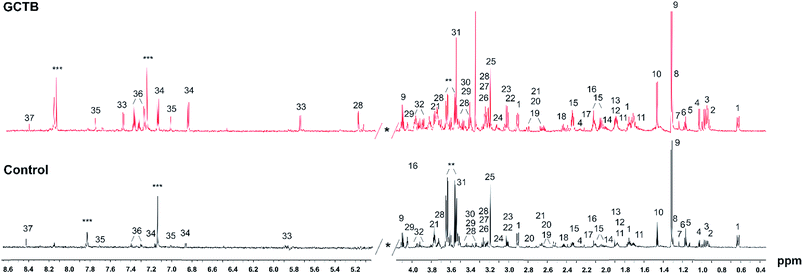
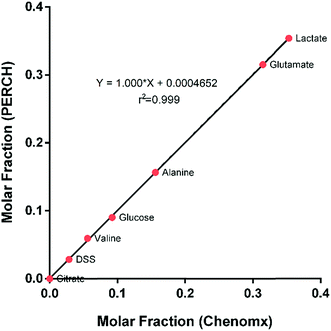
Representative 1D 1H NMR spectra of tissue samples obtained from a GCTB and control with the assigned resonances of main metabolites are shown in Fig. 2. A visual inspection of the spectra revealed several differences between the two profiles, principally the stronger signals of aromatic and branched amino acids in GCTB in comparison to control tissue. To deconvolute and to identify the complete signature of metabolites of the tissue samples, the Chenomx 8.2 Suite was used to examine the metabolomic profiles. The 750 MHz 1H NMR spectra of tissues showed well resolved peaks, allowing us to distinguish a total of 48 metabolites (Table S1†). To validate the Chenomx structural identity and the concentrations of the metabolites, spectra were submitted to a HiFSA methodology.27 The approach enables the determination of complete sets of chemical shifts and coupling constants for the molecules in solution and also gives the population each specie in a mixture. Thus, six metabolites and the chemical form standard (DSS, 0.1 mM) were selected for the comparison, two metabolites with the highest concentrations (lactate and glutamate), three metabolites with intermediate concentrations (alanine, glucose and valine), one of known concentration (DSS), and one absent metabolite (citrate). One selected theoretical spectrum is depicted in Fig. S1† and the simulated parameters also included in Table S2.†The molar fractions of the selected metabolites between two methods correlated with a factor of almost one, with a regression coefficient of 0.999. Using the concentration of the DSS as an internal standard for quantification; can be assured that the concentrations obtained from both methods are consistent (Fig. 3).
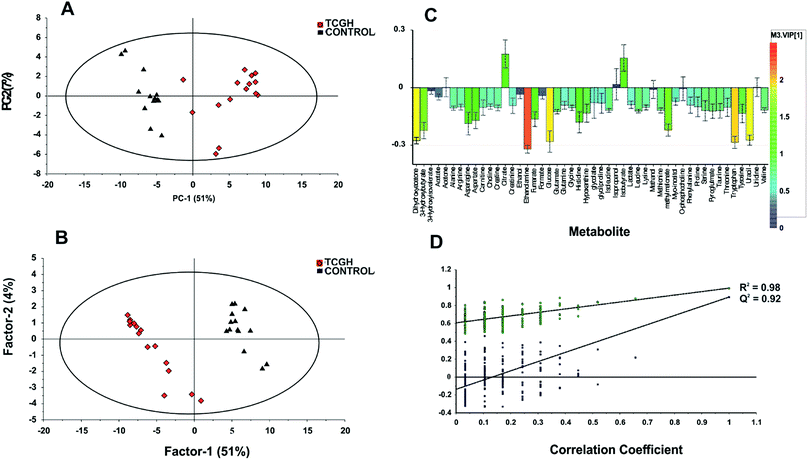
Additionally, a multivariate data analysis of the recorded 1H NMR data of each group was performed. Metabolite concentration data of GCTB tissue and control were analyzed using unsupervised (PCA) and supervised (PLS-DA) multivariate methods. PCA score plots were initially constructed for an overview of the data set and to visualize the outlier data of all samples. PCA between GCTB and control groups (Fig. 4A) shows separation between the two groups; the first principal component (PC1) separated the samples and accounted for the 51% of the variance within the data. The second principal component separated the data into control and GCTB groups and accounted for 7% of the variance. The responsible metabolites for this separation have been represented in the corresponding PC1 loadings plot (Fig. S2†).
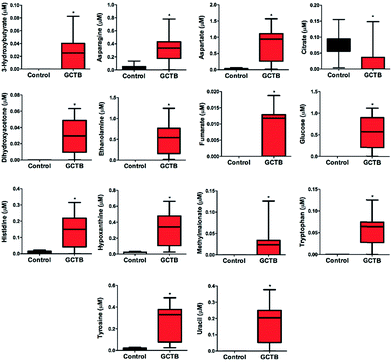
The PLS-DA modelling gave similar results to PCA (Fig. 4B). The model parameters in the permutation test for the explained variation (R2 = 0.96) and the predictive capability (Q2 = 0.92) were significantly high, indicating model robustness (Fig. 4D). The metabolite variation could be visualized in the loading plots, which are color-coded according to the absolute value of the correlation coefficients (|r|) derived from the significant metabolites contributing to the variance in factor 1 of PLS-DA (Fig. 4C). The significance of the metabolites was ranked using the variable importance for projection (VIP) score (≥1). We identified 14 metabolites that were significantly increased (Student's t-test, p < 0.05) in GCTB tissues as compared to healthy controls (Fig. 5). Metabolites that displayed a higher concentration comprised 3-hydroxybutyrate, asparagine, aspartate, dihydroxyacetone, ethanolamine, fumarate, glucose, histidine, hypoxanthine, methylmalonate, tryptophan, tyrosine, and uracil. In the opposite way, only citrate was the metabolite significantly decreases in GCTB related with control samples.
Additionally, the ROC curves of the differential metabolites set from the PLS-DA score values of GCTB are represented in Fig. 6. The area under the curve (AUC) of the ROC curves of the metabolite set contributing to the factor 1 had values ranging from 0.8 to 1; these values confirm the contribution of the metabolites to the variance between GCTB and the control.
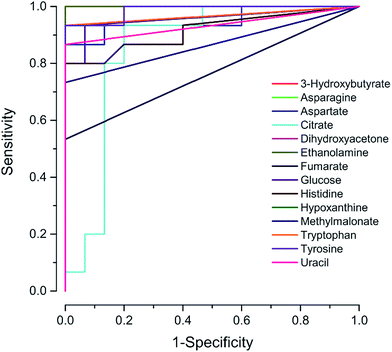 | ||
| Fig. 6 The ROC analysis for the fourteen potential biomarkers. The area under the curve of the respective metabolites range between 0.8 and 1. | ||
Tissue metabolite profiles of GCTB and control group based on 1H NMR
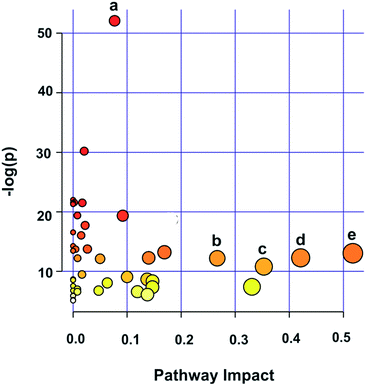
In order to identify possible biochemical events that were affected in GCTB, the metabolites contributing to the separation were analyzed using metabolite set pathway analysis, which is a way to identify biologically meaningful patterns that are significantly enriched in metabolomic data. Of the 16 assigned pathways, 5 were significant at a significance value of p < 0.05. The major pathways were glycerophospholipid metabolism, alanine, serine and threonine metabolism; glycine, serine and threonine metabolism; arginine and proline metabolism and the glutamine and glutamate metabolism which are significantly associated with the GCTB pathophysiology (Fig. 7).Discussion
In this study, we show that metabolic profiling of tissue samples by 1H NMR spectrometry clearly distinguishes between GCTB and controls. Although the interpretation of the meaning of the changes in a metabolite is complicated, it appears that alterations in the metabolism of glycerophospholipids and amino acids are the responsible for the differences observed in this prospective tumor and control group.Glycerophospholipids are the main component of biological membranes and many different bioactive lipid molecules. The phospholipid metabolism generates molecules with important functionality, either as structural or signaling function, such as inositol trisphosphate, diacylglycerol, arachidonic acid, phosphatidic acid, and lysophosphatidic acid.30 Phosphatidylcholine (PC) and phosphatidylethanolamine (PE) are the glycerophospholipids that account more than 50% of the total phospholipid species in eukaryotic membranes and are mainly synthesized through the Kennedy pathway.31 From a wider perspective, the most well-established molecular causes for the increment of PC and total choline levels in cancer cells and tumors are the raise in choline kinase alpha (Chk-α),32–34 the higher rate of choline transport, and increased activity of phosphatidylcholine specific phospholipases C and D.35,36 In more recent studies of enzymes that alter the choline metabolite profile, the glycerophosphocholine phosphodiesterases-5 and -6, are also related with the PC and choline elevation.37 Based on MRI spectroscopy, higher choline levels were previously demonstrated in GCTB,38 whereas in the present work, ethanolamine was also elevated in the same tumor type. PE has been observed in tumors almost as consistently with increased PC,39,40 but the role of PE in cancer is relatively unexplored. However, taking in account these two metabolites elevated in GCTB, it can suggest that enzymes as GPC-PDEs and the Kennedy pathway can be dysregulated in the GCTB; however, these two hypotheses need to be investigated in the future.
In the other hand, recent advances in cancer biology reveal that not only glucose (mainly by the Warbug effect) but also amino acids are essential to support the high metabolic demands of tumor.41 The proper amino acids is critical in cancer cells due to the alterations of pathways that support their biosynthesis and sensing.42 There are numerous reports of higher amino acid levels in cancer tissues than in normal controls.43 Our results were consistent with these studies, the non-essential amino acids asparagine, aspartate, and tyrosine were markedly increased in GCTB tissues as well the essential amino acids histidine and tryptophan.43
The accumulation of amino acids in cancer cells could be attributed to the uptake from blood and normal organs through the up-regulation of amino acid transporters, mTOR dysregulation, among other effects.44,45 The biosynthesis of the amino acid aspartate, and by extension the amination product asparagine, is strongly linked to glutamine/glutamate and the TCA cycle.46 It is noteworthy that these metabolic pathways were determined to be significant in GCTB by the enrichment analysis (Fig. 7). The action of GOT2 is crucial to aspartate biosynthesis, which produces this amino acid in the mitochondria using the TCA cycle intermediate oxaloacetate and derived nitrogen from glutamate.46 Mitochondrial aspartate can then be transported to the cytoplasm where asparagine synthase (ASNS) synthesizes asparagine utilizing nitrogen from glutamine in an irreversible reaction. The ASNS levels correlate with tumor aggressiveness, probably through a mechanism of asparagine related suppression of apoptosis,47 even though there is no specific report about the ASNS and GOT2 in bone neoplasms, thus these proteins need to be investigated in GCTB.
Interestingly, the metabolic pathway of alanine, aspartate, and glutamine also appears in the list of the differential pathways in previous transcriptomic analyses described for the GCTB;48 in that study, the genes identified as aspartate oxidase, and glutamine-fructose-6-phosphate transaminase 2 by transcriptomics were identified as upregulated.48 These observations together with our findings strongly support a notion that the altered glutamine/glutamate ratio and aspartate metabolism leads to a disturbance in GCTB. In our study, the essential amino acids histidine and tryptophan are also upregulated in GCTB, supporting the elevation of amino acid synthesis in this tumor.
Besides amino acid dysregulation, we also observed alterations in the Krebs cycle: the fumarate was elevated, while citrate was lower. In a previous metabolomic study of the osteosarcoma, the most frequent malignant bone tumor, the alterations in the Krebs cycle were also found by lower serum levels of fumarate and succinate in addition to a decreased level of isocitrate in urine.49 These findings may further support the speculation of an impaired TCA cycle in bone tumors.
Some studies suggest that p53 and p63 expressions are important markers in GCTB. Some reports have emphasized a correlation between the p53 mutation and the local recurrence and tumor aggressiveness.50 Also, a strong positivity of the p53 protein in immunohistochemistry has been observed in recurrent malignant tumors.51 Meanwhile the over-expression of p63 was observed in stromal cells, suggesting its relation with oncogenesis through different mechanisms.52 The p53 protein and its family members directly influence various metabolic pathways, enabling the response of the cells to metabolic stress. For example, p53 directly counteracts the Warburg effect by dampening glycolysis and promoting oxidative phosphorylation (OXPHOS).53 In addition to promoting OXPHOS, other activities of p53 may increase the rate of the TCA cycle.40 For example, p53 transcriptionally activates glutaminase 2 and represses the expression of malic enzymes ME1 and ME2, which recycle malate to pyruvate, and p53 could thereby inhibit the utilization of TCA cycle intermediates into biosbiosynthetic pathways and NADPH production. Similarly, the p53 target protein TIGAR is critical in the response to stress, and decreased TIGAR levels have been associated with increased migration, proliferation, and tumorigenicity in cells depleted of citrate synthase.54 This may be reflected by high levels of glucose and fumarate and low levels in the intermediates of the TCA cycle in GCTB. We summarized the alterations in GCTB in two critical pathways: glycerophospholipid metabolism and aminoacid metabolism, Fig. 8.
Conclusion
In this study, we have applied the untargeted metabolomics approach for the biochemical profiling of GCTB. To the author's knowledge, the application of 1H NMR to the metabolic profiling of GCTB has not previously been reported and highlights the novelty of this current study. A significant increase was observed in metabolites largely related to glicerophospholipid metabolism and amino acid biosynthesis in GCTB cases. Owing to a similar trend in the expression pattern of the tissue metabolites in other osseous neoplasms, in a further research we suggest that these metabolites may be explored as potential biomarkers for detection and prognosis of GCTB as well as understanding the molecular basis of GCTB.Conflicts of interest
The authors declare that they have no conflict of interest.Acknowledgements
We acknowledge support for this work from the SIP-IPN 20161281 and 20171396 grants. We are deeply grateful to Professor Pedro Joseph-Nathan (CINVESTAV) for allowing us the usage of the PERCH software for HiFSA calculations.References
- R. K. Kalil, Giant Cell Tumor of Bone, in Tumors and Tumor-Like Lesions of Bone. For Surgical Pathologists, Orthopedic Surgeons and Radiologists, ed. E. Santini-Araujo, R. K. Kalil, F. Y. Bertoni and K. Park, Springer-Verlag, London, 2015, pp. 351–366 Search PubMed.
- A. Liede, B. A. Bach, S. Stryker, R. K. Hernandez, P. Sobocki and B. Bennett, J. Bone Jt. Surg., Am. Vol., 2014, 96, 1999–2007 CrossRef PubMed.
- L. Van der Heijden, P. D. Dijkstra, J. Y. Blay and H. Gelderblom, Eur. J. Cancer, 2017, 77, 75–83 CrossRef PubMed.
- C. M. Chan, Z. Adler, J. D. Reith Jr and C. P. Gibbs, J. Bone Jt. Surg., Am. Vol., 2015, 97, 420–428 CrossRef PubMed.
- R. W. Cowan and G. Singh, Bone, 2013, 52, 238–246 CrossRef PubMed.
- L. Gorunova, F. Vult von Steyern, C. T. Storlazzi, B. Bjerkehagen, G. Follerås, S. Heim, N. Mandahl and F. Mertens, Genes, Chromosomes Cancer, 2009, 48, 583–602 CrossRef CAS PubMed.
- A. H. Cleven, S. Höcker, I. Briaire-de Bruijn, K. Szuhai, A. M. Cleton-Jansen and J. V. Bovée, Am. J. Surg. Pathol., 2015, 39, 1576–1583 CrossRef PubMed.
- C. P. Lau, P. K. Ng, M. S. Li, S. K. Tsui, L. Huang and S. M. Kumta, Int. J. Oncol., 2013, 42, 437–443 CrossRef CAS PubMed.
- C. Lee, I. Espinosa, K. C. Jensen, S. Subramanian, S. X. Zhu, S. Varma, K. D. Montgomery, T. O. Nielsen, M. van de Rijn and R. B. West, Mod. Pathol., 2008, 21, 531–539 CrossRef CAS PubMed.
- M. Lieveld, E. Bodson, G. De Boeck, B. Nouman, A. M. Cleton-Jansen, E. Korsching, M. S. Benassi, P. Picci, G. Sys, B. Poffyn, N. A. Athanasou, P. C. W. Hogendoorn and R. G. Forsyth, Virchows Arch., 2014, 465, 703–713 CrossRef CAS PubMed.
- D. S. Wishart, Nat. Rev. Drug Discovery, 2016, 15, 473–484 CrossRef CAS PubMed.
- G. A. N. Gowda and D. Raftery, Anal. Chem., 2017, 89, 490–510 CrossRef PubMed.
- W. Chen, S. Lu, J. Ou, G. Wang, Y. Zu, F. Chen and C. Bai, Cancer Biomarkers, 2016, 16, 653–664 CrossRef CAS PubMed.
- X. Zhang, X. Zhu, C. Wang, H. Zhang and Z. Cai, Oncotarget, 2016, 7, 63437–63448 Search PubMed.
- C. M. Rocha, A. S. Barros, B. J. Goodfellow, I. M. Carreira, A. Gomes, V. Sousa, J. Bernardo, L. Carvalho, A. M. Gil and I. F. Duarte, Carcinogenesis, 2015, 36, 68–75 CrossRef CAS PubMed.
- S. Deja, I. Porebska, A. Kowal, A. Zabek, W. Barg, K. Pawelczyk, I. Stanimirova, M. Daszykowski, A. Korzeniewska, R. Jankowska, P. J. Mlynarz and P. J. J. Pharm, J. Pharm. Biomed. Anal., 2014, 100, 369–380 CrossRef CAS PubMed.
- X. Shiyu and Z. Liya, Int. J. Oncol., 2017, 16, 5–17 Search PubMed.
- N. R. Jagannathan and U. Sharma, Metabolites, 2017, 25, 2–19 Search PubMed.
- J. Gu, X. Hu, W. Shao, T. Ji, W. Yang, H. Zhuo, Z. Jin, H. Huang, J. Chen, C. Huang and D. Lin, Oncotarget, 2016, 7, 60053–60073 Search PubMed.
- A. W. Chan, P. Mercier, D. Schiller, R. Bailey, S. Robbins, D. T. Eurich, M. B. Sawyer and D. Broadhurst, Br. J. Cancer, 2016, 114, 59–62 CrossRef CAS PubMed.
- H. Wang, H. Zhang, P. Deng, C. Liu, D. Li, H. Jie, H. Zhang, Z. Zhou and Y. L. Zhao, BMC Cancer, 2016, 16, 371 CrossRef PubMed.
- R. Bro, M. H. Kamstrup-Nielsen, S. B. Engelsen, F. Savorani, M. A. Rasmussen, L. Hansen, A. Olsen, A. Tjønneland and L. O. Dragsted, Metabolomics, 2015, 11, 1376–1380 CrossRef CAS PubMed.
- J. G. M. Pontes, A. J. M. Brasil, G. C. F. Cruz, R. N. de Souza and L. Tasic, Anal. Methods, 2017, 9, 1078–1096 RSC.
- O. Beckonert, H. C. Keun, T. M. Ebbels, J. Bundy, E. Holmes, J. C. Lindon and J. K. Nicholson, Nat. Protoc., 2007, 2, 2692–2703 CrossRef CAS PubMed.
- H. Mo and D. J. Raftery, Magn. Reson., 2008, 190, 1–6 CrossRef CAS PubMed.
- D. S. Wishart, Trends Anal. Chem., 2008, 27, 228–237 CrossRef CAS.
- J. G. Napolitano, D. C. Lankin, S. N. Chen and G. F. Pauli, Magn. Reson. Chem., 2012, 50, 569–575 CrossRef CAS PubMed.
- J. Xia, I. V. Sinelnikov, B. Han and D. S. Wishart, Nucleic Acids Res., 2015, 43, W251–W257 CrossRef CAS PubMed.
- W. F. Enneking, S. S. Spanier and M. A. Goodman, Clin. Orthop. Relat. Res., 1980, 153, 106–120 Search PubMed.
- X. Han, Nat. Rev. Endocrinol., 2016, 12, 668–679 CrossRef CAS PubMed.
- F. Gibellini and T. K. Smith, IUBMB Life, 2010, 62, 414–428 CrossRef CAS PubMed.
- J. E. Vance and G. Tasseva, Biochim. Biophys. Acta, 2013, 1831, 543–554 CrossRef CAS PubMed.
- S. Janardhan, P. Srivani and G. N. Sastry, Curr. Med. Chem., 2006, 13, 1169–1186 CrossRef CAS PubMed.
- A. Ghallab, EXCLI J., 2014, 13, 856–858 Search PubMed.
- E. Iorio, D. Mezzanzanica and P. Alberti, Cancer Res., 2005, 65, 9369–9376 CrossRef CAS PubMed.
- E. Iorio, A. Ricci and M. Bagnoli, Cancer Res., 2010, 70, 2126–2135 CrossRef CAS PubMed.
- K. Glunde, M. F. Penet, L. Jiang, M. A. Jacobs and Z. M. Bhujwalla, Expert Rev. Mol. Diagn., 2015, 15, 35–747 Search PubMed.
- P. L. Sah, R. Sharma, H. Kandpal, A. Seith, S. Rastogi, S. Bandhu and N. R. Jagannathan, AJR, Am. J. Roentgenol., 2008, 1902, W133–W139 CrossRef PubMed.
- F. Podo, S. Canevari, R. Canese, M. E. Pisanu, A. Ricci and E. Iorio, NMR Biomed., 2011, 24, 648–672 Search PubMed.
- F. Podo, NMR Biomed., 1999, 12, 413–439 CrossRef CAS PubMed.
- L. K. Boroughs and R. J. De Berardinis, Nat. Cell Biol., 2015, 17, 351–359 CrossRef CAS PubMed.
- Z. Tsun and R. Possemato, Semin. Cell Dev. Biol., 2015, 43, 22–32 CrossRef CAS PubMed.
- D. Bartusik, D. Aebisher and B. Tomane, J. Mol. Imaging Dyn., 2013, 2, 1–5 Search PubMed.
- P. Nicklin, P. Bergman, B. Zhang, E. Triantafellow, H. Wang, B. Nyfeler, H. Yang, M. Hild, C. Kung, C. Wilson, V. E. Myer, J. P. MacKeigan, J. A. Porter, Y. K. Wang, L. C. Cantley, P. M. Finan and L. O. Murphy, Cell, 2009, 136, 521–534 CrossRef CAS PubMed.
- W. J. Durham, E. L. Dillon and M. Sheffield-Moore, Curr. Opin. Clin. Nutr. Metab. Care, 2009, 12, 72–77 CrossRef CAS PubMed.
- B. J. Altman, Z. E. Stine and C. V. Dang, Nat. Rev. Cancer, 2016, 16, 619–634 CrossRef CAS PubMed.
- J. Zhang, J. Fan, S. Venneti, J. R. Cross, T. Takagi, B. Bhinder, H. Djaballah, M. Kanai, E. H. Cheng, B. Judkins, J. Pawel, S. Baggs, J. D. Cherry, A. R. Rabinowitz and C. B. Thompson, Mol. Cell, 2014, 56, 205–218 CrossRef CAS PubMed.
- I. W. Y. Mak, R. E. Turcotte and M. Ghert, J. Bone Miner. Res., 2012, 27, 1976–1991 CrossRef CAS PubMed.
- Z. Zhang, Y. Qiu, Y. Hua, Y. Wang, T. Chen, A. Zhao, Y. Chi, L. Pan, S. Hu, J. Li, C. Yang, G. Li, W. Sun, Z. Cai and W. Jia, J. Proteome Res., 2010, 9, 861–4868 Search PubMed.
- I. Papanastassiou, M. Ioannou, P. J. Papagelopoulos, G. Arealis, C. Mihas, I. Iakovidou and N. Demertzis, Orthopedics, 2010, 33, 307–310 Search PubMed.
- U. Yalcinkaya, N. Ugras, S. Kabul, G. Ocakoglu and M. S. Bilgen, Pol. J. Pathol., 2015, 66, 389–396 CrossRef PubMed.
- M. A. De Paula, A. Vasiljevic, R. Giorgi, A. Gomez-Brouchet, S. Aubert, X. Leroy, H. Duval, G. de Pinieux and C. Bouvier, Virchows Arch., 2014, 465, 487–494 CrossRef PubMed.
- C. R. Berkers, D. K. Oliver, E. C. Maddocks, I. M. Cheung and K. H. Vousden, Cell Metab., 2013, 18, 617–633 CrossRef CAS PubMed.
- P. Lee, K. H. Vousden and E. C. Cheung, Cancer Metab., 2013, 2, 1–9 Search PubMed.
Footnote |
| † Electronic supplementary information (ESI) available. See DOI: 10.1039/c7ra07138h |
| This journal is © The Royal Society of Chemistry 2017 |

