
 Open Access Article
 This Open Access Article is licensed under a Creative Commons Attribution-Non Commercial 3.0 Unported Licence
Characterization of extracellular polymeric substances produced during nitrate removal by a thermophilic bacterium Chelatococcus daeguensis TAD1 in batch cultures
Zhendong Weiab,
Shaobin Huang *ab,
Yongqing Zhangab,
Han Liab and
Shaofeng Zhouab
*ab,
Yongqing Zhangab,
Han Liab and
Shaofeng Zhouab
aCollege of Environment and Energy, South China University of Technology, Guangzhou 510006, PR China. E-mail: chshuang@scut.edu.cn; Tel: +86-20-39380587
bGuangdong Provincial Key Laboratory of Atmospheric Environment and Pollution Control, Guangzhou 510006, PR China
First published on 14th September 2017
Abstract
Aerobic denitrification is a novel strategy for nitrogen removal in wastewater treatment. As an important functional component, extracellular polymeric substances (EPS) secreted by aerobic denitrifiers during the denitrification process are poorly understood. This paper presents the characteristics of EPS production by thermophilic bacterium Chelatococcus daeguensis TAD1 during aerobic denitrification in liquid cultures. Results indicated that strain TAD1 was capable of simultaneously accumulating EPS and reducing nitrate, with 245.1 mg g−1 EPS obtained after aerobic denitrification. Polysaccharide and protein were determined to be the major components of EPS. Further single factor experiments showed that the EPS production was significantly affected by the carbon source, C/N ratio and pH value, rather than the incubation temperature. Moreover, good positive correlation (R2 = 0.86) was observed between the EPS production and the nitrate removal efficiency, which implied that aerobic denitrification might prompt EPS production by strain TAD1.
Introduction
Extracellular polymeric substances (EPS) of bacteria are involved in the formation of microbial aggregates and adhesion to surfaces. EPS are a complex mixture of high molecular polymers (Mw > 10![[thin space (1/6-em)]](https://www.rsc.org/images/entities/char_2009.gif) 000) excreted by microorganisms, products from lysis and hydrolysis, and organic matter adsorbed from wastewater.1 In wastewater treatment systems, EPS are a major component of activated sludge which floc together in a three-dimensional matrix, due to bridging with multivalent cations and hydrophobic interactions.2 Such a polymeric network has a vast surface area capable of adsorbing pollutants, nutrients, and minerals.3 However, during the application of biological nitrogen removal processes, investigation of EPS characteristics is still lacking, even though their composition and structure to maintain the integrity of activated sludge and the production of the biofilm matrix are essential for creating the network into which microbial cells are inserted.
000) excreted by microorganisms, products from lysis and hydrolysis, and organic matter adsorbed from wastewater.1 In wastewater treatment systems, EPS are a major component of activated sludge which floc together in a three-dimensional matrix, due to bridging with multivalent cations and hydrophobic interactions.2 Such a polymeric network has a vast surface area capable of adsorbing pollutants, nutrients, and minerals.3 However, during the application of biological nitrogen removal processes, investigation of EPS characteristics is still lacking, even though their composition and structure to maintain the integrity of activated sludge and the production of the biofilm matrix are essential for creating the network into which microbial cells are inserted.
EPS, mainly composed of polysaccharides and proteins, are microbial metabolic products. EPS can accumulate on the cell surface or dissolve in the media. They are important for microbial cells, as they can form protective layer for the cell against harsh external environment, serve as carbon and energy sources in starvation, mediate cell–cell interactions, facilitate the adherence of cell to surface, and induce microbial aggregation or biofilm formation. EPS are major components of biofilm or activated sludge, therefore some important properties of biofilm or activated sludge flocs, such as density, porosity, and viable biomass, are associated with EPS. The microbial activities of microorganisms embedded in EPS matrices as well as the cell hydrophobicity are influenced by EPS.1 Moreover, EPS mainly arise from the activities of enzymes secreted by the cells and cell lysis. Therefore, compositional changes in the EPS reflect the physiological metabolic activity of the microbial cells, and hence the mechanism by which the cells degrade the contaminants.
EPS originate from metabolism or lysis of microorganisms, so the nature and content of EPS are sensitive to the operational and environmental conditions.4 If a certain culture condition is induced, then the nature of the polymers changes accordingly. It is reported that the physical and chemical states of EPS are governed by environmental parameters such as wastewater composition, pH, and available cations.5 There are numerous studies on how operational conditions (e.g., dissolved oxygen, temperature and pH) influence the composition and the distribution of EPS in biofilms or activated sludge.6–8 However, reports about the characteristics and the distribution of EPS of thermophilic nitrogen removal process have rarely been seen according to our knowledge.9
Bacterial flocculation is highly related to EPS.10 The contents of polysaccharide, protein and nucleic acid in EPS have a substantial effect on the flocculation of bacteria. A large amount of work has been conducted on characterizing the EPS of various pure and mixed cultures, e.g., Pseudomonas sp.,11 Bacillus sp.,12 activated sludge,13–16 granular sludge17,18 and biofilm19,20 in wastewater treatment systems. However, little information is available on the characteristics of EPS of thermophilic aerobic denitrifying bacterium.
Our research group has isolated a novel thermophilic aerobic denitrifying bacterium, Chelatococcus daeguensis TAD1 which was from the biofilm of a biotrickling filter for the removal of NOx.21,22 In this study, four methods for extracting EPS from nitrate removal by thermophilic aerobic denitrifying bacterium in batch cultures were compared. These conventional methods, i.e. NaOH, H2SO4, ultrasonication and heating, are frequently used for EPS extraction from various pure and mixed cultures.1 Based on a comparison of the results, the heating extraction method was selected to investigate the effects of batch culture conditions on EPS. Therefore, the effects of growth phase, type of carbon source, pH, temperature, and the C/N ratio, on the production of EPS were investigated. Such information is useful for understanding the characterization of EPS produced by TAD1 and finding out the relationship between EPS production and nitrate removal capability.
Experimental section
Microbe
The thermophilic aerobic denitrifying bacterium Chelatococcus daeguensis TAD1 was isolated from the biofilm of a biotrickling filter for the removal of NOx.21,22 TAD1 was registered at the China General Microbiological Culture Collection Center (CGMCC no. 5226). The 16S ribosomal DNA gene sequence of TAD1 has been submitted to the DNA Data Bank of Japan (DDBJ)/European Molecular Biology Laboratory (EMBL)/GenBank databases under accession no. HM000004. Its genetic composition was highly similar (99%) to C. daeguensis K106. TAD1 was stored in 30% glycerol at −20 °C. The culture was maintained at 4 °C on agar slants.Media and cultivation of TAD1
We used the following growth medium for TAD1: Luria–Bertani (LB) medium (g L−1): tryptone, 10.0; yeast extract, 5.0; NaCl, 5.0. The mineral salt medium (MSM) was composed of (g L−1):23 KNO3, 1.0; Na2HPO4, 7.9; KH2PO4, 1.5; MgSO4·7H2O, 0.1; 1 mL of trace elements solution. The trace elements solution was composed of (g L−1): EDTA, 50.0; CaCl2, 5.5; MnCl2·4H2O, 5.06; FeSO4·7H2O, 5.0; ZnSO4, 2.2; CoCl2·6H2O, 1.61; CuSO4·5H2O, 1.57; (NH4)6Mo7O2·4H2O, 1.1.TAD1 was first pre-cultured in 50 mL LB medium for 12 h at 50 °C and 150 rpm. 5 mL of this seed medium was inoculated to 100 mL MSM medium with sodium succinate (9.4 g L−1) as the sole carbon source in 300 mL flask, and then grown for 24 h at 50 °C and 180 rpm. The pH of the medium was adjusted to 7 before sterilization.
Extraction of EPS
The water-soluble EPS from TAD1 was extracted using four methods (NaOH, H2SO4, ultrasonication and heating) and a control method (centrifugation). A TAD1 culture solution (40 mL) was harvested by centrifugation for 20 min at 1200 rpm and 4 °C and was then washed twice with 0.9% NaCl solution. Later, the cell pellets were transferred to 10 mL double-distilled water in 25 mL tubes, followed by the addition of two extractants: NaOH and H2SO4. At 4 °C, the extraction time was 2 h for NaOH (1 N, 2 mL) and H2SO4 (8%, 4 mL).24,25 For comparison, the EPS was extracted from TAD1 through ultrasonication (60 W) or heating to 70 °C for 2 h.26 Thereafter, the supernatant were centrifuged at 15000 rpm and 4 °C for 15 min, in order to remove the remaining cells. The centrifugation temperature of 4 °C was selected to avoid the disruption of EPS. After filtration through 0.45 μm cellulose acetate membranes, these solutions were used as the EPS fraction for chemical analysis.
Effects of batch culture conditions on EPS
Analytical methods
All chemical analyses were carried out in duplicate using chemicals of analytical grade. Nitrate was measured colorimetrically.27 The polysaccharide and protein contents were quantified by the phenol-sulfuric acid method28 and the Coomassie procedure,29 respectively. The nucleic acid content was determined according to Boonaert et al.,30 using a UV spectrophotometer (TU1810; Beijing general instrument co., China). All results (in mg g−1 of dry cells) were recorded as the average of triplicate tests.Results and discussion
EPS extraction
As for EPS extraction, several chemical and physical approaches were proposed in previous studies, however, their effectiveness was tremendously varied with different bacterial cultures.31,32 In this study, four methods (sonication, NaOH, heating and H2SO4) were evaluated for EPS extraction from TAD1. Results showed that the concentration of total EPS and its components was strongly dependent on the extraction method, in agreement with the observation by Sheng et al.31 Little EPS was extracted by the control (centrifugation), with only 3.1, 2.7 and 1.8 mg g−1 dry cells for polysaccharides, proteins and nucleic acids, respectively.As showed in Table 1, nucleic acid content extracted by the four methods were in the order: sonication > NaOH > heating > H2SO4 > centrifugation (control). When sonication and NaOH were used for extraction, the nucleic acid content were about 11 and 7.5 times higher than that of the control, indicating that cell lysis was severe and a large amount of intracellular substances leaked out. When H2SO4 was used, the nucleic acid content was low, so did the contents of polysaccharide and protein, suggesting that H2SO4 was not an efficient extractant for EPS. By contrast, high yield of polysaccharide (128.4 mg g−1) and protein (85.6 mg g−1) and low yield of nucleic acid (4.5 mg g−1) only achieved with heating treatment, indicating that this method was more effective than the other three methods. Many other studies observed that higher amount of nucleic acids could be produced by heating treatment.32,33 This phenomenon could associate with the cell lysis when high temperature was exposed to the mesophilic strains used in these studies. Since TAD1 was a thermophilic bacterium, more heat-resistance could be responsible for little nucleic acid release at high temperature. Accordingly, heating was chosen to extract EPS from TAD1 in subsequent experiments. Since the nucleic acid content could be ignored, we just assayed the contents of polysaccharide and protein to describe the variation of the EPS.
| Component | NaOH | H2SO4 | Sonication | Heating | Control (centrifugation) |
|---|---|---|---|---|---|
| Polysaccharide | 86.7 | 110.5 | 68.9 | 128.4 | 3.1 |
| Protein | 116.8 | 15.1 | 46.7 | 85.6 | 2.7 |
| Nucleic acid | 14.9 | 6.2 | 19.8 | 4.5 | 1.8 |
| Total EPS | 218.4 | 131.8 | 135.4 | 218.5 | 8.6 |
The time course of EPS production
Fig. 1 showed the time course of EPS production by TAD1 when using nitrate as an alternative electron acceptor aerobically. The adaptive period was the first 4 h, followed by a logarithmic phase lasting from 4 to 16 h, after which cells remained almost constant referring to as stationary phase (16–24 h). TAD1 was more vigorous during the logarithmic phase with both fast EPS production and nitrate removal. The growth phase-dependent EPS production was also observed in pure culture of Ralstonia eutropha ATCC 17699.34 It was interesting that EPS production and nitrate removal simultaneously occurred, from which it was speculated that the positive relationship between EPS production and nitrate removal. When cells got into the stationary phase after 16 h, the EPS production kept at a maximum concentration of 245.1 mg g−1, of which polysaccharide and protein accounted for 62.7% and 37.3%, respectively.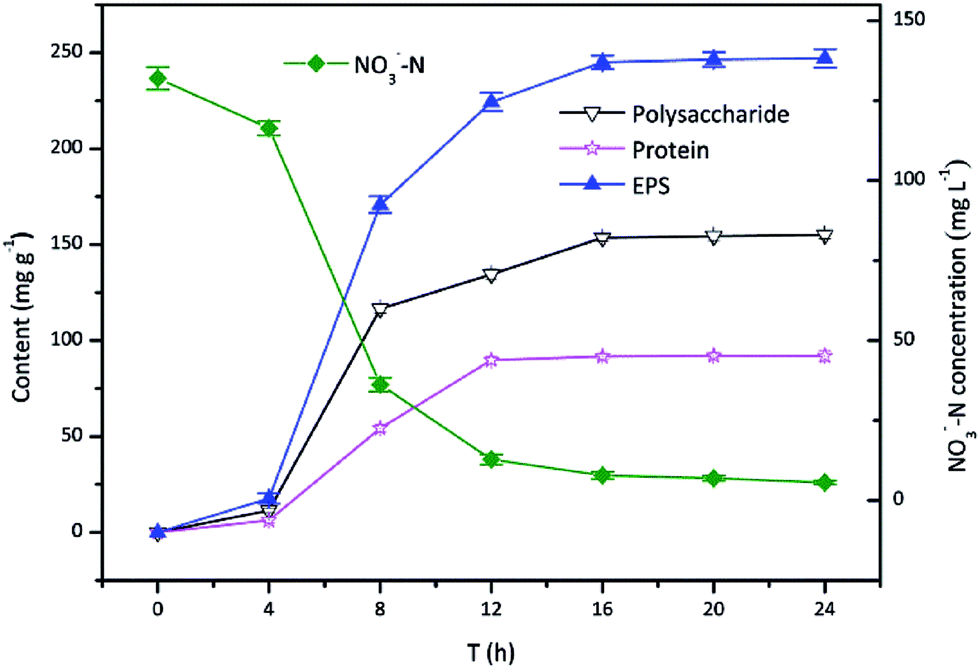 | ||
| Fig. 1 Time course of the growth on EPS production during nitrate removal by C. daeguensis TAD1. | ||
The ability of EPS production was distinctly different with different cultures. The amount of EPS production by TAD1 was comparable with other pure cultures, e.g. Pseudomonas (228 mg g−1) and Serratia marcescens (246 mg g−1).35 More EPS (483 mg g−1) could be observed in activated sludge due to deferent growth model.35 The flocculating ability of bacteria was related to EPS production. Rhodopseudomonas acidophila only released 64.9 mg g−1 EPS resulting in poor flocculation.31 From this point of view, higher EPS production by TAD1 was benefit for its flocculation.
Effect of the carbon source on EPS
Carbon source has a substantial effect on the microbial metabolism, thus influences the process of nitrate reduction and EPS production. Although the effect of carbon source on aerobic denitrification was extensively studied in literatures,36 its impact on EPS production was rarely evaluated. Herein, the carbon source dependence of EPS production by aerobic denitrifier TAD1 was investigated with various organic carbon compounds (sodium succinate, sodium citrate, sodium acetate, glucose).As shown in Fig. 2, TAD1 was able to utilize different carbon sources to remove nitrate and produce EPS. Nitrate removal efficiency reached a maximum value (92.4%) in the presence of sodium succinate, following by sodium acetate (84.8%) and sodium citrate (63.4%). The lowest removal efficiency (9.4%) occurred when feeding with glucose. Similar trend was observed on the EPS production, as the most EPS production (214 mg g−1) was obtained with sodium succinate then followed by sodium acetate (190.6 mg g−1), sodium citrate ( 180.1 mg g−1) and glucose (15.7 mg g−1). These results indicated sodium succinate was the optimal carbon source for both aerobic denitrification and EPS production. As for EPS components, the polysaccharide content presented the same variation with the total EPS. By contrast, the protein content was unaffected by the carbon sources except for glucose. It was suggested that these small molecular weight carbon compounds could directly insert into tricarboxylic acid (TCA) cycle which is an important carbon metabolism pathway for bioenergy synthesis.37 However, the biological oxidation of glucose requires a set of enzymes to convert glucose to pyruvate which then participates TCA cycle.
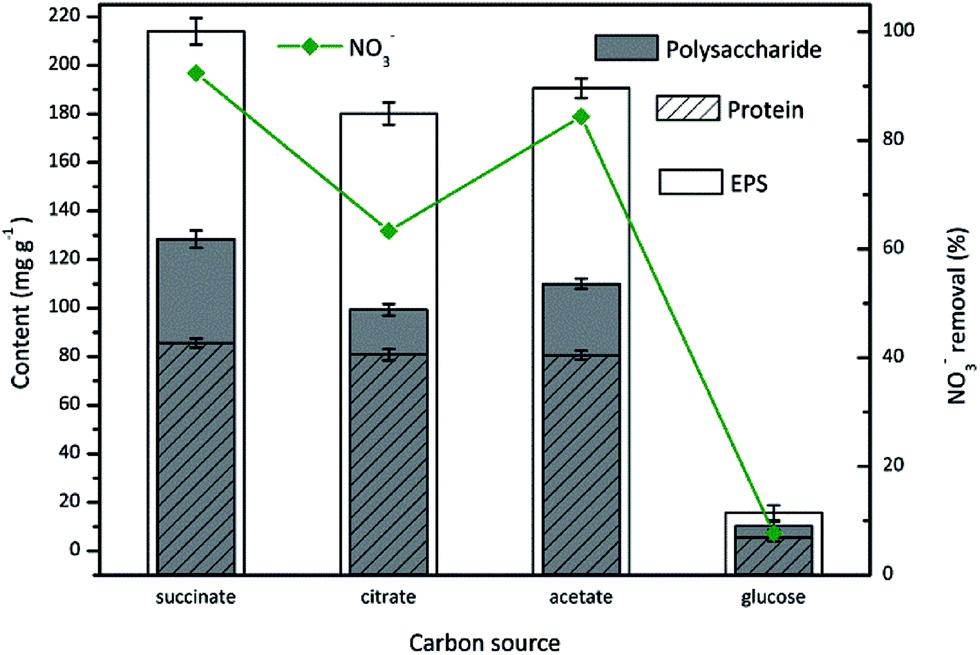 | ||
| Fig. 2 The EPS production during nitrate removal by C. daeguensis TAD1 utilizing various carbon sources (sodium succinate, sodium citrate, sodium acetate, glucose). | ||
Effect of the C/N ratio on EPS
The C/N ratio represents the electron donor availability to electron acceptor in biological denitrification. Sufficient carbon supply is essential for complete denitrification, whereas insufficient carbon concentration results in low denitrification efficiency and low cell growth. Due to the biological importance of C/N ratio for denitrification, the influence of C/N ratio on EPS production during aerobic denitrification by TAD1 was investigated.As shown in Fig. 3, the effect of C/N ratio on nitrate removal was significant. The removal efficiency increased linearly with the increase in C/N ratio from 3 to 8, and achieved a maximum value of 95.6% at C/N ratio of 8. Further increase in C/N ratio to 15 had no apparent impact on nitrate removal. Simultaneously, EPS content increased in C/N ratio range of 3–15, and achieved a maximum value of 238.9 mg g−1 at C/N of 15. It should be noted that TAD1 was still capable of producing considerable EPS (140.3 mg g−1) at low C/N of 3, showing strong tolerance to insufficient carbon concentration. For the components of EPS, the polysaccharide content presented a slow increasing trend with the increase in C/N ratio. However, the protein content was affected sharply and there was an obvious dividing line between low C/N ratios of (3 and 6) and high C/N ratios (8 and 15). The most protein content (88.9 mg g−1) achieved by C/N ratio of 15 was almost 2 times than that (45.7 mg g−1) achieved by C/N ratio of 3. This might be due to that C/N ratio had a great effect on regulation of carbon and nitrogen metabolisms and hence on the EPS synthesis pathway.
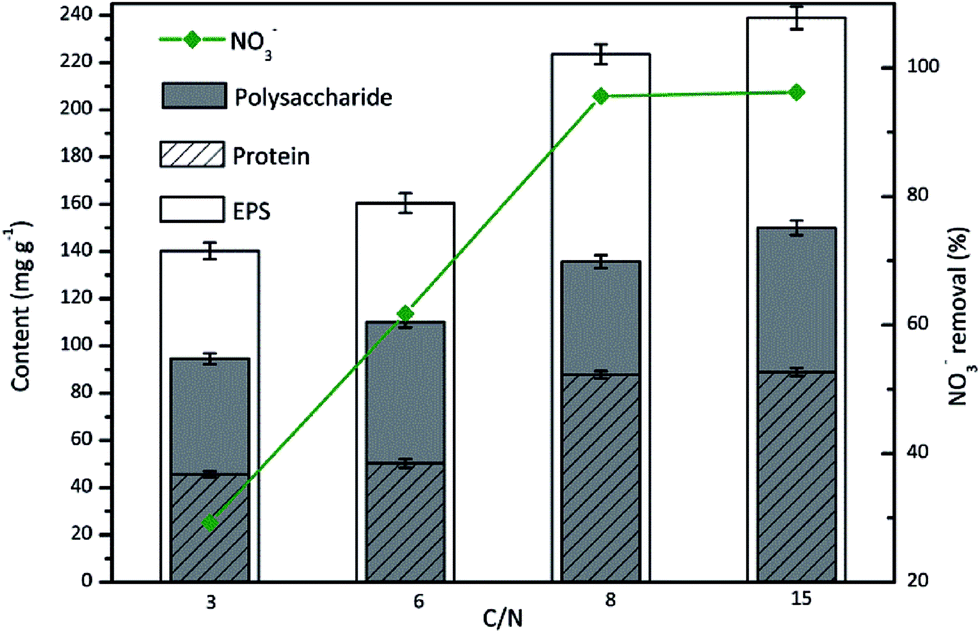 | ||
| Fig. 3 The EPS production during nitrate removal by C. daeguensis TAD1 under various C/N ratios (C/N = 3, 6, 8 and 15). | ||
Effect of the temperature on EPS
The behavior of microorganisms with respect to EPS production is variable, and is temperature-dependent with an optimal temperature in the range of 20–40 °C for most strains.38,39 However, TAD1 was thermophilic denitrifying bacterium. Therefore, it was significant to investigate the effect of the temperature on EPS production during nitrate removal by TAD1. The results were presented in Fig. 4. The nitrate removal efficiency and EPS production were generally in positive proportion to the temperature and exhibited the maximum values at 50 °C, which were 94.5% and 230.2 mg g−1, respectively. The nitrate removal were all efficient (>64%) with the studied temperature range (30–50 °C). The EPS content showed a slow increase, while the polysaccharide content presented an irregular change with the tested temperatures. Protein stayed quite stable when the temperature above 40 °C, while below 40 °C, the protein content decreased a little bit significantly, as the minimum of 40.7 mg g−1 was obtained at 30 °C, which was nearly half of maximum (90.2 mg g−1) at 50 °C.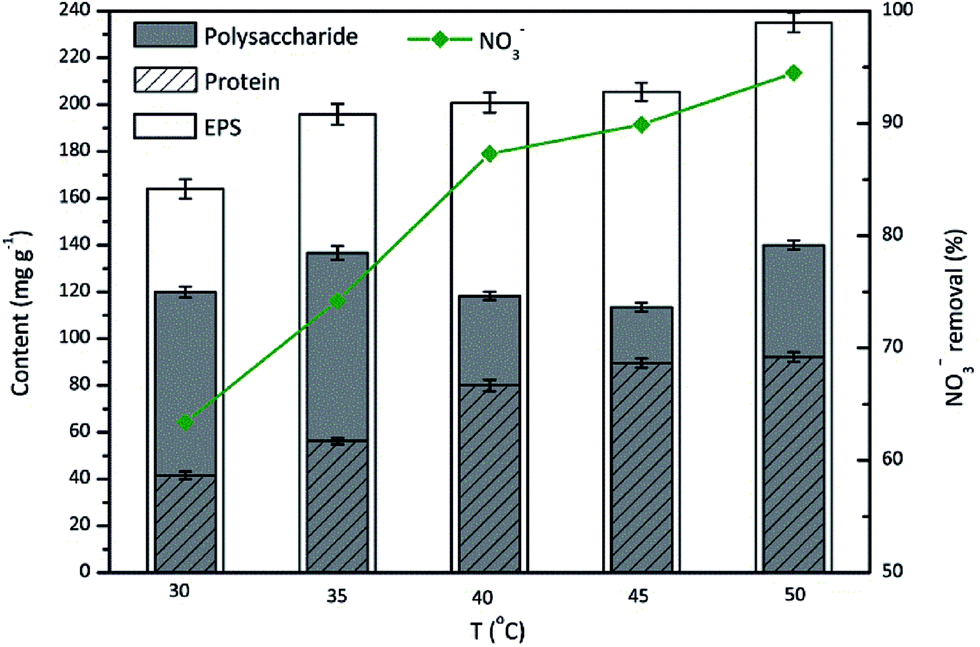 | ||
| Fig. 4 Effects of incubation temperature on the EPS production during nitrate removal by C. daeguensis TAD1 (temperature range of 30–50 °C). | ||
Effect of pH on EPS
The pH appears to have a pervasive effect on the microbial activity and exerts a strong selection pressure on microbes. EPS secretion from the attached cells is mainly dependent on the pH value of the bacterial culture.40 The effect of pH on the EPS production during nitrate removal by TAD1 was evaluated over a pH range of 5–9 (Fig. 5).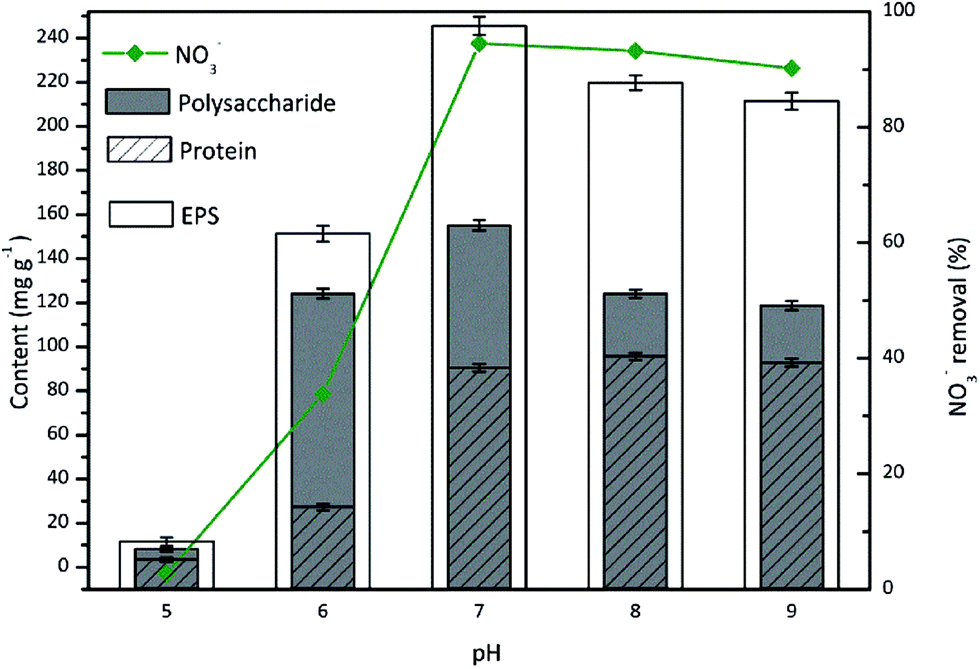 | ||
| Fig. 5 Effects of incubation pH on the EPS production during nitrate removal by C. daeguensis TAD1 (pH range of 5–9). | ||
As shown in Fig. 5, TAD1 showed great nitrate removal ability when the culture condition was neutral (pH 7) to mild alkaline (pH 8, 9). The maximum nitrate reduction was observed at pH 7, with the removal efficiency exceeding 95%. At pH < 7, the removal of nitrate was significantly inhibited. As for the EPS secretion from TAD1 under different pH values, it could be seen that the EPS content and polysaccharide content remained comparatively stable when the pH of the batch culture was neutral (pH 7) to mild alkaline (pH 8, 9). As the pH decreased below 7 (pH 6), the concentrations of EPS and protein declined sharply. Between pH 6 and pH 7, the EPS content reduced from 245 mg g−1 to 155.4 mg g−1 (a decrease of about 37.1%). Meanwhile, the proteins reduced from 90.5 mg g−1 at pH 7 to only 27.3 mg g−1 at pH 6 (decreased reduction of nearly 70%). But for the polysaccharides, its concentration was 124.1 mg g−1 at pH 6, decreasing by just 20% from its maximum (155.1 mg g−1) at pH 7. Therefore, high amounts of total EPS under alkaline conditions were mainly attributed to the increase in protein concentrations. However, the amounts of total EPS and its components were all very small at the extreme low pH 5, which might be explained that strong acidic condition significantly inhibited metabolism activity of TAD1 and then caused the decrease of EPS secretion. Under acidic conditions, H+ and OH− ions largely influence the negatively charged groups of proteins and polysaccharides.41 As proteins are denatured under strongly acidic conditions, the proteins was most greatly affected by low pH values. Under neutral or mildly alkaline conditions, the EPS secretion was increased, reflecting the higher cell activity. Low pH decreased the microbial enzyme activity, blocked the cells' metabolism and ultimately killed the cells. Hence, the protein content was affected first by a reduction in pH value.
Correlation between EPS and NO3−–N removal
Based on the results of effects of batch culture conditions (growth phase, type of carbon source, pH, temperature, and C/N ratio) on EPS production during nitrate removal by TAD1, we observed that the EPS concentration variation was usually accordant with the nitrate removal efficiency, so we investigated the relationship between EPS and nitrate removal. As shown in Fig. 6, total EPS concentration was well correlated with the nitrate removal efficiency (R2 = 0.886), indicating that EPS production associated with aerobic denitrification. Moreover, the correlation between proteins and nitrate removal efficiency was more relevant (R2 = 0.893), suggesting that protein release was tightly controlled during NO3−–N removal process.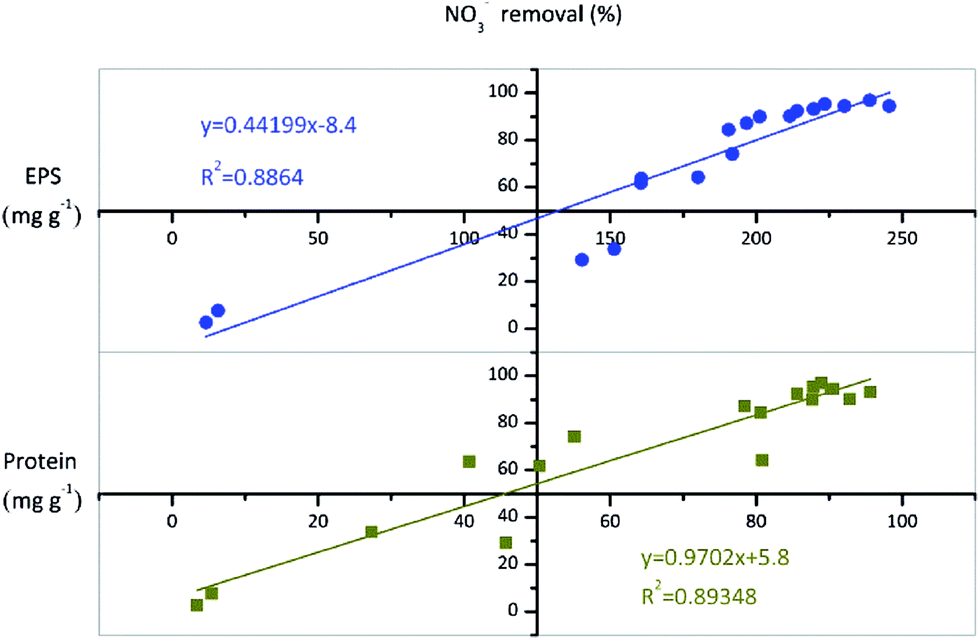 | ||
| Fig. 6 Relationship between EPS and protein contents and the efficiency of NO3−–N removal. | ||
Previous studies indicated that the EPS production was tightly related to cell growth.34,42 Degeest et al. observed that the higher cell growth rate, the greater EPS could be produced.42 Wang et al. found a positive correlation between cell growth rate and EPS production rate by Ralstonia eutropha ATCC 17699, indicating cell growth played an important role in EPS production.34 In this study, the maximal EPS production was also observed under optimal culture conditions, while poor EPS production under poor culture conditions. Our findings were in agreement with these studies. Compared with aerobic respiration, aerobic denitrification was able to improve cell growth. The cell growth rate of Thiosphaera pantotropha increased 0.06 h−1 with aerobic denitrification than aerobic respiration.43 Similar observation was also found in pure culture of Neisseria meningitidis.44 Therefore, aerobic denitrification might prompt EPS production via its stimulation on cell growth. Moreover, the well positive correlation between EPS production and aerobic denitrification observed in this study suggested that aerobic denitrification played an important role in EPS production.
Conclusions
This study provided a profound understanding in EPS production in relation with aerobic denitrification by TAD1. Total EPS and it components (polysaccharide and protein) were strongly influenced by culture conditions during aerobic denitrification. Notably, the total EPS and its protein content were well positively correlated with the nitrate removal efficiency. The information derived from these studies will be useful for understanding the characterization of aerobic denitrification by TAD1 and the pronounced EPS production during aerobic denitrification enable development of valuable strategies for application of TAD1 in bioremediation process.Conflicts of interest
There are no conflicts to declare.Acknowledgements
This research was supported by the Natural Science Foundation of China (Grant No. 51378217) and Research Project of Guangdong Provincial Department of Science and Technology (Grant No. 2016B020240002 and 2015B020236001).References
- G. P. Sheng, H. Q. Yu and X. Y. Li, Biotechnol. Adv., 2010, 28, 882–894 CrossRef CAS PubMed.
- Z. Ding, I. Bourven, G. Guibaud, E. D. van Hullebusch, A. Panico, F. Pirozzi and G. Esposito, Appl. Microbiol. Biotechnol., 2015, 99, 9883–9905 CrossRef CAS PubMed.
- J. C. Finlayson, B. Liao, I. G. Droppo, G. G. Leppard and S. N. Liss, Water Sci. Technol., 1998, 37, 353–357 CAS.
- S. B. Subramanian, S. Yan, R. D. Tyagi and R. Y. Surampalli, Water Res., 2010, 44, 2253–2266 CrossRef PubMed.
- P. H. Nielsen, A. Jahn and R. Palmgren, Water Sci. Technol., 1997, 36, 11–19 CAS.
- L. Y. Tseng, R. Gori and D. Rosso, Environ. Eng. Sci., 2015, 32, 582–592 CrossRef CAS.
- Z. Wang, M. Gao, Y. Xin, D. Ma, Z. She, Z. Wang, C. Sun and Y. Ren, Environ. Technol., 2014, 35, 2821–2828 CrossRef CAS PubMed.
- L. Xia, X. Zheng, H. Shao, J. Xin and T. Peng, J. Hydrol., 2014, 519, 3153–3162 CrossRef CAS.
- Y. Wang, J. Qin, S. Zhou, X. Lin, L. Ye, C. Song and Y. Yan, Water Res., 2015, 73, 252–264 CrossRef CAS PubMed.
- H. H. Suh, G. S. Kwon, C. H. Lee, H. S. Kim, H. M. Oh and B. D. Yoon, J. Ferment. Bioeng., 1997, 84, 108–112 CrossRef CAS.
- I. Beech, L. Hanjagsit, M. Kalaji, A. L. Neal and V. Zinkevich, Microbiology, 1999, 145, 1491–1497 CrossRef CAS PubMed.
- K. Okaiyeto, U. U. Nwodo, L. V. Mabinya, A. S. Okoli and A. I. Okoh, Int. J. Mol. Sci., 2015, 16, 12986–13003 CrossRef CAS PubMed.
- Z. Li, P. Lu, D. Zhang, G. Chen, S. Zeng and Q. He, Sep. Purif. Technol., 2016, 162, 91–100 CrossRef CAS.
- W. Zhang, B. Cao, D. Wang, T. Ma and D. Yu, Biochem. Eng. J., 2016, 106, 37–47 CrossRef CAS.
- L. Ge, H. Wang, L. Ma and H. Deng, Fresenius Environ. Bull., 2006, 15, 1252–1255 CAS.
- L. Zhang, H. Ren and L. Ding, Water Sci. Technol., 2012, 66, 1558–1564 CrossRef CAS PubMed.
- I. Bourven, G. Bachellerie, G. Costa and G. Guibaud, Environ. Technol., 2015, 36, 2428–2435 CrossRef CAS PubMed.
- P. d'Abzac, F. Bordas, E. van Hullebusch, P. N. L. Lens and G. Guibaud, Colloids Surf., B, 2010, 80, 161–168 CrossRef PubMed.
- Z. Liang, W. Li, S. Yang and P. Du, Chemosphere, 2010, 81, 626–632 CrossRef CAS PubMed.
- F. Brian-Jaisson, M. Molmeret, A. Fahs, L. Guentas-Dombrowsky, G. Culioli, Y. Blache, S. Cerantola and A. Ortalo-Magne, Biofouling, 2016, 32, 547–560 CrossRef CAS PubMed.
- W. Liang, S. Huang, Y. Yang and R. Jiang, Bioresour. Technol., 2012, 125, 82–87 CrossRef CAS PubMed.
- Y. Yang, S. Huang, W. Liang, Y. Zhang, H. Huang and F. Xu, J. Hazard. Mater., 2012, 203–204, 326–332 CrossRef CAS PubMed.
- M. H. A. Ibrahim and A. Steinbuechel, J. Appl. Microbiol., 2010, 108, 214–225 CrossRef CAS PubMed.
- H. Liu and H. H. P. Fang, J. Biotechnol., 2002, 95, 249–256 CrossRef CAS PubMed.
- L. Ge, H. Deng, H. Wang, L. Ma and Y. Liu, Fresenius Environ. Bull., 2007, 16, 299–303 CAS.
- X. Y. Li and S. F. Yang, Water Res., 2007, 41, 1022–1030 CrossRef CAS PubMed.
- R. Michalski and I. Kurzyca, Pol. J. Environ. Stud., 2006, 15, 5–18 CAS.
- P. Gerhardt, R. G. E. Murray, W. A. Wood and N. R. Krieg, Methods for General and Molecular Bacteriology, American Society for Microbiology, Washington, DC, 1994, ch. 5 Search PubMed.
- M. M. Bradford, Anal. Biochem., 1976, 72, 248–254 CrossRef CAS PubMed.
- C. J. P. Boonaert, Y. F. Dufrene, S. R. Derclaye and P. G. Rouxhet, Colloids Surf., B, 2001, 22, 171–182 CrossRef CAS.
- G. P. Sheng, H. Q. Yu and Z. Yu, Appl. Microbiol. Biotechnol., 2005, 67, 125–130 CrossRef CAS PubMed.
- C. Xu, P. H. Santschi, K. A. Schwehr and C. C. Hung, Bioresour. Technol., 2009, 100, 6010–6021 CrossRef CAS PubMed.
- J. M. Tapia, J. A. Munoz, F. Gonzalez, M. L. Blazquez, M. Malki and A. Ballester, Water Sci. Technol., 2009, 59, 1959–1967 CrossRef CAS PubMed.
- J. Wang and H. Q. Yu, Appl. Microbiol. Biotechnol., 2007, 75, 871–878 CrossRef CAS PubMed.
- G. Guibaud, S. Comte, F. Bordas, S. Dupuy and M. Baudu, Chemosphere, 2005, 59, 629–638 CrossRef CAS PubMed.
- K. Bernat and I. Wojnowska-Baryla, Biochem. Eng. J., 2007, 36, 116–122 CrossRef CAS.
- F. Ye, Y. Ye and Y. Li, Chemosphere, 2011, 84, 1250–1255 CrossRef CAS PubMed.
- K. Wolfstein and L. J. Stal, Mar. Ecol.: Prog. Ser., 2002, 236, 13–22 CrossRef.
- N. Mezhoud, F. Zili, N. Bouzidi, F. Helaoui, J. Ammar and H. Ben Ouada, Bioprocess Biosyst. Eng., 2014, 37, 2271–2280 CrossRef CAS PubMed.
- R. l. Yu, J. Liu, J. X. Tan, W. M. Zeng, L. J. Shi, G. H. Gu, W. Q. Qin and G. Z. Qiu, Int. J. Miner., Metall. Mater., 2014, 21, 311–316 CrossRef CAS.
- I. Ayala-Hernandez, A. Hassan, H. D. Goff, R. M. de Orduna and M. Corredig, Int. Dairy J., 2008, 18, 1109–1118 CrossRef CAS.
- B. Degeest and L. de Vuyst, Appl. Environ. Microbiol., 1999, 65, 2863–2870 CAS.
- L. A. Robertson and J. G. Kuenen, Arch. Microbiol., 1984, 139, 351–354 CrossRef CAS.
- J. D. Rock, M. R. Mahnane, M. F. Anjum, J. G. Shaw, R. C. Read and J. W. B. Moir, Mol. Microbiol., 2005, 58, 800–809 CrossRef CAS PubMed.
| This journal is © The Royal Society of Chemistry 2017 |