DOI:
10.1039/C7RA08092A
(Paper)
RSC Adv., 2017,
7, 46414-46430
Experimental and theoretical studies on corrosion inhibition of 4-amidinophenyl-2,2′-bifuran and its analogues in acidic media†
Received
22nd July 2017
, Accepted 24th September 2017
First published on 29th September 2017
Abstract
Corrosion inhibition studies of carbon steel (CS) in 1 M HCl by newly synthesized bichalcophene compounds namely; 4-(2,2′-bifuran-5-yl)benzamidine (MA-0947) and 6-(2,2′-bifuran-5-yl)nicotinamidine (MA-0941) and 6-[5-(thiophen-2-yl)furan-2-yl]nicotinamidine (MA-0940) have been conducted using chemical and electrochemical methods. MA-0940 exhibited the highest inhibition efficiency % η = 95% at 18 × 10−6 M. The adsorption and thermodynamic activation parameters were calculated and discussed. Potentiodynamic polarization (PP) studies showed that the investigated compounds act as mixed-type inhibitors and chemically adsorbed on CS surface following the Langmuir adsorption isotherm. The surface morphology was analyzed using Atomic Force Microscopy (AFM). The effect of molecular structure on the inhibition efficiency has been explored by quantum chemical computations. The relation between the inhibition efficiency and some quantum parameters has been discussed and obvious correlations were observed. The binding energies of tested bichalcophene derivatives on Fe (110) surfaces were calculated using molecular dynamics simulation. The adsorption energies between metal surface and investigated bichalcophenes followed the order: MA-0940 > MA-0941 > MA-0947 and this order is in good agreement with the experimental data.
1. Introduction
CS has significant industrial and economic importance owing to its unique mechanical properties and low cost compared to other metal alloys. Corrosion has always been a fundamental research subject and an industrial concern that gains endless attention.1,2 Corrosion of iron and its alloys causes huge financial loss, especially in petrochemical and oil–gas industries where acid solutions are commonly utilized in various operations, e.g., descaling, cleaning, pickling and oil-well acidizing applications.3 There is, however, a major risk to use acid solutions without further treatment with corrosion inhibitors because CS is severely attacked by acid solutions. Therefore, the use of corrosion inhibitors is a fundamental method to corrosion of metals in acidic media.4,5 The majority of efficient corrosion inhibitors are generally organic compounds that contain one or more heteroatoms, P, S, N, and O, which act as active centers because of their high electron density and great tendency to donate electrons that facilitate the adsorption process on metal surface and interfere with corrosion reactions occuring on metal surface, thereby protecting the metal and increasing the lifetime. The efficiency of an organic inhibitor in corrosion system depend on how strong the inhibitor is adsorbed on metal surface and its adsorption is directly linked to some physiochemical properties, structural electronic features, the nature of testing electrolyte and the charge on metal surface.6,7 It is well recognized that sulfur and nitrogen containing compounds have showed greater inhibition than those having only one of these atoms. Recently, much research on developing new efficient, eco-friendly and safe corrosion inhibitors has become very popular. To the authors' best knowledge, bichalcophene compounds have been scarcely evaluated as corrosion inhibitors. In a recent study we evaluated the corrosion inhibition characteristics of two bichalcophene compounds namely; 4-amidinophenyl-2,2′-bithiophene and its aza-analogue in which the results indicate that these compounds are excellent corrosion inhibitors and suggest their study would be meriting.8 In addition to this, taking into account the actual ecological problems, the interest for these compounds is also emphasized due to their non-toxic characteristics coupled with high solubility in the test solution, which enhances their inhibition efficiency. In view of this, our aim is to shed more light on the corrosion inhibitive properties of bichalcophene derivatives. In the present work, we have studied the corrosion inhibition of some other cationic bichalcophenes namely; 4-(2,2′-bifuran-5-yl)benzamidine (MA-0947), 6-(2,2′-bifuran-5-yl)nicotinamidine (MA-0941), and 6-[5-(thiophen-2-yl)furan-2-yl]nicotinamidine (MA-0940) on the corrosion behaviour of CS in 1 M HCl using different experimental and theoretical techniques. The tested bichalcophenes in this manuscript have been recently reported for their significant DNA-binding affinity,9 antibacterial,10 antimutagenic,11 and antiproliferative activities.12 In addition, bifuran derivative MA-0947 was proven to be more effective than vancomycin against methicillin-resistant Staphylococcus aureus infection in mice.13 Surface examination was conducted by atomic force microscopy (AFM). Quantum chemical computations and molecular dynamics simulation were analyzed and discussed. The study also aimed to portray the influence of molecular structure on the capability of these molecules to be adsorbed on the metal surface.
2. Experimental section
2.1. Materials and reagents
Seven identical CS specimens were cut out from CS sheet with chemical composition (wt%): C (0.076), Mn (0.19), P (0.012), Si (0.026), Cr (0.05), Al (0.023), and Fe (balance). The surface of CS samples and the working electrode was polished to mirror finish using different grades (400–2000) from grit emery papers, washed with deionized water, degreased in acetone. The test solution (1 M HCl) is diluted from HCl (37%) using ultrapure double distilled water.
2.2. Inhibitors
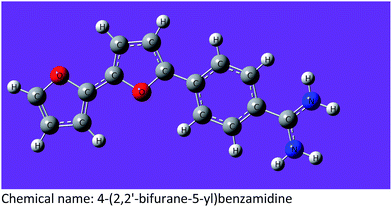
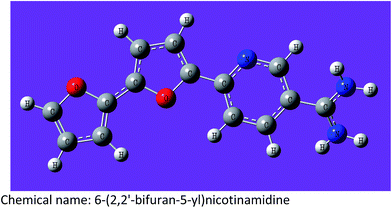
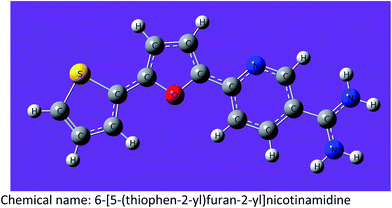
The molecular structures of investigated compounds are given in Table 1 and the synthetic route is shown in Fig. 1. The full details on the preparation methodology and structural elucidation of cationic bichalcophene 2a–c, including spectral data (IR, NMR, and Mass) has been earlier reported,9 and the same batch is used herein in our study. Preparation and characterization of starting material 1a & 1b is previously reported.14,15 The doses of inhibitor were 3 × 10⁻⁶, 6 × 10⁻⁶, 9 × 10⁻⁶, 12 × 10−6, 15 × 10−6, and 18 × 10−6 M.
Table 1 Chemical names, molecular structures, molecular formulas of the studied bichalcophenes
| Inhibitor code |
Molecular structures/chemical name |
Mol formulas (F. wt) |
| MA-0947 |
 |
C15H12N2O2–1HCl (288.72) |
| MA-0941 |
 |
C14H11N3O2–1HCl–0.8H2O (336.26) |
| MA-0940 |
 |
C14H11N3OS–2HCl (342.24) |
 |
| | Fig. 1 Synthetic route of 4-amidinophenyl-2,2′-bifuran (2a) and its nicotinamidine isosteres 2b & 2c. Reagents and conditions: (i) lithium bis-(trimethylsilyl) amide, (ii) ethanol/hydrogen chloride. | |
2.3. Atomic absorption measurements
Atomic Absorption Spectroscopy (AAS) is utilized to determine the amount of iron dissolved in uninhibited and inhibited 1 M HCl solutions after CS specimens are kept immersed in test solutions for 12 h. The inhibited dose of investigated compounds was 18 × 10−6 M. The % ηa was determined according to the following equation:| |
 | (1) |
where % ηa refers to the percentage of inhibition, and U, I are the amount of dissolved iron determined in free and inhibited 1 M HCl solutions, respectively.
2.4. Mass loss (ML) method
ML is a convenient and common method to evaluate the performance of corrosion inhibitors in acid solutions. The initial weight of thoroughly polished CS samples was predetermined before immersion into 100 ml of 1 M HCl solution without and with different doses of MA-0940, MA-0941 and MA-0947. The total immersion time was 3 h and the experiments were conducted at different temperatures. Every 30 minutes CS samples were removed from the solution, washed with double distilled water, then gently dried with air and the weight is determined again. ML measurements were conducted in triplicate and the average ML was calculated for reproducibility. The mass of each CS sample was measured before and after immersion using digital analytical balance with accuracy 0.0001 g.
2.5. Electrochemical methods
Electrochemical measurements employing ac and dc techniques were conducted using conventional three-electrode cell assembled in glass compartment with CS as working electrode (WE), a platinum foil as an auxiliary electrode, and a saturated calomel electrode (SCE) as reference electrode. The reported potentials in this work were measured with reference to the SCE. A framework from Gamry was used for all measurements. The procedure started with allowing the WE to reach a steady state by immersion into a test solution for 1 h at open circuit potential (EOCP). Then electrochemical impedance spectroscopy (EIS) was performed on the CS electrode at the EOCP. A perturbation signal with amplitude 10 mV was applied in the frequency range from 100 kHz to 0.02 Hz. The EIS data were fitted and analyzed carefully by E-chem analyst software. EFM measurements were utilized with 10 mV potential disturbance signal with two frequencies 2 and 5 Hz and the base frequency was 0.1 Hz with 12 cycles. At last, Tafel polarization curves were obtained by sweeping the electrode potential in the range of ±700 mV versus the EOCP with a scan rate of 1 mV s−1. The same test was conducted 3 times to ensure a satisfactory reproducibility.
2.6. Morphology analysis
Atomic force microscopy AFM (Nanosurf Flex) was used to examine the polished surface of CS samples before and after 12 h immersion in 1 M HCl blank solution, and inhibited solution with 18 × 10−6 M of inhibitors at 298 K.
2.7. Computational details
2.7.1. Dmol3. Quantum chemical parameters along with Fukui function indices were computed using DMol3 code installed in Materials Studio software version 7.0.16 All electronic calculations were accomplished using GGA/BLYP method with a double numerical basis set (DNP) with d and p polarization. The effect of solvent (aqueous phase) was considered in DMol3 calculations by including COSMO controls.17 The reliability of DNP basis set of Dmol3 method were compared with the computations obtained from Gaussian 09 program package at density functional theory (DFT) level using the 6-31G (d,p) basis set for all atoms and the atomic charges were determined using natural bond orbital (NBO) analysis.18 The preferential adsorption centers of the inhibitor molecule could be predicted from the plots of Frontier Molecular Orbitals (FMOs). The quantum parameters chemical softness (σ), hardness (η), electronegativity (χ), chemical potential (Pi), and electrophilicity index (ω) were calculated. These parameters are related to each other as follows;19–21| | |
η = 1/2(ELUMO − EHOMO)
| (2) |
| | |
χ = 1/2(EHOMO + ELUMO)
| (4) |
2.7.2. Molecular dynamic (MD) modelling. The simulation of adsorption for one single molecule of investigated inhibitors on CS surface was performed with MD method using COMPASS, an ab initio Force-Field Optimized for Condensed-Phase, from Accelrys Inc.22,23 Since Fe (110) cleavage surface has the most stable low Miller index, it has been adopted to represent CS substrate. The interaction between bichalcophene derivatives and CS (110) surface was simulated in a box (2.2 × 2.2 × 4.3 nm) using a Monte Carlo search implemented in Material studio software package. The spatial position of iron atoms in Fe (110) were kept fixed, and the surface plane was loaded with one protonated molecule of inhibitor, 4H3O+, 5Cl− and 200 water molecules to model part of the studied corrosion system at the atomistic level. The course of interaction was processed until a low energy adsorption configuration is established. The procedure used to prepare the iron surface and build the modelling corrosion system is described in more details elsewhere.24 The top layer was defined as the adsorption surface region and selected as target atoms. The maximum distance between the adsorbate molecule and the surface target atoms was 15 Å. All structures included in this method are geometrically optimized to ensure the accuracy of the results. Although this is an oversimplification for the factual system, it is sufficiently elucidate the variations in the adsorption action of investigated molecules and provide adequate proof to rationalize our experimental results.
3. Results and discussion
3.1. Atomic absorbance spectroscopy (AAS)
The quantitative analysis from AAS measurements are given in Table 2, it is clear from the results that the amount of dissolved iron was significantly lower in inhibitor-containing solution than in free acid solution. MA-0940 and MA-0941 are more efficient inhibitors and the values of % η followed this order MA-0940 < MA-0941 < MA-0947.
Table 2 The content of iron dissolved in 1 M HCl blank and inhibited solutions containing (18 × 10−6 M) of the investigated compounds
| Inhibitor |
Amount of iron content (μg mL−1) |
% ηa |
| Free/blank |
7.157 |
|
| MA-0947 |
0.563 |
92.13 |
| MA-0941 |
0.402 |
94.38 |
| MA-0940 |
0.334 |
95.33 |
3.2. Mass loss (ML) method
3.2.1. Effect of dose. The relationship between ML corrosion parameters and the dose of MA-0940 is displayed in Fig. 2 and similar results obtained for MA-0947 and MA-0941 are presented in Fig. S1 in the ESI.† The ML corrosion parameters of tested compounds in Table 3 such as corrosion rate (CR) and ηML are determined using the following equations;| |
 | (7) |
| |
 | (8) |
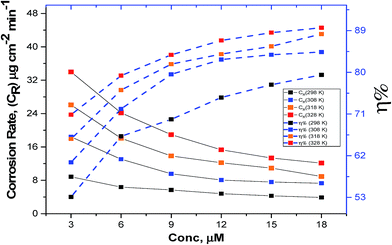 |
| | Fig. 2 Variation of CR and % η with difference doses of MA-0940. | |
Table 3 ML corrosion parameters of CS in 1 M HCl in nonexistence and existence of various doses of bichalcophene derivatives at different temperatures
| [Cinh] (M) |
25 °C |
35 °C |
45 °C |
55 °C |
| CR (mg cm−2 min−1) × 10−3 |
% η |
CR (mg cm−2 min−1) × 10−3 |
% η |
CR (mg cm−2 min−1) × 10−3 |
% η |
CR (mg cm−2 min−1) × 10−3 |
% η |
| 0 |
18.83 |
— |
46.73 |
— |
75.87 |
— |
116.66 |
— |
![[thin space (1/6-em)]](https://www.rsc.org/images/entities/char_2009.gif) |
| MA-0947 |
| 3 × 10⁻⁶ |
10.38 |
44.89 |
22.49 |
51.87 |
33.55 |
55.79 |
46.06 |
60.52 |
| 6 × 10⁻⁶ |
7.88 |
58.17 |
16.80 |
64.05 |
23.92 |
68.47 |
31.82 |
72.73 |
| 9 × 10⁻⁶ |
6.92 |
63.23 |
13.10 |
71.97 |
18.67 |
75.39 |
26.27 |
77.48 |
| 12 × 10−6 |
6.09 |
67.64 |
11.55 |
75.28 |
15.75 |
79.24 |
23.08 |
80.22 |
| 15 × 10−6 |
5.27 |
72.02 |
10.08 |
78.42 |
14.00 |
81.55 |
19.64 |
83.16 |
| 18 × 10−6 |
4.69 |
75.08 |
9.16 |
80.39 |
12.08 |
84.07 |
17.23 |
85.23 |
![[thin space (1/6-em)]](https://www.rsc.org/images/entities/char_2009.gif) |
| MA-0941 |
| 3 × 10⁻⁶ |
9.32 |
50.52 |
19.89 |
57.42 |
28.03 |
63.05 |
37.88 |
67.53 |
| 6 × 10⁻⁶ |
6.99 |
62.91 |
13.88 |
70.31 |
18.91 |
75.07 |
26.6 |
77.2 |
| 9 × 10⁻⁶ |
6.04 |
67.95 |
10.54 |
77.45 |
15.36 |
79.75 |
21.72 |
81.39 |
| 12 × 10−6 |
5.21 |
72.33 |
9.17 |
80.38 |
12.81 |
83.12 |
18.63 |
84.03 |
| 15 × 10−6 |
4.52 |
76.02 |
8.17 |
82.5 |
11.59 |
84.73 |
15 |
87.14 |
| 18 × 10−6 |
4.07 |
78.41 |
7.79 |
83.33 |
9.77 |
87.13 |
13.39 |
88.52 |
![[thin space (1/6-em)]](https://www.rsc.org/images/entities/char_2009.gif) |
| MA-0940 |
| 3 × 10⁻⁶ |
8.83 |
53.10 |
18.42 |
60.58 |
26.08 |
65.62 |
33.99 |
70.86 |
| 6 × 10⁻⁶ |
6.37 |
66.19 |
13.04 |
72.09 |
18.08 |
76.17 |
24.16 |
79.29 |
| 9 × 10⁻⁶ |
5.68 |
69.85 |
9.56 |
79.55 |
13.84 |
81.76 |
18.94 |
83.76 |
| 12 × 10−6 |
4.79 |
74.56 |
8.06 |
82.75 |
12.20 |
83.92 |
15.32 |
86.87 |
| 15 × 10−6 |
4.27 |
77.32 |
7.57 |
83.79 |
10.92 |
85.61 |
13.35 |
88.56 |
| 18 × 10−6 |
3.87 |
79.45 |
7.30 |
84.38 |
8.90 |
88.27 |
12.11 |
89.62 |
It is noted that the existence of bichalcophene derivatives in test solution caused a decrease in (CR), reflecting an increase in % ηML. This influence is extended at all studied doses of investigated bichalcophenes. The maximum inhibitory potential was observed when the test solution was pretreated with (18 × 10−6 M) of the investigated compounds. This finding might be due to the abundance of electron donors (S and N) and aromatic rings at metal/solution interface with incremental dose of inhibitors. In acidic solutions, during the anodic reaction of corrosion process, Fe2+ dissolves into aqueous solution, simultaneously the cathodic reaction resulting in discharging H+ adsorbed at metal surface to produce H2 or reduction of O2. However, in inhibitor-containing solutions, the anodic or/and cathodic reactions retarded by the adsorption of inhibitor molecules on the metal surface. From the results in Table 3, MA-0940 exhibited the highest inhibition efficiency, while MA-0947 showed the lowest inhibition efficiency in this study. The variation in the % ηML could be due to the difference in molecular structure features. The unshared e′ on N, S and O atoms contribute in the adsorption of these molecules on CS surface (chemisorption) and enhances the inhibitory potential of compounds compared to phenyl bifuran compound MA-0947. Aromatic rings are responsible for the weak electrostatic interaction between inhibitors and CS surface (physisorption).25 Furthermore, bichalcophene species are easily protonated in acid media which also take part in the competing adsorption with Clads− ions adsorbed on CS surface.
3.2.2. Influence of temperature. The influence of temperature on the corrosion behaviour of CS in uninhibited and inhibited test solution was examined. The adsorption mechanism (physically or chemically onto metal surface) can be proposed from the analysis of these information. Chemical adsorption is strengthened by increasing the temperature, while at lower temperature physisorption predominates. The apparent activation energy ( ) is related to corrosion rate CR as described by Arrhenius equation:26
| |
 | (9) |
where, T is absolute temperature, R is universal gas constant (8.314 J K−1 mol−1), and A is the Arrhenius pre-exponential factor. Furthermore, other thermodynamic activation parameters were calculated using transition state equation:27| |
log![[thin space (1/6-em)]](https://www.rsc.org/images/entities/char_2009.gif) kcorr = log(R/Nh) + (ΔS*/2.303R) + ΔH*/2.303RT) kcorr = log(R/Nh) + (ΔS*/2.303R) + ΔH*/2.303RT)
| (10) |
where, N is Avogadro's number, h is Planck's constant, ΔH* and ΔS* is the enthalpy and entropy of activation, respectively. Fig. 3 gives an example of Arrhenius and transition state plots for dissolution of CS in 1 M HCl without and with different doses of MA-0940. Similar plot for MA-0947 and MA-0941 are given in Fig. S2 in the ESI.†
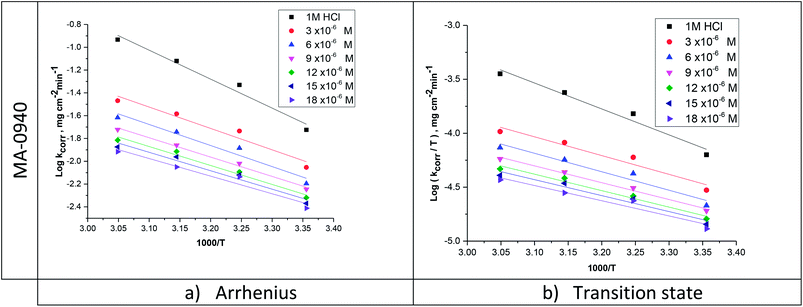 |
| | Fig. 3 (a) Arrhenius and (b) transition state plots for CS corrosion in 1 M HCl in the absence and presence of MA-0940. | |
The values of Ea were determined from the slopes of straight lines in Fig. 3a. The values of ΔH* and ΔS* were also evaluated from the straight lines Fig. 3b. The slope of these lines [−ΔH*/(2.303R)] and intercept [log(R/Nh) + ΔS*/(2.303R)], respectively. The values of Ea, ΔH* and ΔS* are listed in Table 4.
Table 4 Activation thermodynamic parameters for dissolution of CS with and without 18 × 10−6 M of investigated bichalcophene derivatives and ΔG* at different temperatures
| Inh |
Activation parameters |
+ΔG* |
| Ea (kJ mol−1) |
ΔH* (kJ mol−1) |
ΔS* (J mol−1 K−1) |
298 K |
308 K |
318 K |
328 K |
| 1 M HCl |
48.60 |
46 |
−122.49 |
36.55 |
37.77 |
39 |
40.22 |
| MA-0947 |
34.09 |
31.49 |
−183 |
54.56 |
56.39 |
58.22 |
60.05 |
| MA-0941 |
31.04 |
28.45 |
−194.33 |
57.94 |
59.88 |
61.83 |
63.77 |
| MA-0940 |
29.57 |
26.97 |
−199.70 |
59.54 |
61.53 |
63.53 |
65.53 |
Generally, chemisorption mechanism is indicated from the higher value of Ea observed for free acid solution compared to the inhibited one. This can be explained in terms of a shift of net corrosion process from exposed surface to adsorbed sites accounts for decrease in Ea at higher levels of inhibition.28 Also, increase in Ea at higher temperatures can be associated with decrease in adsorption of inhibitor molecules onto metal surface. The results in Table 4 showed that the values of Ea in the presence of bichalcophene compounds are lower than that of the blank solution. This supports chemisorption mechanism in which a co-ordination bond is formed due to sharing and/or transition of electrons from inhibitors to vacant-d-orbital of iron surface atoms, interfering with the anodic reaction of the corrosion process.29 However, a lower value of Ea in the presence of CI− compared to free solution suggests chemisorption of inhibitor molecules. The values of Ea and ΔH* in Table 4 are relatively close and follow the same pattern. This is in line with the concept of transition-state theory. A positive value of ΔH* indicates that the metal dissolution is an endothermic process.30 This has also been reported to be indicative of retarded dissolution of metal in inhibitor-containing solution.
The values of ΔS* for three inhibitor molecules are negative, indicating that the rate determining step involves association rather than dissociating phenomenon in the formation of activated complex.31 This means, transition from reactants to activated complex was accompanied by decrease in disorder. In the presence of inhibitors, the discharge of hydrogen ions to form adsorbed hydrogen atoms at the metal surface will be prevented by the adsorption of inhibitor molecules. This causes the system to pass from a more orderly to a less orderly arrangement. It was also observed that the ΔS* in the presence of MA-0940 is more negative than that of other inhibitors. This may be attributed to the larger molecular weight of MA-0940, resulting in a more pronounced decrease in disorderliness upon activated complex formation. The change in free energy (ΔG*) activation for CS in 1 M HCl in the absence and presence of investigated compounds was calculated using the equation:
The values of ΔG* listed in Table 4 are positive suggesting that the activated complex is unstable. ΔG* increases very slightly with increasing temperature, suggesting that relative thermodynamic favorability of activated complex formation decreases with increasing temperature.
3.2.3. Adsorption isotherms. The inhibition action of corrosion inhibitor is dependent on its adsorption behaviour on CS surface. Since the interaction forces between water molecules and CS surface is lower than the one between the inhibitor compound and CS surface, a substitution adsorption process can be established and water molecules adsorbed on the metal surface (H2O)ads are replaced by inhibitor molecules in the aqueous phase (Orgaq).| | |
xH2Oads + Orgsol ⇔ Orgads + xH2O
| (12) |
where x represents the size ratio; the number of water molecules substituted with one inhibitor molecule. The adsorption of inhibitors can either occur physically or chemically on a corroding CS surface, where the physisorbed molecules retard metal dissolution by inhibiting the cathodic reaction while chemisorbed molecules inhibit the anodic reaction by reducing the inherent reactivity of the metal at adsorption sites. Langmuir adsorption isotherm showed the best fit for all tested bichalcophenes which is defined by the following equation:32| |
 | (13) |
where Kads is the equilibrium constant of adsorption process and C is dose of inhibitor. Linear plots of C/θ versus C for investigated compounds are obtained. Only Langmuir plots for MA-0940 are presented in Fig. 4. Langmuir linear curves for MA-0947 and MA-0941 are provided in Fig. S3 in the ESI.† The correlation coefficients (R2) and slope of these linear plots were found close to unity.  is an important thermodynamic parameter which can be calculated from the following equation.33
| |
 | (14) |
where 55.5 is the molar dose of water in mol−1.
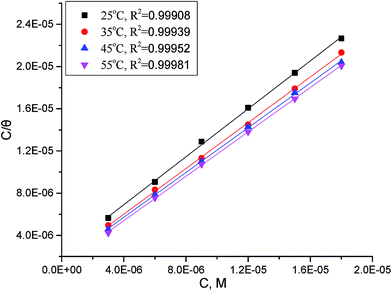 |
| | Fig. 4 Langmuir's isotherm plots for adsorption of MA-0940 on CS surface in 1 M HCl. | |
In addition, other important thermodynamic adsorption coefficients such as the enthalpy and the entropy of adsorption ( and
and  respectively) were calculated according to Van't Hoff equation:
| |
 | (15) |
Plots of log (Kads) versus 1/T in (Fig. 5) are straight lines with slopes [−ΔH°ads/2.303RT] used to calculate (ΔH°ads). From the calculated data of ΔH°ads and ΔG°ads, the entropy of adsorption ΔS°ads can be determined according to the general thermodynamic equation:
| |
 | (16) |
The thermodynamic adsorption parameters for studied bichalcophene derivatives on CS surface are summarized in Table 5, the values of Kads are large and increase with temperature, and this indicates a strong interaction between bichalcophene derivatives and CS surface which is also strengthened with temperature, proving that the investigated compounds are efficient corrosion inhibitors for CS in hydrochloric acid solutions.
Table 5 Thermodynamic adsorption parameters of bithiophene derivatives on CS in 1 M HCl with optimum doses at different temperatures
| Inhibitor |
Temp., K |
Kads, ×104 M−1 |

|

|

|
| MA-0947 |
298 |
28.75 |
41.10 |
16.74 |
194.10 |
| 303 |
38.30 |
43.21 |
194.66 |
| 313 |
43.89 |
44.98 |
194.09 |
| 323 |
55.40 |
47.03 |
194.42 |
| MA-0941 |
298 |
36.18 |
41.67 |
17.42 |
198.29 |
| 303 |
51.67 |
43.98 |
199.36 |
| 313 |
61.48 |
45.87 |
199.03 |
| 323 |
70.59 |
47.69 |
198.50 |
| MA-0940 |
298 |
42.25 |
42.05 |
17.50 |
199.85 |
| 303 |
59.83 |
44.35 |
200.83 |
| 313 |
67.64 |
46.12 |
200.07 |
| 323 |
84.30 |
48.17 |
200.22 |
From the results in Table 5, the values of  are negative and less than −40 kJ mol−1 which indicate that bichalcophenes are chemisorbed spontaneously on CS surface.
  values become more negative on increasing temperature. This reflects the endothermic nature of the adsorption process, which is further confirmed from the positive values of
  . In addition, the large positive values of
  is commonly typical with endothermic adsorption process. In general, an endothermic process is mostly attributed to chemisorption and involve electron transfer from inhibitor to metal surface to form coordinate bond while exothermic adsorption process suggests either physisorption or chemisorption.34 The unshared electron pairs in investigated molecules may interact with d-orbital of CS to provide chemisorbed film.
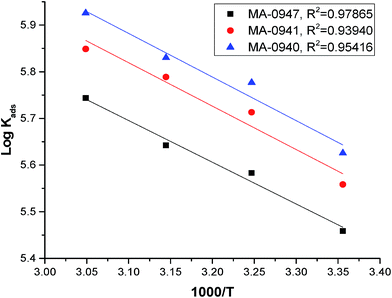 |
| | Fig. 5 Curves fitting of (log![[thin space (1/6-em)]](https://www.rsc.org/images/entities/char_2009.gif) Kads vs. 1/T) for the adsorption of bichalcophene inhibitors in 1 M HCl. Kads vs. 1/T) for the adsorption of bichalcophene inhibitors in 1 M HCl. | |
3.3. Tafel polarization technique
Tafel plots for CS electrode in uninhibited and inhibitor-containing solutions with different doses of MA-0940 are shown in Fig. 6. Tafel curves of CS in 1 M HCl without and with various doses of Tafel plots for MA-0947 and MA-0941 are given in the ESI (Fig. S4).† The variation of electrochemical parameters, including; corrosion current density (icorr), corrosion potential (Ecorr), anodic and cathodic Tafel slopes (βa, βc), with the dose of inhibitors are summarized in Table 6. The ηpp% are calculated using the following equation:35| |
 | (17) |
where i0corr and icorr represent the current densities of CS electrode in free and inhibitor-containing solution, respectively.
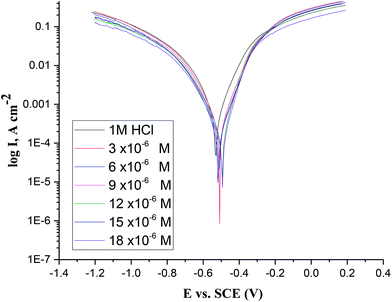 |
| | Fig. 6 Tafel curves of CS in 1 M HCl without and with various doses of MA-0940. | |
Table 6 Tafel and EIS parameters of CS in 1 M HCl without and with various doses of investigated inhibitors at 298 K
| Conc. (M) |
−Ecorr (mV per SCE) |
icorr (μA cm−2) |
βa mV dec−1 |
βc mV dec−1 |
% ηPDP |
Rct |
Cdl |
% ηEIS |
| Blank |
−530 |
627.73 |
101 |
122 |
— |
32.64 |
103.36 |
— |
![[thin space (1/6-em)]](https://www.rsc.org/images/entities/char_2009.gif) |
| MA-0947 |
| 3 × 10⁻⁶ |
522 |
377.67 |
100 |
129 |
39.8 |
47.80 |
78.36 |
31.7 |
| 6 × 10⁻⁶ |
517 |
365.55 |
97 |
116 |
41.8 |
57.00 |
76.16 |
42.7 |
| 9 × 10⁻⁶ |
515 |
294.25 |
85 |
115 |
53.1 |
64.24 |
65.78 |
49.2 |
| 12 × 10−6 |
543 |
225.57 |
111 |
106 |
64.1 |
76.13 |
64.69 |
57.1 |
| 15 × 10−6 |
502 |
190.92 |
87 |
126 |
69.6 |
83.90 |
60.53 |
61.1 |
| 18 × 10−6 |
517 |
179.80 |
89 |
102 |
71.4 |
96.40 |
59.28 |
66.1 |
![[thin space (1/6-em)]](https://www.rsc.org/images/entities/char_2009.gif) |
| MA-0941 |
| 3 × 10⁻⁶ |
513 |
338.05 |
89 |
114 |
46.1 |
61.83 |
54.70 |
47.2 |
| 6 × 10⁻⁶ |
506 |
275.34 |
82 |
119 |
56.1 |
66.33 |
48.25 |
50.8 |
| 9 × 10⁻⁶ |
507 |
202.67 |
83 |
124 |
67.7 |
73.69 |
45.32 |
55.7 |
| 12 × 10−6 |
518 |
174.58 |
102 |
116 |
72.2 |
79.94 |
42.97 |
59.2 |
| 15 × 10−6 |
522 |
158.43 |
97 |
112 |
74.8 |
84.01 |
41.65 |
61.1 |
| 18 × 10−6 |
517 |
140.56 |
80 |
101 |
77.6 |
91.88 |
36.77 |
64.5 |
![[thin space (1/6-em)]](https://www.rsc.org/images/entities/char_2009.gif) |
| MA-0940 |
| 3 × 10⁻⁶ |
509 |
294.74 |
91 |
112 |
53.0 |
73.04 |
50.79 |
55.3 |
| 6 × 10⁻⁶ |
512 |
228.18 |
92 |
113 |
63.6 |
86.85 |
46.66 |
62.4 |
| 9 × 10⁻⁶ |
495 |
179.29 |
74 |
111 |
71.4 |
105.30 |
39.17 |
69.0 |
| 12 × 10−6 |
495 |
173.68 |
71 |
114 |
72.3 |
125.50 |
38.26 |
74.0 |
| 15 × 10−6 |
518 |
144.66 |
78 |
101 |
77.0 |
139.00 |
40.18 |
76.5 |
| 18 × 10−6 |
494 |
135.55 |
70 |
114 |
78.4 |
152.90 |
31.72 |
78.7 |
Fig. 6 shows a slight shift in both anodic and cathodic lines to lower values of current densities as the dose of investigated compound increases, this reflects a reduction in the corrosion rate of CS in test solutions and the inhibitors are of mixed type at all studied concentration. Also it can be noticed that the corrosion potentials were nearly close to that of the blank solution (1 M HCl), while corrosion current densities of the anodic and cathodic polarization curves has dropped simultaneously.36 This behaviour indicates that bichalcophene compounds act as mixed-type inhibitors by interfering with both cathodic and anodic reactions occur on CS surface.37
As revealed from results in Table 6, the values of βa and βc are similar with the others, showing that the addition of these inhibitors has not changed the nature of corrosion mechanism. The (icorr) decrease and % η increases with increasing the dose of inhibitors. The maximum value of % ηPDP is >78% with MA-0940. This accounts for the adsorption of inhibitor molecules on CS surface and blocking the corrosion cells to protect it from corrosion deterioration.
3.4. Electrochemical impedance spectroscopy (EIS) technique
EIS for the dissolution of CS in 1 M HCl without and with various doses of bichalcophene inhibitors were performed to gain more information about the kinetics of the electrode processes. The corresponding EIS (Nyquist and Bode) plots for MA-0940 are given in Fig. 7. Similar EIS diagrams are observed for MA-0947 and MA-0941 and presented in Fig. S5 in the ESI.†
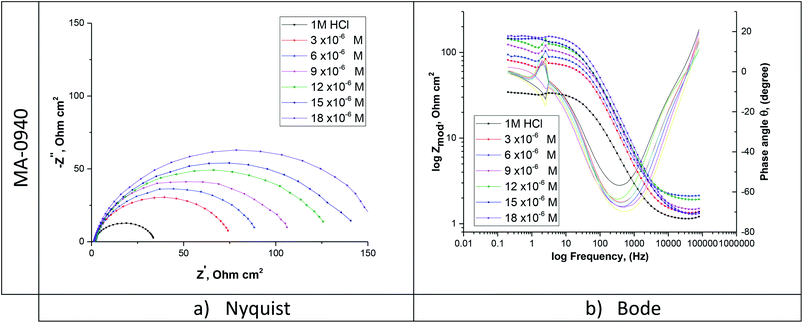 |
| | Fig. 7 (a) Nyquist and (b) Bode diagrams for CS in 1 M HCl containing different doses of MA-0940. | |
As seen from Fig. 7, Nyquist plots are presented as a single capacitive loop, showing that the dissolution of CS in 1 M HCl without and with inhibition depends on charge-transfer and double layer capacitance at metal/solution interface.38 At all tested doses, the impedance spectra show similar patterns, reflecting that the corrosion mechanism does not change on addition of bichalcophenes inhibitors.39 By contrast, the diameter of semicircles becomes wider with increasing the concentration of investigated bichalcophenes in test solution. It is worth mentioning that the centers of Nyquist depressed semicircles were under the real axis due to the dispersion effect in frequency.40 This phenomenon appeared because the electrode surface might have roughness, the surface chemical could be heterogeneous especially at grain boundaries, and adsorption–desorption process of the inhibitors molecules at metal/solution interface.41 Therefore, a constant phase element (CPE) were included in the equivalent circuit in Fig. 8 to analyze the EIS data. Here, Rct is the charge transfer resistance and Rs represents the solution resistance.
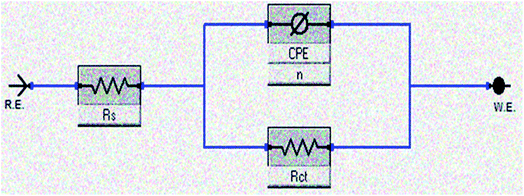 |
| | Fig. 8 Equivalent electrical circuit model constructed to fit the EIS data on CS/solution interface. | |
EIS data are given Table 6. The CPE impedance (ZCPE) is defined by the following equation,
| |
 | (18) |
where
Yo is the modulus of the CPE, j is the imaginary root (j
2 = −1),
w represents the angular frequency,
n is the deviation parameter in terms of a phase shift.
When n = 1, CPE represents a pure capacitor, for n = 0, a pure resistor, and for n![[thin space (1/6-em)]](https://www.rsc.org/images/entities/i_char_2009.gif) =
= ![[thin space (1/6-em)]](https://www.rsc.org/images/entities/char_2009.gif) −1, an inductor. The values of Cdl were calculated as follows,
−1, an inductor. The values of Cdl were calculated as follows,
where
wmax = 2π
fmax and
fmax is the frequency at the maximum value of the imaginary component of EIS spectra.
The values of ηEIS from EIS parameters are calculated by the following equation,
| |
 | (20) |
where
Rct and

, are the charge transfer resistances for CS in 1 M HCl solution with and without inhibitors, respectively.
It is clear from the results in Table 6 that Rct values increase with increasing the concentration of bichalcophene derivatives in test solution. While, the values of Cdl decreased with increasing the concentration of inhibitors.42 This behaviour can be attributed to the adsorption of studied bichalcophenes on CS/solution interface which blocks corrosion cells on metal surface and combat corrosion.43 Further, bichalcophene inhibitors gradually substituted water molecules on CS surface which lower the local dielectric constant and increase the thickness of electrical double-layer. All these factors cause Cdl to decrease.44 Accordingly, corrosion protection was improving with incremental dose of inhibitors, showing that bichalcophene compounds retards corrosion of CS in 1 M HCl solutions. The results of EIS studies were in consistent with ML and PP measurements.
3.5. Electrochemical frequency modulation (EFM) technique
EFM is a powerful nondestructive electrochemical method used to determine corrosion rate without prior knowledge of the Tafel constants. One main advantage of EFM is that corrosion rate, Tafel parameters and causality factors CF-2, CF-3 are measured in a single data set.45 In Table 7 the EFM parameters, for studied corrosion systems, are listed. Fig. 9 shows an example of EFM intermodulation spectra, for CS in uninhibited and inhibited test solution with MA-0940, generated as a result of current response as a function of frequency. Similar EFM spectra for MA-0947 and MA-0941 are displayed in Fig. S6 in the ESI.† The % ηEFM was calculated according to eqn (21).| |
 | (21) |
where ib and i are corrosion current densities of CS electrode in blank and inhibitor-containing solutions, respectively.
Table 7 EFM corrosion parameters for CS in 1 M HCl solutions containing various doses of bichalcophene compounds at 298 K
| Conc. (M) |
icorr (μA m−2) |
βa (mV dec−1) |
βc (mV dec−1) |
CR mpy |
CF-2 |
CF-3 |
% η |
| Blank |
549.30 |
88 |
93 |
251 |
1.08 |
2.71 |
— |
![[thin space (1/6-em)]](https://www.rsc.org/images/entities/char_2009.gif) |
| MA-0947 |
| 3 × 10⁻⁶ |
306.9 |
113 |
135 |
140.2 |
2.311 |
3.026 |
44.1 |
| 6 × 10⁻⁶ |
298.1 |
87 |
98 |
136.2 |
1.762 |
3.226 |
45.7 |
| 9 × 10⁻⁶ |
270.7 |
110 |
130 |
123.7 |
1.55 |
3.068 |
50.7 |
| 12 × 10−6 |
247.5 |
118 |
133 |
113.1 |
2.622 |
3.703 |
54.9 |
| 15 × 10−6 |
241.2 |
81 |
97 |
110.2 |
2.008 |
3.053 |
56.1 |
| 18 × 10−6 |
221.8 |
79 |
95 |
101.3 |
1.822 |
3.49 |
59.6 |
![[thin space (1/6-em)]](https://www.rsc.org/images/entities/char_2009.gif) |
| MA-0941 |
| 3 × 10⁻⁶ |
196.3 |
78 |
85 |
89.68 |
1.163 |
3.186 |
64.3 |
| 6 × 10⁻⁶ |
190.3 |
88 |
97 |
86.94 |
1.618 |
3.761 |
65.4 |
| 9 × 10⁻⁶ |
176.1 |
79 |
89 |
80.46 |
1.575 |
2.966 |
67.9 |
| 12 × 10−6 |
165.7 |
79 |
91 |
75.69 |
1.703 |
3.045 |
69.8 |
| 15 × 10−6 |
151.6 |
76 |
89 |
69.29 |
1.86 |
2.545 |
72.4 |
| 18 × 10−6 |
150 |
78 |
89 |
68.55 |
1.683 |
3.279 |
72.7 |
![[thin space (1/6-em)]](https://www.rsc.org/images/entities/char_2009.gif) |
| MA-0940 |
| 3 × 10⁻⁶ |
127.3 |
95 |
104 |
58.17 |
1.089 |
3.528 |
76.8 |
| 6 × 10⁻⁶ |
114.4 |
83 |
90 |
52.26 |
1.292 |
3.622 |
79.2 |
| 9 × 10⁻⁶ |
108.1 |
85 |
92 |
49.42 |
1.129 |
3.287 |
80.3 |
| 12 × 10−6 |
95.5 |
78 |
93 |
43.65 |
1.763 |
2.721 |
82.6 |
| 15 × 10−6 |
93.0 |
81 |
90 |
42.5 |
2.121 |
2.434 |
83.1 |
| 18 × 10−6 |
89.7 |
88 |
110 |
40.99 |
1.994 |
3.415 |
83.7 |
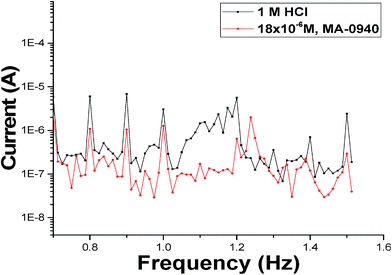 |
| | Fig. 9 EFM spectra of (blank) and test solution contains 18 × 10−6 M of MA-0940 at 298 K. | |
As can be seen from Table 7, icorr continue to decrease on increasing the inhibitor dose. The causality factors CF-2 and CF-3 are used to check the validity of EFM data and these factors are calculated from the frequency spectrum of the current responses which are found approximately close to the standard values (2 and 3) indicating that the measured data are verified with good quality and not affected by noise.46 A minor variation in the actual causality factors from the theoretical values may account for the lower value of the perturbation amplitude or/and the insufficient resolution in the frequency spectrum.47
3.6. Atomic force microscopic (AFM) technique
Three dimensional (3D) cross-sectional profiles of AFM images for CS surface are shown in Fig. 10. AFM image in Fig. 10b for CS surface exposed to blank solution revealed cracked and corroded CS surface due to the acid attack. The surface of CS in the presence of inhibitors was not affected as the one without the inhibitors. The average surface roughness obtained for the polished surface of CS was 46 nm. Estimated average roughness of CS in blank solution was 587 nm, while the corresponding values in the presence of 18 × 10−6 M of MA-0947, MA-0941 and MA-0940 are 123.31 nm, 117.8 nm and 111.2 nm, respectively. These values of surface roughness confirm that the CS surface is protected by the inhibitor molecules, most probably by formation of protective film from inhibitors molecules on CS surface.
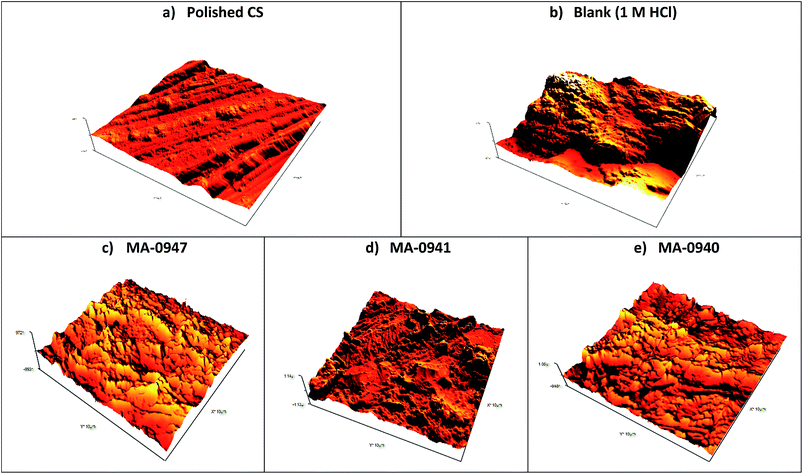 |
| | Fig. 10 AFM 3D micrographs for CS surface (a) before, (b) after immersion for 12 h in blank solution and (c) test solution contains 18 × 10−6 M of MA-0947 (d) MA-0941 (e) MA-0940. | |
3.7. Quantum calculation methods
The use of quantum calculation parameters in corrosion inhibition studies has two main features; first, understanding the relationship between the molecular structure of inhibitor and its inhibition behavior; secondly, establishing a proposed inhibition mechanism in terms of chemical reactivity of compounds. The molecular reactivity of inhibitors was explored by relating some quantum descriptor variables to the calculated experimental % η values. FMOs of bichalcophene molecules are shown in Fig. 11. It is well acknowledged that the interaction between reacting species occurs via the involvement of FMOs i.e. HOMO and LUMO.48 Ionization potential (IP) = −EHomo corresponds to the electron donating ability of the inhibitor and characterizes the susceptibility of the molecule to donate electron. While the LUMO energy is related to the electron affinity (EA) = −ELumo and portrays the tendency of the molecule to accept electrons. Efficient corrosion inhibitors are usually those organic compounds that can play the two roles; donating electrons to vacant orbital of the metal and acquiring free electrons from the metal surface. The lower the value of ELUMO is, the higher the value of electron affinity, i.e., the stronger the susceptibility of the molecule to accept electron. Thus, this reaction is also characterized with the transfer of electrons from the metal to the inhibitor and form a bond via back-donation from the metal surface to the π* orbital of the inhibitor. This will strengthen the interaction between the inhibitor and the metal surface and accordingly increases its adsorption and inhibition efficiency.
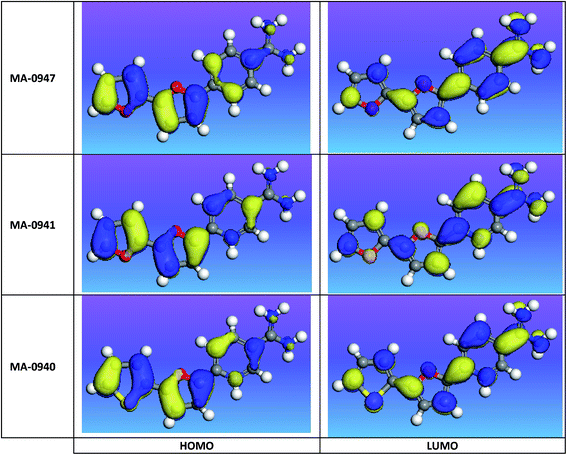 |
| | Fig. 11 FMOs of bichalcophene derivatives at DFT-level computational method. | |
Energy gap (ΔE = ELUMO − EHOMO) is an important quantum parameter that can be used to understand the reactivity of the inhibitor molecule toward the adsorption on metallic surface. The lower the value of ΔE is, the more probable that the compound has inhibition efficiency. The results obtained from quantum chemical computations are summarized in Table 8. It is apparent from the computational results that LUMO energies decrease in the order of MA-0947 > MA-0941 > MA-0940, indicating that the ability of bichalcophene derivatives to accept electrons from CS surface following the order MA-0940 > MA-0941 > MA-0947. On the contrary, there was no link between the HOMO energies and the order of experimental η, this finding is often explained by the complex nature of interactions in the adsorption process.49 However, the ΔE was found to decrease in the order of MA-0947 > MA-0941 > MA-0940, which gives an indication that the stability of the formed complex on the metal surface follows the order of MA-0940 > MA-0941 > MA-0947 and this is due to the existence of S and N atoms in MA-0940 compound. Other quantum chemical parameters were used as reactivity descriptors in chemical reactions such as the absolute hardness, η, softness, σ, and electronegativity, χ. A soft molecule has lower energy gap while a hard one has higher energy gap. Hard molecule is less reactive than soft one because they could effectively donate electrons to a good electron acceptor. In inhibitive corrosion systems, the inhibitor works as a Lewis base while the metal behaves as a Lewis acid. Thus, the theoretical results indicated that MA-0940 would show the highest corrosion inhibition efficiency since it has the lowest ΔE and the highest softness value. Further, the order at which softness decreases along with the molecular reactivity was as follows: MA-0940 > MA-0941 > MA-0947; (σ).
Table 8 Quantum chemical parameters calculated for bichalcophene inhibitors in aqueous solutions
| Inhibitor |
Total energy (au) |
EHOMO (eV) |
ELUMO (eV) |
ΔE |
η |
σ (S) |
χ |
Dipole moment (debye) |
| Dmol3-neutral |
| MA-0947 |
−839.05 |
−4.76 |
−2.81 |
1.950 |
0.98 |
1.03 |
3.79 |
2.61 |
| MA-0941 |
−855.12 |
−4.90 |
−2.96 |
1.939 |
0.97 |
1.03 |
3.93 |
2.42 |
| MA-0940 |
−1178.13 |
−4.96 |
−3.11 |
1.846 |
0.92 |
1.08 |
4.03 |
1.31 |
![[thin space (1/6-em)]](https://www.rsc.org/images/entities/char_2009.gif) |
| Dmol3-protonated |
| MA-0947+ |
−839.51 |
−5.16 |
−3.34 |
1.820 |
0.91 |
1.10 |
4.25 |
12.59 |
| MA-0941+ |
−856.01 |
−5.81 |
−4.01 |
1.800 |
0.90 |
1.11 |
4.91 |
17.08 |
| MA-0940+ |
−1179.01 |
−5.85 |
−4.09 |
1.759 |
0.88 |
1.14 |
4.97 |
16.78 |
![[thin space (1/6-em)]](https://www.rsc.org/images/entities/char_2009.gif) |
| Gaussian DFT/RB3LYP/6-31(d,p)/neutral |
| MA-0947 |
−838.77 |
−5.26 |
−1.60 |
3.66 |
1.83 |
0.55 |
3.43 |
4.21 |
| MA-0941 |
−854.81 |
−5.38 |
−1.81 |
3.57 |
1.79 |
0.56 |
3.60 |
3.28 |
| MA-0940 |
−1177.79 |
−5.44 |
−1.88 |
3.56 |
1.78 |
0.56 |
3.66 |
3.61 |
![[thin space (1/6-em)]](https://www.rsc.org/images/entities/char_2009.gif) |
| Gaussian DFT/RB3LYP/6-31(d,p)/protonated |
| MA-0947+ |
−839.25 |
−5.48 |
−2.33 |
3.14 |
1.57 |
0.64 |
3.90 |
21.50 |
| MA-0941+ |
−855.28 |
−5.59 |
−2.50 |
3.09 |
1.55 |
0.65 |
4.05 |
21.92 |
| MA-0940+ |
−1178.26 |
−5.65 |
−2.52 |
3.13 |
1.56 |
0.64 |
4.09 |
23.60 |
Fig. 11 shows FMOs (HOMO and LUMO) and the electron density was found to be distributed evenly on the whole bichalcophene molecules, suggesting a parallel adsorption onto CS surface. Dipole moment is also another important structural index, but it is clear from the results that the values of dipole moment cannot be related (whether in consensus or in contrast) with the measured inhibition efficiency because the order at which dipole moment decreases, inhibition efficiency increases, by contrast, for the protonated form of inhibitors this order was changed in the reverse order, i.e., the order at which dipole moment increased, inhibition efficiency increases. Accordingly, the experimental results is theoretically validated with ΔE and EA values as the order of these values calculated for neutral and protonated species is maintained and correlated with % η. We have also analyzed the HOMO, LUMO electronic distribution for the inhibitor molecules by Gaussian 09 and the results were in well accordance with the same using Dmol3 module in Material studio. Thereby after analyzing the electron density plots of HOMO and LUMO it is reasonable to say that the MA-0940 molecule acts as the best corrosion inhibitor among the three discussed molecules. The natural charges on atoms of studied compounds are presented in Fig. 12 where it is shown that nitrogen atoms (N19, N18) of amidino group bear more negative charge than other atoms, which indicates that these two atoms prefer to donate electrons to CS surface atoms and act as nucleophilic centers in interaction with the metal surface. Likewise, N4 in pyridine ring of (MA-0941, MA-0940) has higher negative charge than C4, its comparable in position, in phenyl ring of (MA-0947), which means that N4 in pyridine ring is a strong structural feature that serves as an additional nucleophilic site and enhances the inhibition potential for (MA-0941 and MA-0940). Furthermore, positive charge (+0.452) is observed on S13 in thiophene ring of (MA-0940), this indicates that sulfur atom act as a strong electrophilic site which seems necessary for a good inhibitor to balance and counteract the negative charge accumulated on iron surface atoms via back-donation,50 which is energetically favored as supported from the analysis of LUMO energy of MA-0940. The analysis of Fukui indices provide useful data about the local reactivity that atoms of organic compounds possess. By using the information obtained from Fukui functions, we can determine the atoms in a molecule with a higher tendency to accept and loose electrons. The nucleophilic (f+) and electrophilic (f−) Fukui indices were calculated using the finite difference approximation as follows.51
where
q(N+1),
q and
q(N−1) are the charges that atoms possess on systems with
N + 1,
N and
N − 1 electrons respectively. The preferential centers for nucleophilic attack is the region/atom in the molecule where the value of
f+ is the highest while the site for electrophilic attack is the region/atom in the molecule where the value of
f− is the highest. The Fukui functions (
f−,
f+) are given in
Table 9 and graphically presented in the ESI (Fig. S7).
† The results indicate that sulfur atom in MA-0940 contributes significantly in the nucleophilic and electrophilic attack which is in agreement with the HOMO analysis.
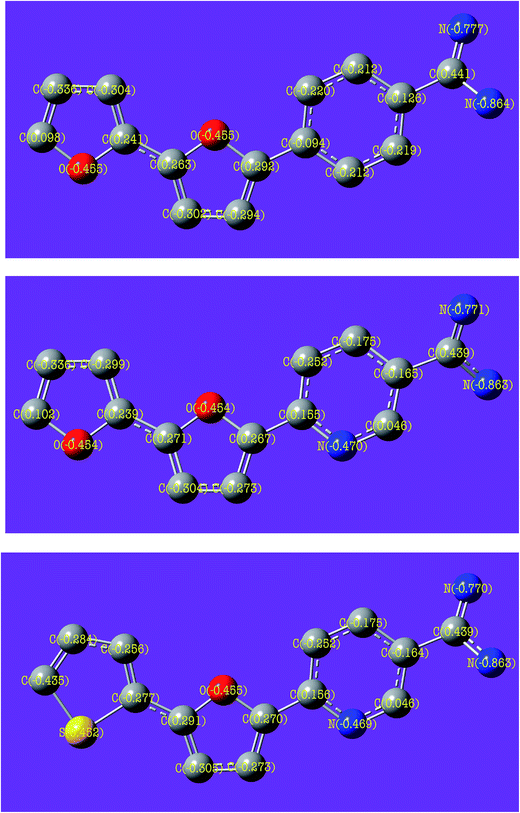 |
| | Fig. 12 Atomic charges (NBOs) calculated for investigated bichalcophene inhibitors calculated at DFT level and basis set 6-31 (d,p). | |
Table 9 Fukui indices for the investigated bichalcophene derivatives calculated at DFT level using DMol3
| MA-0947+ |
MA-0941+ |
MA-0940+ |
| Atom |
fk+ |
fk− |
Atom |
fk+ |
fk− |
Atom |
fk+ |
fk− |
| C (1) |
0.027 |
0.029 |
C (1) |
0.013 |
0.052 |
C (1) |
0.03 |
0.029 |
| C (2) |
0.019 |
0.019 |
C (2) |
0.022 |
0.016 |
C (2) |
0.019 |
0.019 |
| C (3) |
0.029 |
0.027 |
C (3) |
0.04 |
0.038 |
C (3) |
0.036 |
0.036 |
| C (4) |
0.029 |
0.031 |
N (4) |
0.013 |
0.012 |
N (4) |
0.01 |
0.011 |
| C (5) |
0.019 |
0.018 |
C (5) |
0.028 |
0.027 |
C (5) |
0.027 |
0.026 |
| C (6) |
0.031 |
0.030 |
C (6) |
0.034 |
0.032 |
C (6) |
0.030 |
0.031 |
| C (7) |
0.031 |
0.030 |
C (7) |
0.033 |
0.030 |
C (7) |
0.030 |
0.030 |
| O (8) |
0.022 |
0.018 |
O (8) |
0.023 |
0.021 |
O (8) |
0.019 |
0.020 |
| C (9) |
0.03 |
0.029 |
C (9) |
0.032 |
0.029 |
C (9) |
0.03 |
0.030 |
| C (10) |
0.032 |
0.034 |
C (10) |
0.038 |
0.035 |
C (10) |
0.031 |
0.031 |
| C (11) |
0.029 |
0.031 |
C (11) |
0.034 |
0.033 |
C (11) |
0.031 |
0.031 |
| C (12) |
0.030 |
0.028 |
C (12) |
0.031 |
0.030 |
C (12) |
0.014 |
0.018 |
| O (13) |
0.025 |
0.022 |
O (13) |
0.026 |
0.026 |
S (13) |
0.104 |
0.105 |
| C (14) |
0.042 |
0.043 |
C (14) |
0.047 |
0.043 |
C (14) |
0.033 |
0.033 |
| C (15) |
0.027 |
0.028 |
C (15) |
0.032 |
0.030 |
C (15) |
0.028 |
0.028 |
| C (16) |
0.033 |
0.035 |
C (16) |
0.039 |
0.036 |
C (16) |
0.033 |
0.033 |
| C (17) |
0.024 |
0.029 |
C (17) |
0.031 |
0.022 |
C (17) |
0.023 |
0.025 |
| N (18) |
0.021 |
0.020 |
N (18) |
0.035 |
0.022 |
N (18) |
0.025 |
0.027 |
| N (19) |
0.016 |
0.026 |
N (19) |
0.029 |
0.027 |
N (19) |
0.025 |
0.026 |
3.8. Monte Carlo simulation
Monte Carlo simulations was employed to identify the most stable adsorption sites on metal surfaces by identifying the lowest-energy adsorption configuration on both non-periodic and periodic substrates, besides investigating the preferential adsorption of mixtures of adsorbate components. The lowest energy configuration results from Monte Carlo simulation are presented in Fig. 13a. Several outputs and descriptors derived from Monte Carlo simulation are listed in Table 10.
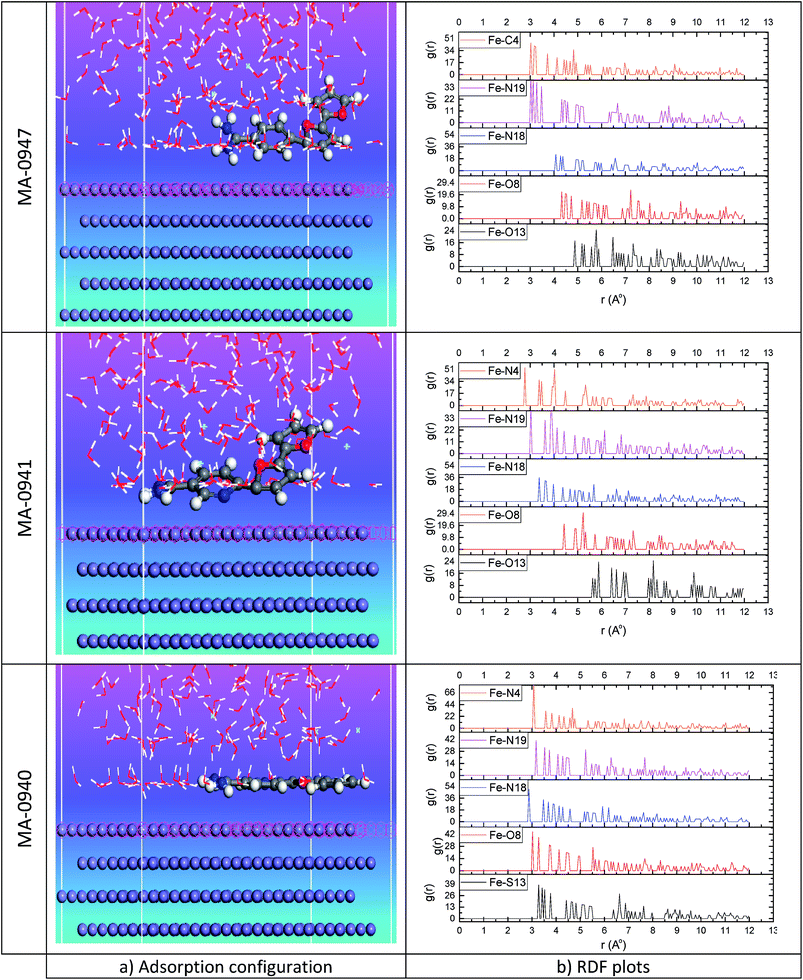 |
| | Fig. 13 (a) Equilibrium configuration adsorption of investigated bichalcophene on Fe (110) surface in HCl solution (b) RDF of C, N, O and S atoms from investigated compounds and Fe atoms from Fe (110). | |
Table 10 Data from MD modelling for adsorption of bichalcophene derivatives on Fe (110). The interaction energies (kcal mol−1)
| System |
Total energy (kcal mol−1) |
Adsorption energy (kcal mol−1) |
Rigid adsorption energy (kcal mol−1) |
Deformation energy (kcal mol−1) |
Compound dEad/dNi |
| MA-0947 |
−3295.51 |
−3703.20 |
−3536.73 |
−166.46 |
−232.94 |
| MA-0941 |
−3298.93 |
−3695.25 |
−3521.69 |
−173.56 |
−241.94 |
| MA-0940 |
−3292.66 |
−3710.95 |
−3505.69 |
−205.26 |
−253.79 |
As can be inferred from the results in Table 10, the adsorption energies of the investigated molecules increased in the following order MA-0940 < MA-0941 < MA-0947, and MA-0940 shows the maximum negative adsorption energy. Therefore, MA-0940 provides the highest inhibition abilities as compared to the other two inhibitors. These findings confirmed the observations from quantum computational and the experimental results. The pair correlation function g(r) was used to characterize the degree of atom disorder in the molecule and can give a measure of the probability of finding a pair of atoms at a given distance (r) in a random distribution. The pair correlation function has been applied in structural investigations of interaction between the liquid and solid materials and in studying specific interactions such as hydrogen bonding. The g(r) of the super molecular system is obtained through analyzing the trajectory output of MD simulation.8 In this part, we will consider the distribution of heteroatoms (N, O, and S) according to their importance on the adsorption process of chemical compounds on the metal surface. The pair correlation function, g(r), of C, N, S, and O of bichalcophene derivatives atoms and iron surface atoms was displayed in Fig. 13b. It is well recognized that the peak occurs at 1–3.5 Å, it's an indication of small bond length, which correlated to chemisorption, while the physical interactions (Coulomb and van der Waals forces) are associated with the peaks longer than 3.5 Å.52 For MA-0947-Fe (110) system, the highest peaks of RDF graphs for Fe–C4, Fe–N19, and Fe–N18 appear due to the formation of chemical bond at a distance 3.025, 3.025 and 4.075 Å respectively, while the existence of Coulomb forces between oxygen atoms and Fe surface atoms is indicated from the position of the highest peaks observed for Fe–O13 and Fe–O8 at 5.775 and 7.225 Å, respectively. Similar g(r) curves obtained for MA-0941-Fe (110) system, the highest peaks of RDF curve of Fe–N4, Fe–N19, and Fe–N18 occur at a distance 2.775, 3.875 and 3.375 Å, while for Fe–O13 and Fe–O8 the highest peaks was noted at 8.175 and 5.225 Å, respectively. For MA-0940-Fe (110), the highest peaks of g(r) curves for Fe–N4, Fe–N19, Fe–N18, Fe–O8 and Fe–S13 appear at a distance lower than 3.5 which composed of chemical bond.
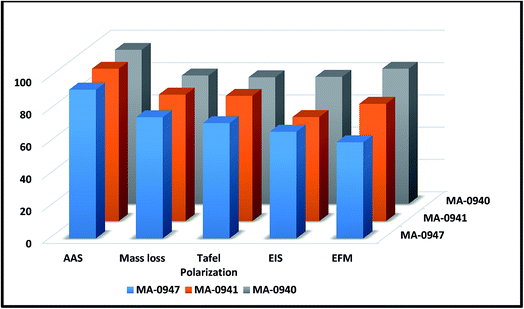 |
| | Fig. 14 Comparison of % η obtained from experimental techniques for corrosion of CS in 1 M HCl solutions containing 18 × 10−6 M of investigated compounds at 25 °C. | |
3.9. Mechanism of corrosion inhibition
The studied bichalcophenes exhibited good inhibition efficiencies which follow the order MA-0940 > MA-0941 > MA-0947 (Fig. 14). Their corrosion inhibition potentials account for some molecular structure features and the presence of heteroatoms; sulfur in thiophene and nitrogen in pyridine ring which serve as strong adsorption centers and enhance its inhibition efficiency. CS surface is accumulated with negative charge when immersed into HCl media because chloride ions adsorb on the metal surface [Fe + Cl−1⋯(FeCl−)ads]. In acid solutions bichalcophene derivatives could be easily protonated, [MA-0940], 1, 7] + H+ ⇌ [MA-0940], 1, 7]+, due to high electron density on it, leading to positively charged inhibitor species. The physical adsorption could occur via electrostatic interaction between protonated inhibitor molecules (+ve) and negatively charged CS surface (−ve).53 Additionally, chemical adsorption could occur via interaction of π-electrons of the aromatic rings of inhibitor with vacant d-orbitals of CS, results in formation of coordinate type of bond.54 Coordination bond can also be formed between the unshared electrons on hetero atoms and vacant d-orbitals of Fe atoms on CS surface. MA-0940 was the most efficient one because it has the highest molecular weight (342.2) and contains 3N, O, and S atom which is less electronegative and more basic than N and O atoms, so it shares more electrons to the molecule than N and O atoms. Compound MA-0941 comes after MA-0940 in % η because the molecular size (336.3) is lower and it contains 3N and 2O atoms only. Compound MA-0947 is the least effective one due to, it has the least molecular size (288.7) and it has only 2N and 2O atoms.
4. Conclusions
From the outcome of our investigation, it is possible to conclude that:
The corrosion inhibition efficiency of investigated bichalcophene compounds from ML, PP, EIS and EFM methods are in good agreement. PP studies revealed that bichalcophene derivatives act as mixed-type inhibitors. EIS measurements were analyzed to model the corrosion inhibition process by testing the appropriate equivalent circuit, a constant phase element (CPE) has been used. These bichalcophene compounds chemisorbed on metal surface and their adsorptions correspond to Langmuir's adsorption model with a large negative value of the free energy of adsorption  . Surface examination via means of AFM shows a remarkable mitigation of CS corrosion by formation of protective layer on CS surface. Both quantum chemical calculation and molecular dynamic simulations supported the experimental results that showed MA-0940 and MA-0941 as efficient corrosion inhibitors, and the order of inhibition efficiency, for the investigated bichalcophenes, is as follows: MA-0940 > MA-0941 > MA-0947.
Conflicts of interest
There are no conflicts to declare.
References
- C. A. Loto, R. T. Loto and A. P. I. Popoola, J. Mater. Environ. Sci., 2012, 3, 885–894 Search PubMed.
- S. M. A. El Haleem, S. A. El Wanees, E. E. A. El Aal and A. Farouk, Corros. Sci., 2013, 68, 1–13 CrossRef.
- A. S. Fouda, A. S. Abousalem and G. Y. EL-Ewady, Int. J. Ind. Chem., 2017, 8, 61–73 CrossRef.
- N. Yilmaz, A. Fitoz, Ü. Ergun and K. C. Emregül, Corros. Sci., 2016, 111, 110–120 CrossRef CAS.
- A. Ehsani, M. G. Mahjani, M. Hosseini, R. Safari, R. Moshrefi and H. M. Shiri, J. Colloid Interface Sci., 2017, 490, 444–451 CrossRef CAS PubMed.
- S. T. Selvi, V. Raman and N. Rajendran, J. Appl. Electrochem., 2003, 33, 1175–1182 CrossRef.
- M. Lagrenee, B. Mernari, M. Bouanis, M. Traisnel and F. Bentiss, Corros. Sci., 2002, 44, 573–588 CrossRef CAS.
- A. S. Fouda, M. A. Ismail, G. Y. EL-Elewady and A. S. Abousalem, J. Mol. Liq., 2017, 240, 372–388 CrossRef CAS.
- M. M. Youssef, M. A. Al-Omair and M. A. Ismail, Med. Chem. Res., 2012, 21, 4074–4082 CrossRef CAS.
- W. A. Hussin, M. A. Ismail and W. M. El-Sayed, Drug Des., Dev. Ther., 2013, 7, 185–193 CAS.
- W. M. El-Sayed and W. A. Hussin, Drug Des., Dev. Ther., 2013, 7, 73–81 CrossRef CAS PubMed.
- M. A. Ismail, R. K. Arafa, M. M. Youssef and W. M. El-Sayed, Drug Des., Dev. Ther., 2014, 8, 1659 CrossRef CAS PubMed.
- W. M. El-Sayed, W. A. Hussin and M. A. Ismail, Drug Des., Dev. Ther., 2012, 6, 279 CrossRef CAS PubMed.
- M. A. Ismail, J. Chem. Res., 2006, 2006, 733–737 CrossRef.
- M. A. Ismail, S. A. El Bialy, R. Brun, T. Wenzler, R. Nanjunda, W. D. Wilson and D. W. Boykin, Bioorg. Med. Chem., 2011, 19, 978–984 CrossRef CAS PubMed.
- B. Delley, J. Chem. Phys., 2000, 113, 7756–7764 CrossRef CAS.
- R. S. Mulliken, J. Chem. Phys., 1955, 23, 1833–1840 CrossRef CAS.
- A. E. Reed, L. A. Curtiss and F. Weinhold, Chem. Rev., 1988, 88, 899–926 CrossRef CAS.
- R. G. Pearson, Inorg. Chem., 1988, 27, 734–740 CrossRef CAS.
- R. G. Parr and R. G. Pearson, J. Am. Chem. Soc., 1983, 105, 7512–7516 CrossRef CAS.
- R. G. Parr, L. v. Szentpaly and S. Liu, J. Am. Chem. Soc., 1999, 121, 1922–1924 CrossRef CAS.
- H. Sun, P. Ren and J. R. Fried, Comput. Theor. Polym. Sci., 1998, 8, 229–246 CrossRef CAS.
- S. W. Bunte and H. Sun, J. Phys. Chem. B, 2000, 104, 2477–2489 CrossRef CAS.
- K. F. Khaled, J. Solid State Electrochem., 2009, 13, 1743–1756 CrossRef CAS.
- M. Gopiraman, N. Selvakumaran, D. Kesavan, I. S. Kim and R. Karvembu, Ind. Eng. Chem. Res., 2012, 51, 7910–7922 CrossRef CAS.
- A. K. Singh and M. A. Quraishi, Corros. Sci., 2010, 52, 1373–1385 CrossRef CAS.
- L. C. Murulana, M. M. Kabanda and E. E. Ebenso, RSC Adv., 2015, 5, 28743–28761 RSC.
- T. P. Hoar and R. D. Holliday, J. Appl. Chem., 1953, 3, 502–513 CrossRef CAS.
- O. L. Riggs Jr and R. M. Hurd, Corrosion, 1967, 23, 252–260 CrossRef.
- N. Soltani, N. Tavakkoli and M. Ghasemi, Int. J. Electrochem. Sci., 2016, 11, 8827–8847 CrossRef CAS.
- C. Verma, P. Singh, I. Bahadur, E. E. Ebenso and M. A. Quraishi, J. Mol. Liq., 2015, 209, 767–778 CrossRef CAS.
- L. O. Olasunkanmi, I. B. Obot and E. E. Ebenso, RSC Adv., 2016, 6, 86782–86797 RSC.
- M. Behpour, S. M. Ghoreishi, N. Soltani and M. Salavati-Niasari, Corros. Sci., 2009, 51, 1073–1082 CrossRef CAS.
- E. A. Noor and A. H. Al-Moubaraki, Mater. Chem. Phys., 2008, 110, 145–154 CrossRef CAS.
- M. A. Chidiebere, C. E. Ogukwe, K. L. Oguzie, C. N. Eneh and E. E. Oguzie, Ind. Eng. Chem. Res., 2012, 51, 668–677 CrossRef CAS.
- Y. Qiang, S. Zhang, S. Xu and W. Li, J. Colloid Interface Sci., 2016, 472, 52–59 CrossRef CAS PubMed.
- A. O. Yüce and G. Kardaş, Corros. Sci., 2012, 58, 86–94 CrossRef.
- Y. Qiang, S. Zhang, S. Xu and L. Yin, RSC Adv., 2015, 5, 63866–63873 RSC.
- A. Y. Musa, A. B. Mohamad, A. A. H. Kadhum, M. S. Takriff and L. T. Tien, Corros. Sci., 2011, 53, 3672–3677 CrossRef CAS.
- L. Hu, S. Zhang, W. Li and B. Hou, Corros. Sci., 2010, 52, 2891–2896 CrossRef CAS.
- A. Kosari, M. H. Moayed, A. Davoodi, R. Parvizi, M. Momeni, H. Eshghi and H. Moradi, Corros. Sci., 2014, 78, 138–150 CrossRef CAS.
- A. Biswas, S. Pal and G. Udayabhanu, Appl. Surf. Sci., 2015, 353, 173–183 CrossRef CAS.
- A. Ostovari, S. M. Hoseinieh, M. Peikari, S. R. Shadizadeh and S. J. Hashemi, Corros. Sci., 2009, 51, 1935–1949 CrossRef CAS.
- P. B. Raja, A. K. Qureshi, A. A. Rahim, H. Osman and K. Awang, Corros. Sci., 2013, 69, 292–301 CrossRef CAS.
- A. A. Hermas and M. S. Morad, Corros. Sci., 2008, 50, 2710–2717 CrossRef CAS.
- S. S. Abdel-Rehim, K. F. Khaled and N. S. Abd-Elshafi, Electrochim. Acta, 2006, 51, 3269–3277 CrossRef CAS.
- L. Yohai, M. Vázquez and M. B. Valcarce, Electrochim. Acta, 2013, 102, 88–96 CrossRef CAS.
- M. S. Masoud, M. K. Awad, M. A. Shaker and M. M. T. El-Tahawy, Corros. Sci., 2010, 52, 2387–2396 CrossRef CAS.
- S. K. Saha, A. Dutta, P. Ghosh, D. Sukul and P. Banerjee, Phys. Chem. Chem. Phys., 2016, 18, 17898–17911 RSC.
- N. O. Obi-Egbedi, I. B. Obot, M. I. El-Khaiary, S. A. Umoren and E. E. Ebenso, Int. J. Electrochem. Sci., 2011, 6, 5649–5675 CAS.
- A. K. Chandra and M. T. Nguyen, Int. J. Mol. Sci., 2002, 3, 310–323 CrossRef CAS.
- W. Wang, Z. Li, Q. Sun, A. Du, Y. Li, J. Wang, S. Bi and P. Li, Corros. Sci., 2012, 61, 101–110 CrossRef CAS.
- I. B. Obot, N. O. Obi-Egbedi and S. A. Umoren, Corros. Sci., 2009, 51, 1868–1875 CrossRef CAS.
- A. K. Singh and M. A. Quraishi, Corros. Sci., 2010, 52, 152–160 CrossRef CAS.
Footnote |
| † Electronic supplementary information (ESI) available. See DOI: 10.1039/c7ra08092a |
|
| This journal is © The Royal Society of Chemistry 2017 |
Click here to see how this site uses Cookies. View our privacy policy here.  Open Access Article
 a,
A. S. Abousalem
 *ab and
G. Y. Elewadya


![[thin space (1/6-em)]](https://www.rsc.org/images/entities/char_2009.gif)
![[thin space (1/6-em)]](https://www.rsc.org/images/entities/char_2009.gif)
![[thin space (1/6-em)]](https://www.rsc.org/images/entities/char_2009.gif)
 ) is related to corrosion rate CR as described by Arrhenius equation:26
![[thin space (1/6-em)]](https://www.rsc.org/images/entities/char_2009.gif) kcorr = log(R/Nh) + (ΔS*/2.303R) + ΔH*/2.303RT)
kcorr = log(R/Nh) + (ΔS*/2.303R) + ΔH*/2.303RT)


 is an important thermodynamic parameter which can be calculated from the following equation.33
 and
and  respectively) were calculated according to Van't Hoff equation:

 are negative and less than −40 kJ mol−1 which indicate that bichalcophenes are chemisorbed spontaneously on CS surface.
  values become more negative on increasing temperature. This reflects the endothermic nature of the adsorption process, which is further confirmed from the positive values of
  . In addition, the large positive values of
  is commonly typical with endothermic adsorption process. In general, an endothermic process is mostly attributed to chemisorption and involve electron transfer from inhibitor to metal surface to form coordinate bond while exothermic adsorption process suggests either physisorption or chemisorption.34 The unshared electron pairs in investigated molecules may interact with d-orbital of CS to provide chemisorbed film.
![[thin space (1/6-em)]](https://www.rsc.org/images/entities/char_2009.gif)
![[thin space (1/6-em)]](https://www.rsc.org/images/entities/char_2009.gif)
![[thin space (1/6-em)]](https://www.rsc.org/images/entities/char_2009.gif)


![[thin space (1/6-em)]](https://www.rsc.org/images/entities/i_char_2009.gif) =
= ![[thin space (1/6-em)]](https://www.rsc.org/images/entities/char_2009.gif) −1, an inductor. The values of Cdl were calculated as follows,
−1, an inductor. The values of Cdl were calculated as follows,
 , are the charge transfer resistances for CS in 1 M HCl solution with and without inhibitors, respectively.

![[thin space (1/6-em)]](https://www.rsc.org/images/entities/char_2009.gif)
![[thin space (1/6-em)]](https://www.rsc.org/images/entities/char_2009.gif)
![[thin space (1/6-em)]](https://www.rsc.org/images/entities/char_2009.gif)

![[thin space (1/6-em)]](https://www.rsc.org/images/entities/char_2009.gif)
![[thin space (1/6-em)]](https://www.rsc.org/images/entities/char_2009.gif)
![[thin space (1/6-em)]](https://www.rsc.org/images/entities/char_2009.gif)


 . Surface examination via means of AFM shows a remarkable mitigation of CS corrosion by formation of protective layer on CS surface. Both quantum chemical calculation and molecular dynamic simulations supported the experimental results that showed MA-0940 and MA-0941 as efficient corrosion inhibitors, and the order of inhibition efficiency, for the investigated bichalcophenes, is as follows: MA-0940 > MA-0941 > MA-0947.


